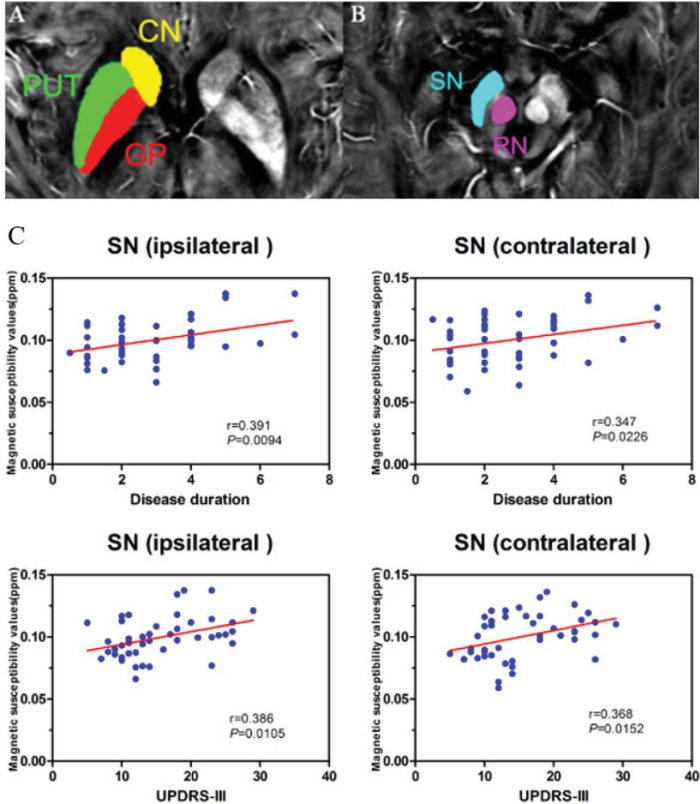
Figure 7.
QSM of early-stage PD illustrates the regions of deep brain nuclei (A, B): the head of caudate nucleus (CN); putamen (PUT); globus pallidus (GP); substantia nigra (SN); and red nucleus (RN). (C) Scatter plots and regression lines show the significant relationship between susceptibility values in bilateral SN and clinical measures in early-stage PD. Correlations are partialed for age. The susceptibility value of ipsilateral SN is positively correlated with disease duration (top left: r = 0.391, P = .0094) and UPDRS III score (bottom left: r = 0.386, P = .0105) in PD. The susceptibility value in SN contralateral to the most affected side in PD patients is positively correlated with disease duration (top right: r = 0.347, P = .0226) and UPDRS III score (bottom right: r = 0.368, P = .0152). Reproduced with permission from He et al. (76).

