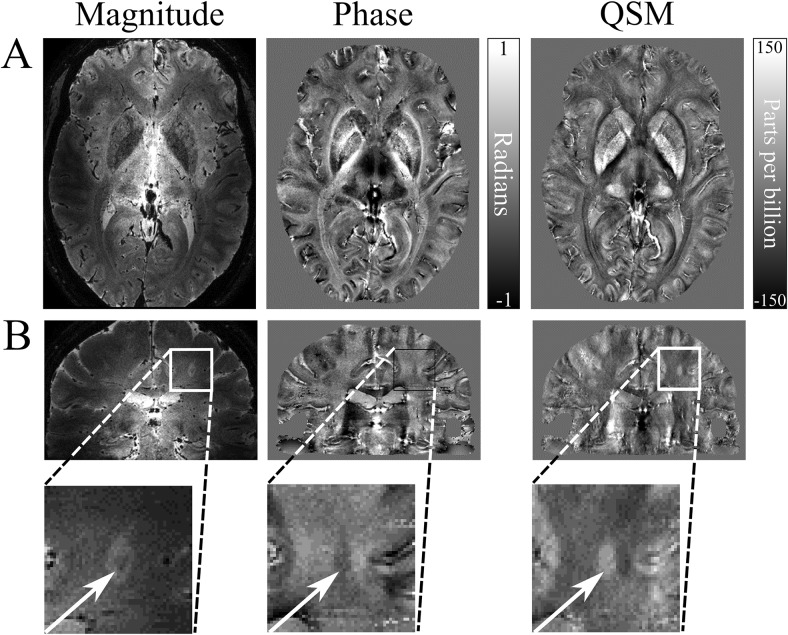
Figure 8.
Examples of QSM in the investigation of MS. (A) QSM values can be used as a marker of iron deposition in the deep gray matter, which is characteristic of MS. The susceptibility map shows good delineation of the deep gray matter structures in closer agreement with the magnitude image than the nonlocal phase contrast. (B) Some white matter lesions identified on GRE magnitude images appear in susceptibility maps as a result of either reduced myelin content, increased iron content, or a combination of these factors. Here, the QSM data depicts the lesion with a clear hyperintense core; however, the phase contrast is distorted, with a poorly defined lesion edge. The scan parameters are as follows: 7T; 0.5-mm3 isotropic resolution; TE = 20 ms; TR = 150 ms; FOV = 196 × 164 × 85 mm3; EPI factor = 3; and SENSE factor = 2. Images courtesy of the Sir Peter Mansfield Imaging Centre, University of Nottingham, United Kingdom.

