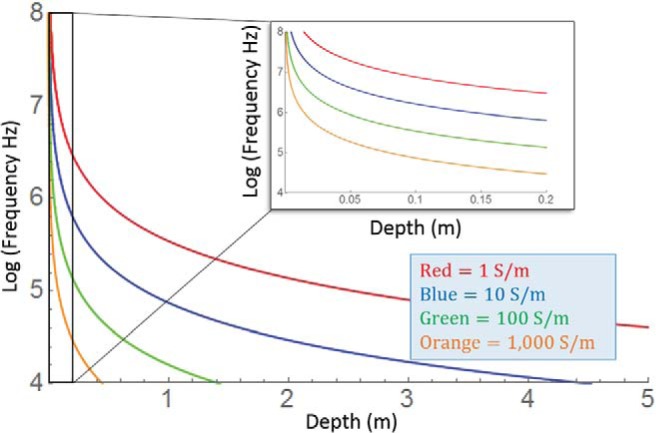
Figure 8.

Two-dimensional plots showing electromagnetic wave decay as a function of frequency and material depth. Lines show the frequencies and depths at which a wave is 50% attenuated for a given conductivity. The larger the conductivity, the more frequencies are attenuated at a given depth. In conductive material, the attenuation of high frequency components creates a low-pass filter that accounts for the temporal delay seen in simulations. Inset shows the boxed magnified.
