Abstract
Background
Before estimating smoothed percentiles of weight-for-height and BMI-for-age to construct the WHO growth charts, WHO excluded observations that were considered to represent unhealthy weights for height.
Objective
The objective was to estimate the effects of similar data trimming on empirical percentiles from the CDC growth-chart data set relative to the smoothed WHO percentiles for ages 24–59 mo.
Design
We used the nationally representative US weight and height data from 1971 to 1994, which was the source data for the 2000 CDC growth charts. Trimming cutoffs were calculated on the basis of weight-for-height for 9722 children aged 24–71 mo. Empirical percentiles for 7315 children aged 24–59 mo were compared with the corresponding smoothed WHO percentiles.
Results
Before trimming, the mean empirical percentiles for weight-for-height in the CDC data set were higher than the corresponding smoothed WHO percentiles. After trimming, the mean empirical 95th and 97th percentiles of weight-for-height were lower than the WHO percentiles, and the proportion of children in the CDC data set above the WHO 95th percentile decreased from 7% to 5%. The findings were similar for BMI-for-age. However, for weight-for-age, which had not been trimmed by the WHO, the empirical percentiles before trimming agreed closely with the upper percentiles from the WHO charts.
Conclusion
WHO data-trimming procedures may account for some of the differences between the WHO growth charts and the 2000 CDC growth charts.
INTRODUCTION
Growth charts are widely used tools for assessing the growth of individual children in clinical settings and for assessing the nutritional status of population samples. Such charts provide anthropometric data, such as stature or weight for stature, in the form of a set of percentiles that allow a child’s measurements to be compared with those of children of the same sex and age. In 2000, the National Center for Health Statistics/CDC constructed new growth charts primarily with data from the NHANES program from the 1960s, 1970s, and 1980s (1–3). These charts are known as the 2000 CDC Growth Charts for the United States. These charts are principally based on a combination of cross-sectional data from nationally representative surveys in the United States.
In 2006 the WHO released a new set of growth charts for children from birth through 5 y of age, known as the WHO Child Growth Standards (4). The WHO charts are based on different principles than are the aforementioned CDC growth charts.
The selection process for the WHO sample was different from that used for the CDC data. The WHO charts are based on a highly selected sample of children from sites in Brazil, Ghana, India, Norway, Oman, and the United States who were not subjected to socioeconomic constraints on growth, who were healthy term singleton births, who were fed according to prespecified feeding recommendations for breast and supplementary feeding, and whose mothers received intensive counseling and support and did not smoke before, during, or after pregnancy. In a prescriptive approach, it is assumed that the resulting growth charts will define the unimpeded growth of children (5). The WHO selection process used prespecified criteria to select a sample that would display healthy growth by definition. Issues related to the use of universal standards compared with local references have been the topic of considerable discussion (6).
In contrast, the CDC data came from nationally representative samples in the United States. Any differences between the WHO charts and the CDC charts may be attributed to these selection criteria taken as a whole. It is not clear how large the contribution of any given criterion might be or which criteria are the most important.
An additional aspect that can contribute to differences between the WHO and the CDC weight-for-height and BMI-for-age percentiles, beyond the methods of sample selection, is the WHO procedure followed to trim weights-for-height that they considered to be unhealthy. The WHO selection process used pre-specified criteria to select a sample that would display healthy growth by definition; however, after the data were examined, it was thought necessary to also exclude weight-for-height data for some children whose achieved growth was considered unhealthy. As a result, before calculating smoothed percentiles of weight-for-height, WHO trimmed the weight-for-height data to eliminate the observations for those children and used the same trimmed weight and height data to calculate the smoothed percentiles of BMI-for-age. Thus, for weight-for-height and BMI-for-age, the sample of children used for the WHO growth charts was additionally selected on the outcome variable, and this is another potential source of differences.
The purpose of this report was to apply trimming to the CDC growth-chart data that is similar to the trimming that was applied to the WHO data and assess the effect of such trimming on the empirical CDC weight-for-height, BMI-for-age, and weight-forage percentiles for ages 24–59 mo relative to the percentiles from the WHO charts.
METHODS
CDC growth chart data set
We used the data set that was used to create the 2000 CDC growth charts. Because this is the same data set, the empirical percentiles from this data set are very close to the smoothed percentiles from the 2000 CDC growth charts. The CDC 2000 growth charts were based on a different smoothing method than used for the WHO charts. For the CDC charts, a set of selected percentiles were smoothed separately by using a variety of parametric and nonparametric methods described in detail elsewhere (2). The CDC charts did not use the lambda-mu-sigma (LMS) smoothing method that was used for the WHO charts (4, 7). Although the CDC charts include LMS parameters, these were not created with the LMS method (7). Rather, the CDC LMS parameters were back-calculated from the previously smoothed percentiles and not from any other features of the data (2, 8). In general, the different smoothing methods should yield very similar results. However, to avoid confounding the present exercise with a potential methodologic change in smoothing criteria, the comparisons that follow are limited to the CDC empirical percentiles before and after trimming and the smoothed WHO percentiles.
Data trimming procedures
The WHO exclusions are described in the technical report (4) as follows:
“To avoid the influence of unhealthy weights for length/height, observations falling above +3 SD [standard deviations] and below −3 SD of the sample median were excluded prior to constructing the standards. For the cross-sectional sample, the +2 SD cut-off (i.e. 97.7 percentile) was applied instead of +3 SD as the sample was exceedingly skewed to the right, indicating the need to identify and exclude high weights for height. This cut-off was considered to be conservative given that various definitions of overweight all apply lower cut-offs than the one used (Daniels et al., 2005; Koplan et al., 2005). To derive the above-mentioned cut-offs based on the sex-specific weight-for-length/height indicator, the weight median and coefficient of variation curves were modeled continuously across length/height using an approach that accounted for the sample’s asymmetry as described below. The data were split into two sets: one set with all points above the median and another with all points below the median. For each of the two sets, mirror values were generated to create symmetrically distributed values around the median for the upper and lower sets. The generation of mirror data was necessary to simulate a symmetric distribution based on the distinct variabilities of the upper and lower sets. For each of the mirror data sets, median and coefficient of variation curves were estimated continuously across the length/height range using the LMS method (Cole and Green, 1992) fixing L=1, i.e. fitting a normal distribution to the data for each specific length/height value, to derive the corresponding cut-offs. In total, only a small proportion of observations were excluded for unhealthy weight-for length/height: 185 (1.4%) for boys and 155 (1.1%) for girls, most of which were in the upper end of the cross-sectional sample distribution (Table 5).” (7, 9, 10).
As shown in Table 5 of the WHO report, 2.7% of boys and 2.7% of girls in the cross-sectional sample (ages 18–71 mo) were excluded for high values of weight-for-height. These exclusion rates are very similar to the desired exclusion of 2.3% (equivalent to 2 SDs above the median) for the cross-sectional sample. For low values, the exclusion rate was 0.1% (equivalent to 3 SDs below the median).
We duplicated the WHO procedure to the extent feasible and excluded both high and low weight-for-height values from the original CDC growth-chart data set in a manner broadly consistent with the WHO procedure. As with the WHO procedure, the exclusions were based on the data set itself and not on an external standard.
The WHO cross-sectional sample covers ages 18–71 mo. Because the CDC growth-chart data set does not have standing height for children younger than age 24 mo, we used the CDC growth-chart weight and height data set for 9722 children aged 24 mo through 71 mo to find the trimming cutoff values. We created 40 height categories for each sex such that each contained roughly 5% of the sample size for that sex. The height range within each height category was <2 cm except for the 2 extreme categories at the low and high ends of the distribution. Within each height category, we used empirically determined fixed percentile cutoffs of the 98th and 0.4th percentiles to match the trimming levels used by WHO (after sample weighting, these cutoffs trimmed the top 2.7% and the bottom 0.1% of the CDC sample) to provide cutoff values for trimming. We also used a mirroring procedure for the height groups similar to that used by WHO and used estimated SDs within the mirrored data sets to calculate data exclusions; the results were very similar (data not shown).
Comparisons of trimmed and untrimmed CDC data with WHO smoothed percentiles
Although the WHO cross-sectional sample covers ages 18–71 mo, the WHO BMI-for-age percentiles are available only for children aged 24–59 mo. Thus, we limited our comparisons to that age range. We calculated empirical weight-for-height percentiles from the CDC growth-chart data set for 7315 children aged 24–59 mo and compared them with the smoothed percentiles from the WHO charts. Selected empirical percentiles of weight (5th, 10th, 25th, 50th, 75th, 85th, 95th, and 97th percentiles) from the CDC data set were calculated within each height group. The empirical percentiles are height- and sex-specific weighted unsmoothed percentiles. We then recalculated the same sex- and height-specific weight percentiles after trimming by excluding weight values that were above the selected cutoffs within each height group.
Selected WHO smoothed percentiles of weight-for-height (5th, 10th, 25th, 50th, 75th, 85th, 95th, and 97th percentiles) were calculated for each child in the CDC data set. For graphic comparisons of the untrimmed and trimmed empirical percentiles with the WHO smoothed percentiles, all values were averaged over the CDC data set for ages 24–59 mo for children with height below 120 cm, the maximum height in the published WHO weight-for-height percentiles. We also estimated the proportion of children in the CDC growth-chart data set who had weight-for-height values above the 95th percentile of the corresponding age- and sex-specific smoothed WHO weight-for-height values, both before and after the trimming.
Application to BMI-for-age and other percentiles
BMI is calculated as weight (kg)/height (m)2. For children, BMI varies with age, and growth charts show BMI-for-age values. After the WHO procedure, we applied the exclusions based on the weight-for-height charts to calculate empirical percentiles for BMI-for-age from the CDC data set. We used the CDC data set for ages 24–59 mo (n = 7315) because the WHO BMI-for-age percentiles are limited to that age range. Age in the CDC data set was expressed as completed months; we used the midpoint of the month to approximate the mean age of children in that age group.
For each month of age, we calculated the empirical percentiles of BMI before and after trimming; we also calculated the corresponding smoothed WHO percentiles for the age of each child. We compared the weighted mean empirical 5th, 10th, 25th, 50th, 75th, 85th, 95th, and 97th percentiles from the CDC data set to the corresponding smoothed percentiles from the WHO charts. We then recalculated the CDC empirical percentiles after applying the trimming exclusions. For the graphic presentation, we averaged each of the empirical and smoothed percentiles over the data set. We also estimated the proportion of children in the CDC growth-chart data set who had BMI-for-age values above the 95th percentile of the WHO sex-specific smoothed BMI-forage values, both before and after the trimming. For completeness, we applied the trimming based on the weight-for-height data to the weight-for-age data to examine how the trimming would have affected that measure as well.
RESULTS
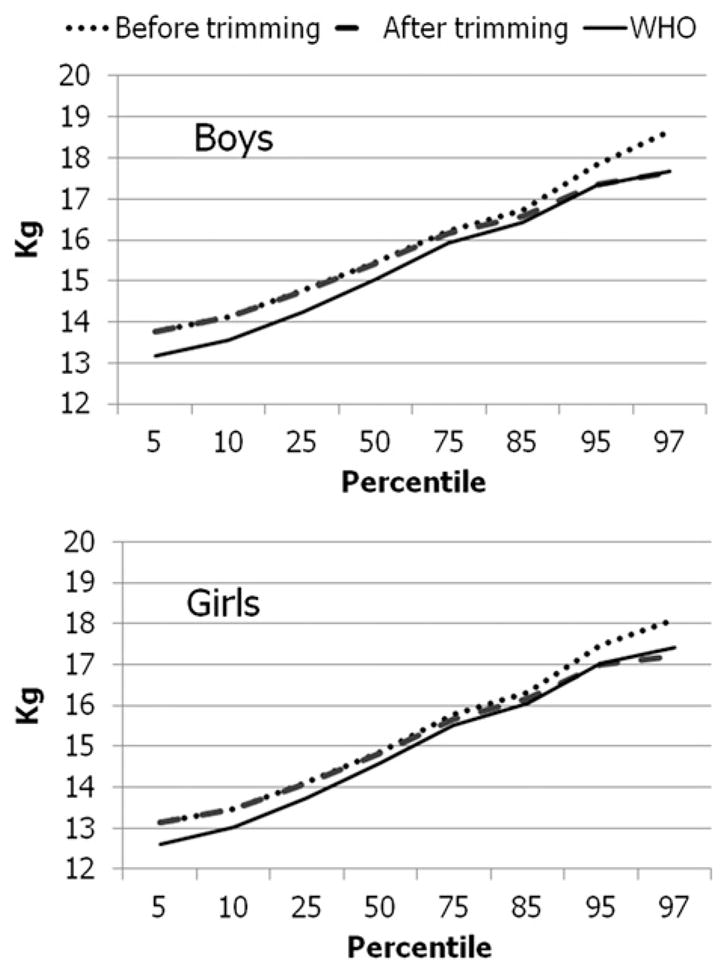
Characteristics of the data set are shown in Table 1. Mean percentiles of weight-for-height by sex are shown in Figure 1. Before trimming, the mean empirical percentiles of weight-for-height in the CDC data set were higher than the mean values of the corresponding WHO percentiles at all percentile levels.
TABLE 1.
Descriptive data for children aged 24–59 mo with a height <120 cm
| Boys | Girls | |
|---|---|---|
| Unweighted sample size (n) | 3728 | 3587 |
| Height (cm) | 98.5 (73.5–119.3)1 | 97.3 (68.9–119.2) |
| Weight (kg) | 15.7 (8.1–35.2) | 15.1 (6.2–40.3) |
| BMI (kg/m2) | 16.1 (7.5–34.4) | 15.9 (10.8–34.1) |
Mean; range in parentheses (all such values).
FIGURE 1.

Mean empirical percentiles of weight-for-height before and after trimming and mean corresponding WHO smoothed percentiles for boys (n = 3728) and girls (n = 3587) aged 24–59 mo.
Trimming had little or no effect on the empirical values at the lower percentiles, but at higher percentiles, the empirical values became closer to and sometimes even fell below the WHO percentiles after trimming. At the 95th percentile of weight-for-height, the mean difference between the empirical percentile and the WHO smoothed percentile for boys was 0.58 kg before trimming and −0.01 kg after trimming. For girls, the mean difference at the 95th percentile was 0.53 kg before trimming and 0.08 after trimming. In contrast, at the 5th percentile of weight-for-height, the mean difference between the empirical percentile and the WHO smoothed percentile changed from 0.59 to 0.58 kg after trimming for boys and from 0.42 to 0.41 kg for girls.
The trimmed values of weight-for-height were used to estimate BMI-for-age. For children aged 24–59 mo (the ages represented by the WHO BMI-for-age charts), the trimming based on weight-for-height for children aged 24–71 mo excluded 3% of the BMI-for-age values. Because weight-for-height differs from BMI-for-age (11), the highest weight-for-height values did not correspond completely to the highest BMI-for-age values. Not all of the highest BMI-for-age values were trimmed, and not all of the trimmed values were among the highest BMI-for-age values. Of the upper 3% of the BMI-for-age values, 42% were not trimmed; 13% of the trimmed values were below the 95th percentile of the BMI-for-age values.
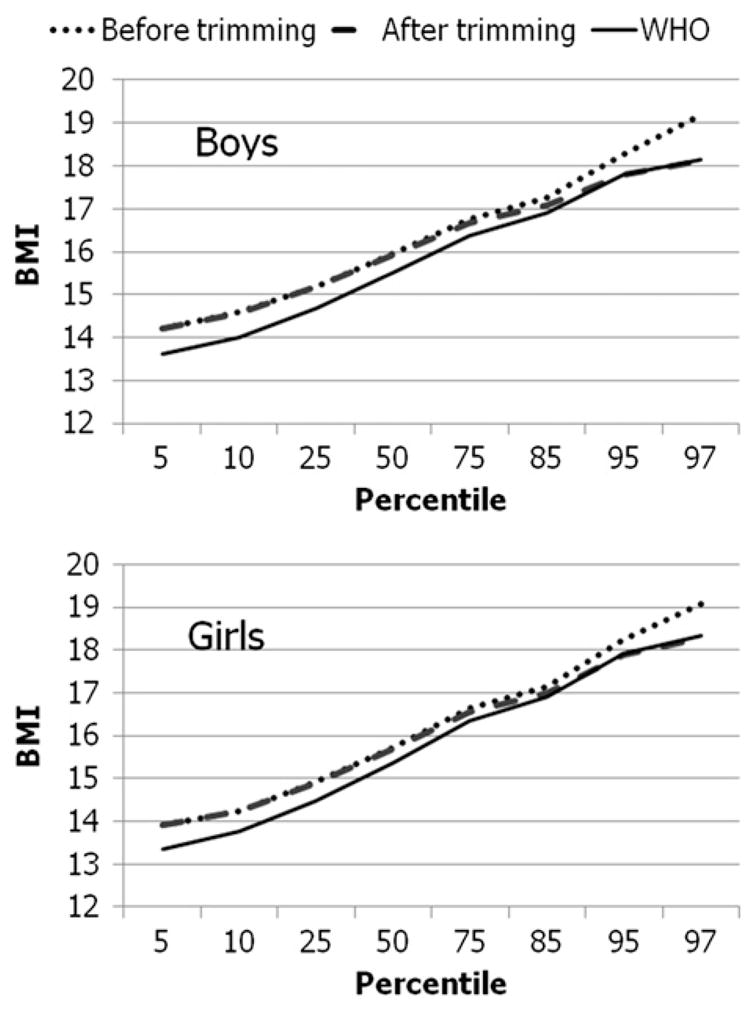
The effects of trimming for BMI-for-age are shown in Figure 2. For boys, the mean empirical 95th percentile of BMI-for-age from the CDC data set was 0.50 BMI units higher than the mean WHO percentile before trimming, but after trimming the difference fell to 0.01. For girls, the mean difference between the empirical 95th percentile of BMI-for-age from the CDC data set and the corresponding WHO percentile was 0.33 BMI units before trimming and −0.02 after trimming.
FIGURE 2.

Mean empirical percentiles of BMI-for-age before and after trimming and mean corresponding WHO smoothed percentiles for boys (n = 3728) and girls (n = 3587) aged 24–59 mo.
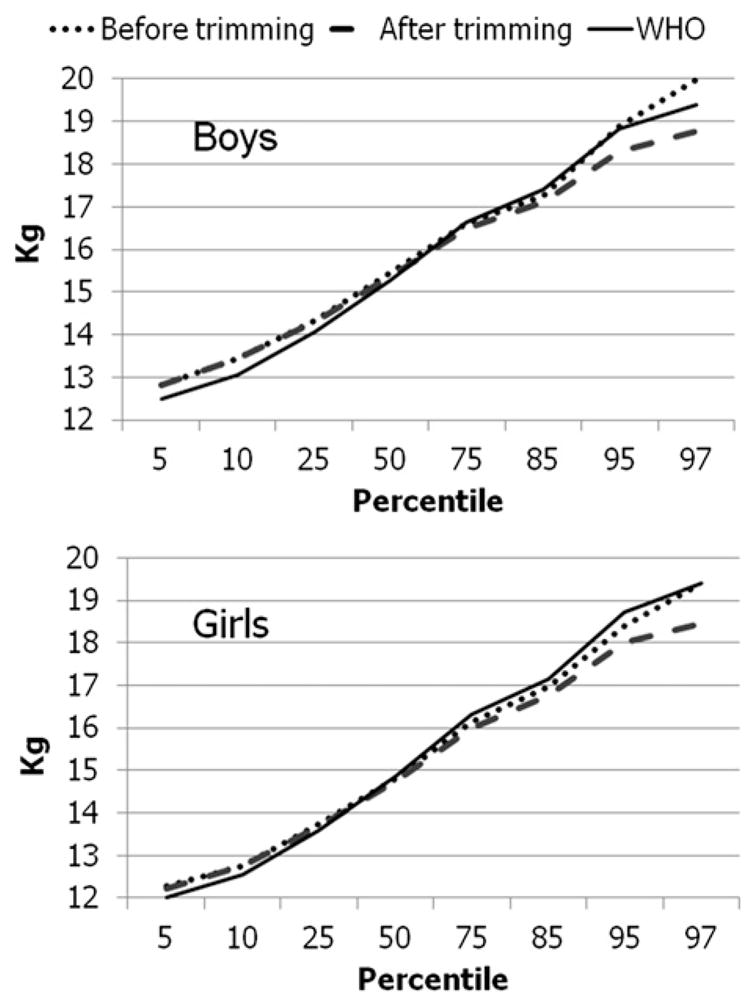
Although WHO considered the trimmed weights to represent unhealthy values, they did not exclude the trimmed weights in construction of the weight-for-age charts. The sex-specific mean empirical weight-for-age percentiles and the smoothed WHO percentiles are shown in Figure 3. In contrast with the findings for weight-for-height and BMI-for-age, the upper mean empirical percentiles for weight-for-age were similar to the smoothed WHO percentiles before trimming and fell below the WHO percentiles after trimming. For the 95th percentile of weight-for-age for boys, the mean empirical percentile was 0.06 kg higher than the mean WHO percentile before trimming, but the difference fell to −0.43 kg after trimming. The corresponding values for girls were −0.34 kg before trimming and −0.71 after trimming.
FIGURE 3.

Mean empirical percentiles of weight-for-age before and after trimming and mean corresponding WHO smoothed percentiles for boys (n = 3728) and girls (n = 3587) aged 24–59 mo.
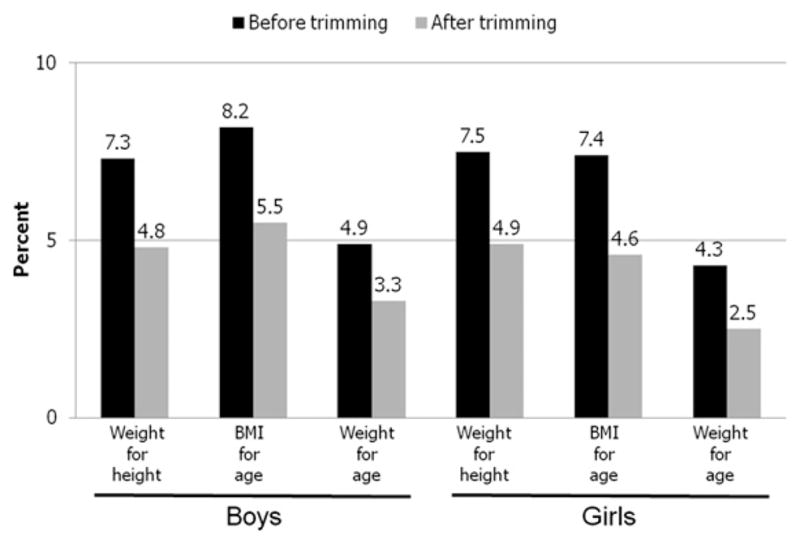
The above analyses represent the mean values over the entire CDC data set. To assess the effects by using data on individual children, we estimated the proportion of children in the CDC data set who fell above the 95th percentile of the individual sex- and height-specific smoothed WHO percentiles for weight-for-height and of the sex- and age-specific smoothed WHO percentiles for BMI-for-age and weight-for-age, both before and after trimming, with results as shown in Figure 4. Before trimming, 7.3% of boys and 7.5% of girls in the sample were above the 95th percentile of the sex- and height-specific WHO smoothed weight-for-height values; after trimming, 4.8% of boys and 4.9% of girls were above the WHO 95th percentile for sex and height. The results were similar for BMI-for-age. However, for weight-forage, the proportion of children above the 95th percentile of the WHO weight-for-age charts was already slightly <5% before trimming and fell yet further after trimming.
FIGURE 4.

Prevalence of values in the CDC data set above the 95th percentile of the WHO charts before and after trimming for boys (n = 3728) and girls (n = 3587) aged 24–59 mo.
DISCUSSION
For the children in the CDC growth-chart data set, the upper smoothed percentiles of both weight-for-height and BMI-for-age from the WHO charts were lower than the corresponding empirical percentiles. WHO had applied trimming procedures to their weight-for-height data before the smoothed percentiles for the WHO weight-for-height and BMI-for-age charts were calculated. Similar trimming procedures, when applied to the CDC growth-chart data, produced empirical percentiles that were close to and sometimes even lower than the WHO smoothed percentiles at the upper percentiles of weight-for-height and BMI-for-age. This suggests that the trimming procedures used by WHO should be considered as another potential source contributing to the differences between the CDC growth charts and the smoothed percentiles of the WHO charts at the upper percentiles of weight-for-height and BMI-for-age. Thus, the differences between the WHO and CDC smoothed curves of weight-for-height and BMI-for-age are not necessarily attributable only to the multiple differences in sample selection but could also be due to the data-trimming procedures.
The WHO trimmed the data to eliminate weights-for-height that were considered unhealthy, justifying this by referencing several sources that considered the 95th percentile of BMI-forage to define overweight. However, because weight-for-height is not equivalent to BMI-for-age (11), trimming the highest height-specific values of weight-for-height is not equivalent to trimming the highest values of BMI-for-age. We found that >40% of the children in the top 3% of BMI-for-age were not excluded by the trimming procedure. The WHO procedure excluded children with high weights-for-height from the weight-for-height smoothing because their weights were considered unhealthy, but those children were not excluded from the weight-for-age smoothing.
The results reported here, based on the empirical percentiles, suggest that had trimming procedures similar to those used by WHO been applied to the CDC weight-for-height data, the empirical CDC percentiles for weight-for-height and BMI-for-age would have been similar to the corresponding WHO smoothed percentiles at higher levels. WHO did not apply the trimming procedure to the weight-for-age charts, and the WHO smoothed percentiles were similar to or above the untrimmed CDC empirical percentiles for weight-for-age.
The WHO data-trimming procedures may account for some of the differences between the higher percentiles of weight-for-height and BMI-for-age from the WHO growth charts and the 2000 CDC growth charts.
Footnotes
There was no external funding for this study.
The authors’ responsibilities were as follows—KMF: designed the study, carried out the analysis, and wrote the first draft; and MDC and CLO: assisted with the data and reviewed and edited the manuscript for important intellectual contributions. None of the authors had any financial conflicts of interest.
References
- 1.Kuczmarski RJ, Ogden CL, Grummer-Strawn LM, Flegal KM, Guo SS, Wei R, Mei Z, Curtin LR, Roche AF, Johnson CL. CDC growth charts: United States. Adv Data. 2000;8:1–27. [PubMed] [Google Scholar]
- 2.Kuczmarski RJ, Ogden CL, Guo SS, Grummer-Strawn LM, Flegal KM, Mei Z, Wei R, Curtin LR, Roche AF, Johnson CL. CDC growth charts for the United States: methods and development. Vital Health Stat. 2002;11:1–190. [PubMed] [Google Scholar]
- 3.Ogden CL, Kuczmarski RJ, Flegal KM, Mei Z, Guo S, Wei R, Grummer-Strawn LM, Curtin LR, Roche AF, Johnson CL. Centers for Disease Control and Prevention 2000 growth charts for the United States: improvements to the 1977 National Center for Health Statistics version. Pediatrics. 2002;109:45–60. doi: 10.1542/peds.109.1.45. [DOI] [PubMed] [Google Scholar]
- 4.WHO. WHO child growth standards: length/height-for-age, weight-for-age, weight-for-length, weight-for height and body mass index-for-age: methods and development. Geneva, Switzerland: World Health Organization; 2006. [Google Scholar]
- 5.Mei Z, Ogden CL, Flegal KM, Grummer-Strawn LM. Comparison of the prevalence of shortness, underweight, and overweight among US children aged 0 to 59 months by using the CDC 2000 and the WHO 2006 growth charts. J Pediatr. 2008;153:622–8. doi: 10.1016/j.jpeds.2008.05.048. [DOI] [PubMed] [Google Scholar]
- 6.Milani S, Buckler JM, Kelnar CJ, Benso L, Gilli G, Nicoletti I, Faglia G, Radetti G, Bona G, Schonbeck Y, et al. The use of local reference growth charts for clinical use or a universal standard: a balanced appraisal. J Endocrinol Invest. 2012;35:224–6. doi: 10.1007/BF03345422. [DOI] [PubMed] [Google Scholar]
- 7.Cole TJ, Green PJ. Smoothing reference centile curves: the LMS method and penalized likelihood. Stat Med. 1992;11:1305–19. doi: 10.1002/sim.4780111005. [DOI] [PubMed] [Google Scholar]
- 8.Flegal KM, Wei R, Ogden CL, Freedman DS, Johnson CL, Curtin LR. Characterizing extreme values of body mass index for age by using the 2000 Centers for Disease Control and Prevention growth charts. Am J Clin Nutr. 2009;90:1314–20. doi: 10.3945/ajcn.2009.28335. [DOI] [PubMed] [Google Scholar]
- 9.Daniels SR, Arnett DK, Eckel RH, Gidding SS, Hayman LL, Kumanyika S, Robinson TN, Scott BJ, St JS, Williams CL. Overweight in children and adolescents: pathophysiology, consequences, prevention, and treatment. Circulation. 2005;111:1999–2012. doi: 10.1161/01.CIR.0000161369.71722.10. [DOI] [PubMed] [Google Scholar]
- 10.Koplan JP, Liverman CT, Kraak VI. Preventing childhood obesity: health in the balance: executive summary. J Am Diet Assoc. 2005;105:131–8. doi: 10.1016/j.jada.2004.11.023. [DOI] [PubMed] [Google Scholar]
- 11.Flegal KM, Wei R, Ogden C. Weight-for-stature compared with body mass index-for-age growth charts for the United States from the Centers for Disease Control and Prevention. Am J Clin Nutr. 2002;75:761–6. doi: 10.1093/ajcn/75.4.761. [DOI] [PubMed] [Google Scholar]


