

Abstract
Objectives
As the Ebola virus disease is still sustained in Sierra Leone, we analysed the epidemic for a recent period (21 December 2014 to 17 April 2015) using a small-world networked model and forecasted its evolution. Policy-control scenarios for the containment of the epidemic were also examined.
Methods
We developed an agent-based model with 6 million individuals (the population of Sierra Leone) interacting through a small-world social network. The model incorporates the main epidemiological factors, including the effect of burial practices to virus transmission. The effective reproductive number (Re) was evaluated directly from the agent-based simulations. Estimates of the epidemiological variables were computed on the basis of the official cases as reported by the Centers for Disease Control and Prevention (CDC).
Results
From 21 December 2014 to 18 February 2015 the epidemic was in recession compared with previous months, as indicated by the estimated Re of ∼0.77 (95% CI 0.72 to 0.82). From 18 February to 17 April 2015, the Re rose above criticality (∼1.98, 95% CI 1.33 to 2.22), flashing a note of caution for the situation. By projecting in time, we predicted that the epidemic would continue through July 2015. Our predictions were close to the cases reported by CDC by the end of June, verifying the criticality of the situation. In light of these developments, while revising our manuscript, we expanded our analysis to include the most recent data (until 15 August 2015). By mid-August, Re had fallen below criticality and the epidemic was expected to fade out by early December 2015.
Conclusions
Our results call for the continuation of drastic control measures, which in the absence of an effective vaccine or therapy at present can only translate to isolation of the infected section of the population, to contain the epidemic.
Keywords: EPIDEMIOLOGY, INFECTIOUS DISEASES, PUBLIC HEALTH
Strengths and limitations of this study.
The greatest strength of this study stems from the undertaken mathematical approach of choice, integrating agent-based modelling on complex networks and the so-called equation-free approach.
Various important epidemiological parameters were assessed and accurate short-term forecasts of the evolution of the Ebola virus disease epidemic in Sierra Leone were obtained.
Another advantage of the proposed methodology is that it allows for the rapid evaluation of different policy-control scenarios that could lead to the containment of the epidemic.
Our predictions were verified by the official case count reported by Centers for Disease Control and Prevention.
The most important limitation of our study pertains to the quality and accuracy of the outbreak data that were “fed” to the mathematical model, compared with the real figures.
Even though under-reporting of cases and deaths is to be expected under the particular circumstances of such a severe epidemic, real-life figures agree well with the projections of our analysis.
Introduction
The worst Ebola virus disease (EVD) epidemic in history continues to ravage West Africa. The epidemic began with the report of 49 cases and 29 deaths in Guinea on 22 March 2014.1 Liberia reported its first laboratory-confirmed cases on 30 March 2014, while the first cases in Sierra Leone were reported on 28 May 2014.2 Following regular daily population movements for trade and family visitation, the virus crossed the local porous international borders, establishing chains of transmission not only in small villages, where it would have been easier to contain, but also in large urban centres. Insufficient public health infrastructure, poor sanitation conditions, lack of education about the disease and unsafe traditional burial practices have also contributed to the spread of the epidemic in the region.2
In Liberia, one of the most affected countries, as of 20 April 2015, a total of 10 042 cases have been recorded, while the death toll has exceeded 4480.3 In early March, a halt of the epidemic was announced, and even though a new case was confirmed on 20 March 2015, the epidemic was considered to have ceased, while the situation in Sierra Leone was notably different. With more than 12 360 cases and 3900 deaths until now, Sierra Leone experienced a drop in new cases in January 2015 and authorities loosened mobilisation restriction measures to support economic activity.4 However, recent WHO updates on the status of the EVD epidemic in this West African nation reported a flare up,3 with a significant increase among the community of fishermen living in the coastal area of Aberdeen in Freetown.5 The synchronous occurrence of over 20 cases suggested they had been infected by a single source, possibly an unsafe burial.5
In light of these recent developments, we analysed the EVD epidemic dynamics in Sierra Leone for the period from 21 December 2014 to 17 April 2015, using an agent-based, social network model that we reported recently and that proved to provide accurate predictions for the case of Liberia.6 For this purpose, the latest official case counts from WHO were fitted to the model, following the so-called equation-free approach.7 Our main objective was to obtain estimates of key epidemiological parameters, such as the indicative of secondary infections, effective reproductive number (Re), the case fatality rate (CFR), the percontact transmission probability and the mean time from symptoms onset to recovery or to death, in order to study the evolving dynamics through the social transmission network—the structure and density of which are also examined. Secondary objectives of the study included the exploration of different policy-control scenarios that could lead to reduced Re values, and, thereby, to containment of the epidemic.
Methods
We developed an agent-based model for the study of the Ebola epidemic6 with N individuals who interact through a Watts and Strogatz8 small-world network that approximates some attributes of the real social interactions, which are characterised by relatively high clustering and short social distances between them. Here, the network was constructed with the Newman-Watts9 algorithm, in which short-cut edges are added between pairs of nodes with a probability, in the same way as in a WS network, but without removing edges from the underlying lattice. The algorithm starts with a one-dimensional ring network with  local-nearest neighbours per node and with a probability
 that a link is added between two nodes. Hence, the mean number of additional shortcuts is
 , and the mean total degree of the network is
  . In the constructed small-world network, we can adjust the density of the network, say α, at will, by randomly adding or subtracting the required number of links.
Agents are categorised in five discrete states: Susceptible
 , Exposed
 , Infected
 , Dead of the disease but not yet buried
 , Dead of the disease and safely buried
 and Recovered
 .6 The DI infectious state includes agents who die, but whose burial entails risk for onward virus transmission. The transition between states is modelled as a discrete-time, discrete state non-Markov random process. Within this framework, the state space over the set of the network links is represented by
  , where
  is the set of the states of individual
  .
.
The agent-based rules that govern the dynamics of the epidemic on a daily basis read as follows:
| 1 |
 |
2 |
| 3 |
| 4 |
| 5 |
where  is the per infected contact transmission probability (still alive or dead, but not yet buried),
  is the inverse of the incubation period,
  is the inverse of the time from symptoms onset to death,
  is the inverse of the recovery period and
 is the ratio of deaths to the infected population.6 The rate of the incubation period is taken to be constant, set at
 , as reported by the WHO Ebola Response Team.10
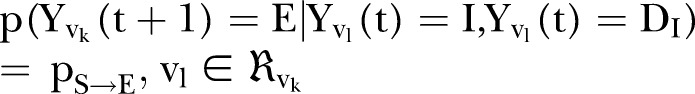
 denotes the neighbourhood of an individual
  . This first rule sets the time period from death to burial to 2 days, during which family members and loved ones may be infected due to physical contact with the dead, still-contagious body. Long-range links of a dead, yet potentially infectious, agent are cut, reflecting the fact that only relatives and close community members can be infected during unsafe funeral practices and rites. The second rule implies that a susceptible agent gets exposed to the disease, with a rate determined by the probability
  per infected contact (still alive or dead, but not yet buried). The third rule implies that an exposed agent becomes infectious with a rate determined by the probability
 , the inverse of which corresponds to the incubation period, that is, the time from exposure to symptoms onset.
Rules (4) and (5) define the CFR,  : an agent dies of the disease with a rate determined by the probability
  (where inverse is the time from symptoms onset to death) (rule (4)); alternatively, an agent could recover with a rate determined by the probability
  (rule (5)).
The effective reproductive ratio  , defined as the average number of secondary infections produced by a typical infective person, is also computed directly from the agent-based simulations.
On the basis of the demographics reported by the United Nations, the population of Sierra Leone is 6 million.11 Time series of the official Ebola case counts from the Centers for Disease Control and Prevention (CDC) were used for model fitting.3 These case counts were collected from public data released by the WHO12 and CDC.3 Even though these data sets do not distinguish between suspect, probable and laboratory-confirmed case counts, they are considered to represent the best available estimates of the current state of the epidemic in the severely afflicted West African countries. Case data, which included cumulative incidence and cumulative deaths by date of report for Sierra Leone, were retrieved on 24 April 2015.
Simulations were performed using 21 December 2014 as an initial date and a time horizon of 60 days with an equal sliding window time interval; the last date was 17 April 2015. Thus, fitted values of the network and model parameters, as well as estimates of the effective reproductive ratio, were computed in sequences of succeeded time intervals of 60 days corresponding to two periods (21 December 2014 to 18 February 2015 and 18 February–17 April 2015). The initial conditions for the starting date of 21 December 2014 were calculated on the basis of agent-based simulations from 27 May 2014, that is, the date on which the first cases were officially reported from WHO,2 following the procedure described in detail elsewhere.6 In particular, we obtained the following (expected) numbers for 21 December 2014:  =450,
=450,  =901,
=901,  =2390,
  =28,
=28,  =5579; the estimated cumulative number of cases then was 8828.
The expected (averaged) values of the agents’ states  were computed over
  =8 network realisations and
  =100 simulations for each of the network realisations. The model parameters were fitted to the reported data using a trust-region-reflective approach for non-linear minimisation, implemented for parameter estimation13 exploiting the equation-free approach.7
14–18 Matlab19 was the simulation environment of choice, while the model was programmed in Fortran 90 and linked to Matlab through mex files.
=100 simulations for each of the network realisations. The model parameters were fitted to the reported data using a trust-region-reflective approach for non-linear minimisation, implemented for parameter estimation13 exploiting the equation-free approach.7
14–18 Matlab19 was the simulation environment of choice, while the model was programmed in Fortran 90 and linked to Matlab through mex files.
To forecast the evolution of the Ebola virus epidemic in Sierra Leone, we used the values of the model parameters as estimated in the last period; the resulting parameter values were then fed to the simulator, using as coarse initial conditions the values of  as computed on 17 April 2015. We tested the effect of control policy scenarios by reducing the density of the network structure as estimated in the second period. Sparser network densities could reflect partial isolation of the population, restriction of social mobilisation combined with an expanded public campaign for increased awareness.
Results and discussion
The cumulative numbers of infected and dead obtained by the model compared with the reported cases in Sierra Leone are shown in figure 1. Our framework succeeds in approximating the actual data for total cases and deaths.3 For example, on 21 December 2014, the total number of cases, as reported by the WHO, was 9004 and the number of deaths was 2582, while our simulations resulted in 8828 cases and ∼2400 deaths. On 18 February 2015, the total cases and deaths were 11 103 and 3408, respectively, and our simulations resulted in 11 049 total cases and 3394 deaths. Finally, on 17 April 2015, the reported total cases and deaths were 12 244 and 3865, respectively; our simulations resulted in 12 299 total cases and 3919 deaths.
Figure 1.
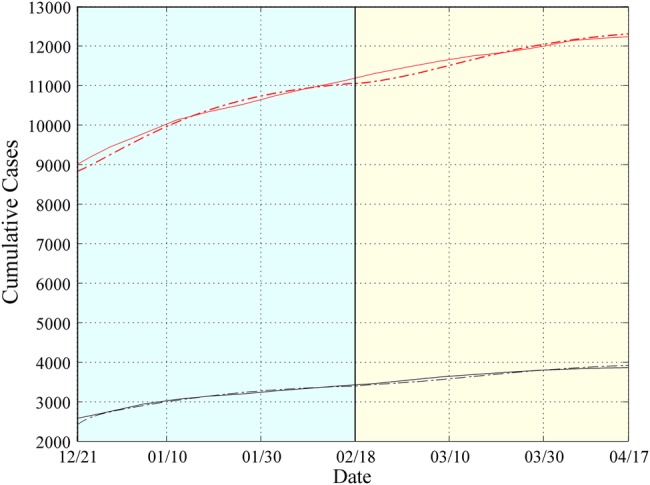
Simulation Results for Sierra Leone from 21 December 2014 to 17 April 2015. Expected cumulative cases of infected (dotted red) and dead (dotted black). WHO data are depicted by solid lines. The period under study has been tessellated into two windows with a length of 60 days each. For each window, the model parameters are estimated based on the data reported from the WHO.
The epidemiological parameters that were obtained through the optimisation approach are illustrated in figure 2 and a summary of the estimated epidemic parameters for the period under study, together with their 95% CIs, is presented in table 1. Panel (A) depicts the evolution of the estimated network characteristics,  and
and  , while panels (B–E) illustrate the model parameters
  ,
, ,
, and
and  , that fit best to the reported EVD epidemic dynamics in the country. The evolution of the estimated
  in Sierra Leone is shown in panel (F).
Figure 2.

Estimated model parameters for Sierra Leone from 21 December 2014 to 17 April 2015. (A) Evolution of contact network characteristics: switching probability ( ) and density ratio of the transmission network (
 ). (B) Percontact transmission probability (
 ). (C) 1/{recovery period} (
 ). (D) 1/{period from onset of symptoms to death} (
 ). (E) Case fatality rate (
 ). (F) Effective reproductive number (
 ). The 95% CIs are also shown.
Table 1.
Key epidemiological features of the EVD epidemic in Sierra Leone estimated by the model during the first and second study period (21 December 2014 to 17 April 2015)
| Period | Variable | Mean | 95% CI |
|---|---|---|---|
| First (21 December–18 February 2015) |  |
0.37 | 0.33 to 0.41 |
| Network density (α) | 0.55 | 0.51 to 0.58 | |
| Time to death (days) | 3.6 | 3.3 to 4.0 | |
| Time to recovery (days) | 9.5 | 8.6 to 10.7 | |
| CFR (%) | 32 | 31 to 33 | |
 |
0.77 | 0.72 to 0.82 | |
| Second (18 February–17 April 2015) |  |
0.22 | 0.20 to 0.24 |
| Network density (α) | 0.63 | 0.59 to 0.68 | |
| Time to death (days) | 3.6 | 3.3 to 4.0 | |
| Time to recovery (days) | 8.0 | 6.5 to 10.5 | |
| CFR (%) | 39 | 38 to 40 | |
 |
1.98 | 1.33 to 2.22 |
CFR, case fatality rate ( ); EVD, Ebola virus disease;
  , effective reproductive number;
  , rewiring switching probability.
More specifically, the contact network of Sierra Leone exhibits a rather random structure with a rewiring switching probability ( ) of ∼0.37 (95% CI ∼0.33 to 0.41), which falls to ∼0.22 (95% CI 0.20 to 0.24) during the study period (figure 2A). A slight increase is shown in the density ratio of the network as represented by
  , which was ∼0.54 (95% CI ∼0.51 to 0.58) during the first period (21 December 2014 to 18 February 2015) and ∼0.63 (95% CI 0.59 to 0.68) during the second period of the study (18 February–17 April 2015) (figure 2A). The differences of the network characteristics between the two periods indicate a more clustered, yet denser contact network during the second period, which could partially reflect a relaxation of awareness in the first period, when the epidemic seemed to decline. The percontact transmission probability
  values were estimated at ∼0.03 (95% CI 0.028 to 0.033) in the first period and ∼0.08 (95% CI 0.067 to 0.09) in the second period (figure 2B). The expected period from the onset of symptoms to recovery (ie, the inverse of
  ) was ∼9.5 days (95% CI 8.6 to 10.7 days) during the first period and ∼8 days (95% CI 6.5 to 10.5 days) during the second period of study (figure 2C). The expected time interval from the onset of symptoms to death (ie, the inverse of
  ) was constant at ∼3.6 days (95% CI 3.3 to 4.0 days) during the period of study (figure 2D). The CFR (
 ), which was estimated to be ∼32% (95% CI 31% to 33%) for the period extending from late December 2014 to 18 February 2015, increased to ∼39% (95% CI 38% to 40%) from 18 February to 17 April (figure 2E). Finally, the
  , as computed using the agent-based simulator, was ∼0.77 (95% CI 0.72 to 0.82) from 21 December 2014 to 18 February 2015, rising up to ∼1.98 (95% 1.33 to 2.22) from 18 February to 17 April 2015 (figure 2F).
Regarding the epidemic parameters, our estimates are quite close to those reported by the WHO Ebola Response Team and other groups. For example, Ansumana et al20 reported a 31% CFR at Hastings centre, while the National Institute of Communicable diseases (NICD) reported a CFR of 32% for Sierra Leone on 5 April 2015;21 a mean of 31.6% CFR was reported for Sierra Leone from the WHO Ebola response team as of 14 September 2014.10 Gomes et al22 reported an ∼8-day period from the onset of symptoms to recovery, while in a recent study by the WHO Ebola response team,23 a period of 10.6 days (with a SD of 8.2 days) was reported from symptoms onset to hospital discharge for individuals older than 45 years. In the same paper, a period of ∼6 days (with equal SD) was reported from symptoms onset to death for the same age group. The same delay period from symptoms onset to death was also reported by Ansumana et al.20
Simulations showed that the expected cumulative number of infected cases could reach as high as 13 400 by 17 June, while the cumulative number of dead could exceed 4300, if no further action was undertaken. Hence, we decided to perform an assessment of the impact of potential control strategies. Based on the recently announced isolation policy,24 we simulated the influence on the epidemic dynamics of sparser, with respect to the estimated network density of the second period—network densities—by 10%, 20%, 30%, 40% and 50%. We tested these scenarios by analogously reducing the expected density of the contact network as estimated during the second period and running the agent-based simulation from 18 April until 17 June 2015, keeping all other values of the model parameters fixed.
The results of the exploration of these different scenarios are summarised in table 2 and portrayed graphically in figure 3. The “no further action” case, with respect to the estimated current network structure is also depicted in figure 3 for comparison. By applying a 10% reduction in the network density (yielding an  of ∼0.57), the expected reproductive number
 was estimated to be ∼1.7. Accordingly, for a 20% reduction in the network density (yielding an
  of ∼0.51),
  was estimated to be ∼1.51. Reductions of 30%, 40% and 50% yielding network densities of ∼0.44, ∼0.38 and ∼0.32, respectively, resulted in corresponding
  values of ∼1.42, ∼1.23 and ∼1.05 (table 2). As shown, even large reductions in the density of the network will not lower the
  below unity soon.
Table 2.
Outcomes of isolation control policy scenarios on the basis of the expected reproductive number Re, as computed by running the agent-based simulation from 17 April to the mid-June 2015 (keeping all other values of the model parameters fixed). Sparser density refers to a per cent reduction of the expected density of the contact network compared with the 0.63 value that was estimated for the second period (18 February–17 April 2015)
| Period | Percentage of Sparser density | Network density (α) | Re |
|---|---|---|---|
| (18 April–17 June 2015) | 10 | ∼0.57 | ∼1.7 |
| 20 | ∼0.51 | ∼1.5 | |
| 30 | ∼0.44 | ∼1.4 | |
| 40 | ∼0.38 | ∼1.2 | |
| 50 | ∼0.32 | ∼1.0 |
Figure 3.

Forecasting of the evolution of the epidemic from 18 April to 17 June 2015 under different control scenarios. Network density values were compared with the density of the social network estimated for the period 18 February–17 April 2015. (A) Total cases and (B) deaths. The ‘no further action’ scenario is also depicted.
A study by Khan et al,25 which obtained robust estimates for the basic reproductive ratio R0 in Liberia and Sierra Leone, showed that effective isolation is required to bring the value of R0 to <1, and hence control the outbreak. Khan et al25 suggested that the contact rate in isolation should be less than one quarter of that for the infected non-isolated population, and that the fraction of high-risk individuals should be brought to <10% of the overall susceptible population, to halt the epidemic.
In reality, the reduction in the network density could potentially reflect analogous reductions in social interactions further to the current restrictions of community mobilisation. Examples would include raising public awareness and/or strengthening medical care. The country’s National Ebola Response Centre has already announced a 3-day lockdown that will affect around 2.5 million people.20 Nevertheless, it is worth noticing that even with a 30% reduction in the social network density, the epidemic showed no signs of fading out until 17 June and we estimated that new cases would continue to be recorded.
In conclusion, we found that the EVD epidemic in Sierra Leone was in recession in the period from 21 December 2014 through mid-February 2015, as reflected by the <1 value of the reproductive number for this period. However, during the second study period (ie, from 18 February to 17 April 2015), the epidemic had spiked and the reproductive number was estimated to be well above criticality, with the potential to persist at this level beyond the end of June and through July. Control measures associated with mobilisation restrictions were also evaluated. Our findings, supported by real epidemiological data and the projection of a spilling over of the epidemic to mid-June, indicated that the measures implemented to date were inadequate. Taken in their totality, these findings indicated that the epidemic, even with strict control isolation policies in effect, would go on through July with a probability of fading out thereafter if policies were implemented and consistently kept in place. Immediate, more intense efforts are needed before further complications emerge. Reducing the effective density of the derived contact small-world-like network, through limited social interactions, has the potential to improve the current situation. Our results and predictions were verified from the official data reported by CDC for the corresponding period of study. Hence, our approach seems promising to forecast re-emergent outbreaks in other vulnerable regions of Africa, such as Eastern and Central Africa, where Ebola outbreaks have traditionally occurred in the past. Estimations through clinical studies of important factors such as the contact transmission probability, mortality and recovery rate, and incubation periods, as well as detailed age-specific data as the epidemic develops in space and time, would enhance our ability to better model, forecast and design efficient control policies.
However, the usefulness of mathematical models should not be overestimated. Despite the significant technological progress and concentrated wealth, breakdowns and cuts in public health infrastructures worldwide are the major reasons for these increasing epidemics. Liberia and Sierra Leone, the two countries worst affected by the Ebola epidemic, had an almost non-existent healthcare system: as reported, Liberia with a population of >4 million people had just 51 physicians and Sierra Leone with a population exceeding 6 million had just 136 physicians.26
Update to the case of Sierra Leone (period 18 April–15 August 2015)
Since the results we obtained by analysing the reported data until 17 April 2015 showed that the epidemic was sustained in Sierra Leone, we decided to further investigate the current trends of the epidemic dynamics. Therefore, we expanded our analysis by taking into account the reported data for the country for the very last period (18 April–15 August 2015). The results of this expanded analysis indicate a declining trend in the transmission potential of the virus, as shown in table 3. More specifically, ( ) rose significantly in the period 18 April–16 June 2015 to ∼0.69 (95% CI ∼0.67 to 0.72), with a further slight increase in the very last period (17 June–15 August 2015) to ∼0.75 (95% CI 0.69 to 0.80). Τhe density ratio of the network, as represented by
  , did not show significant changes: in the period 18 April–16 June 2015, it was found to be ∼0.47 (95% CI ∼0.42 to 0.51) and ∼0.46 (95% CI 0.37 to 0.53) during the period 17 June–15 August 2015. The CFR (
 ) dropped to ∼10% (95% CI 8% to 12%) for both last periods. The expected period from the onset of symptoms to recovery (ie, the inverse of
 ) was ∼20 days (95% CI 16 to 30 days) during the period 18 April–16 June 2015 and ∼16 days (95% CI 8 to 32 days) for the period 17 June–15 August 2015. The expected period from the onset of symptoms to death (ie, the inverse of
  ) was almost constant at ∼3 days (95% CI 2.8 to 3.2 days) for both last periods. The percontact transmission probability
  values were estimated at ∼0.023 (95% CI 0.02 to 0.026) in the period 18 April–16 June and ∼0.015 (95% CI 0.01 to 0.21) in the period 17 June–15 August 2015. Finally, the Re obtained through the agent-based simulations dropped to ∼1.38 (95% CI 0.95 to 1.72) in the period 18 April–16 June and ∼ 0.68 (95% CI 0.47 to 1.01) from 17 June to 15 August 2015, thus indicating a saturation of the epidemic.
Table 3.
Up-to-date key epidemiological features of the EVD epidemic in Sierra Leone estimated by the model during the period (18 June–15 August 2015)
| Period | Variable | Mean | 95% CI |
|---|---|---|---|
| (18 June–16 July 2015) |  |
0.69 | 0.67 to 0.72 |
| Network density (α) | 0.47 | 0.42 to 0.51 | |
| Time to death (days) | 3.0 | 2.8 to 3.2 | |
| Time to recovery (days) | 20 | 16 to 30 | |
| CFR (%) | 10 | 8 to 12 | |
 |
1.38 | 0.95 to 1.72 | |
| (16 July–15 August 2015) |  |
0.75 | 0.69 to 0.80 |
| Network density (α) | 0.46 | 0.37 to 0.53 | |
| Time to death (days) | 3.0 | 2.8 to 3.2 | |
| Time to recovery (days) | 16 | 8 to 32 | |
| CFR (%) | 10 | 8 to 12 | |
 |
0.68 | 0.47 to 1.01 |
CFR, case fatality rate ( ); EVD, Ebola virus disease;
 , effective reproductive number;
  , rewiring switching probability.
Our analysis succeeded in approximating the actual data for total cases and deaths.3 For example, on 16 June 2015, the number of total cases, as reported by the CDC, was 12 990 and the number of deaths was 3922, while our simulations resulted in 12 963 cases and ∼3940 deaths. On 14 August 2015, the total cases and deaths were 13 485 and 3952, respectively, and our simulations resulted in 13 437 total cases and 3993 deaths.
Footnotes
Contributors: CIS, LR and CG contributed to the development of the model. CIS and CA contributed to the data collection, interpretation of the data and drafting of the manuscript. EM contributed to the interpretation of the data and substantially revised the manuscript. All the authors approved the final manuscript and accepted accountability for all aspects of the work.
Funding: This research received no specific grant from any funding agency in the public, commercial or not-for-profit sectors.
Competing interests: None declared.
Provenance and peer review: Not commissioned; externally peer reviewed.
Data sharing statement: No additional data are available.
References
- 1.Baize S, Pannetier D, Oestereich L et al. Emergence of Zaire Ebola virus disease in Guinea. N Engl J Med 2014;371:1418–25. 10.1056/NEJMoa1404505 [DOI] [PubMed] [Google Scholar]
- 2.[No authors listed]. Ebola virus disease (EVD) in West Africa: an extraordinary epidemic. Wkly Epidemiol Rec 2015;90:89–96. http://www.who.int/wer/2015/wer9010/en/ [PubMed] [Google Scholar]
- 3.2014 Ebola Outbreak in West Africa. Centers for Disease Control and Prevention. http://www.cdc.gov/vhf/ebola/outbreaks/2014-west-africa/ (accessed 24 Apr 2015).
- 4.Koroma EB. Address to the Nation on the Ebola crisis. 22 Jan 2015. http://www.sierra-leone.org/Speeches/koroma-012215.html (accessed 24 Mar 2015). [Google Scholar]
- 5.Tracking Ebola in the fishing community of Aberdeen in Freetown, Sierra Leone. Mar 2015. http://www.who.int/features/2015/ebola-aberdeen/en/ (accessed 24 Mar 2015).
- 6.Siettos C, Anastassopoulou C, Russo L et al. Modeling the 2014 Ebola virus epidemic—agent-based simulations, temporal analysis and future predictions for Liberia and Sierra Leone. PLoS Curr 2015;7 doi: 10.1371/currents.outbreaks.8d5984114855fc425e699e1a18cdc6c9 10.1371/currents.outbreaks.8d5984114855fc425e699e1a18cdc6c9 [DOI] [PMC free article] [PubMed] [Google Scholar]
- 7.Kevrekidis IG, Gear CW, Hyman JM et al. Equation-free, coarse-grained multiscale computation: enabling microscopic simulators to perform system-level analysis. Commun Math Sci 2003;1:715–62. 10.4310/CMS.2003.v1.n4.a5 [DOI] [Google Scholar]
- 8.Watts DJ, Strogatz SH. Collective dynamics of ‘small-world’ networks. Nature 1998;393:440–2. 10.1038/30918 [DOI] [PubMed] [Google Scholar]
- 9.Newman ME, Watts DJ. Scaling and percolation in the small-world network model. Phys Rev E Stat Phys Plasmas Fluids Relat Interdiscip Topics 1999;60:7332–42. [DOI] [PubMed] [Google Scholar]
- 10.Aylwar B, Barboza P, Bawo L et al. , WHO Ebola Response Team. Ebola virus disease in West Africa—the first 9 months of the epidemic and forward projections. N Engl J Med 2014;371:1481–95. 10.1056/NEJMoa1411100 [DOI] [PMC free article] [PubMed] [Google Scholar]
- 11.Sierra Leone. United Nations Statistics Division. https://data.un.org/CountryProfile.aspx?crName=SIERRA%20LEONE (accessed 24 Mar 2015).
- 12.Ebola Situation Reports. World Health Organization. http://apps.who.int/ebola/ebola-situation-reports.
- 13.Coleman TF, Li Y. An interior trust region approach for nonlinear minimization subject to bounds. SIAM J Optim 1996;6:418–45. 10.1137/0806023 [DOI] [Google Scholar]
- 14.Makeev AG, Maroudas D, Kevrekidis IG. “Coarse” stability and bifurcation analysis using stochastic simulators: Kinetic Monte Carlo examples. J Chem Phys 2002;116:10083–91. 10.1063/1.1476929 [DOI] [Google Scholar]
- 15.Gear CW, Kevrekidis IG, Theodoropoulos C. “Coarse” integration/bifurcation analysis via microscopic simulators: micro-Galerkin methods. Comput Chem Eng 2002;26:941–63. 10.1016/S0098-1354(02)00020-0 [DOI] [Google Scholar]
- 16.Theodoropoulos C, Qian YH, Kevrekidis IG. “Coarse” stability and bifurcation analysis using time-steppers: a reaction-diffusion example. Proc Natl Acad Sci USA 2000;97:9840–3. 10.1073/pnas.97.18.9840 [DOI] [PMC free article] [PubMed] [Google Scholar]
- 17.Siettos CI, Graham MD, Kevrekidis IG. Coarse Brownian dynamics for nematic liquid crystals: bifurcation, projective integration, and control via stochastic simulation. J Chem Phys 2003;118:10149–56. 10.1063/1.1572456 [DOI] [Google Scholar]
- 18.Kevrekidis IG, Gear CW, Hummer G. Equation-free: the computer-aided analysis of complex multiscale systems. AIChE J 2004;50:1346–55. 10.1002/aic.10106 [DOI] [Google Scholar]
- 19.MATLAB. The MathWorks Inc. http://www.mathworks.com/
- 20.Ansumana R, Jacobsen KH, Idris M et al. Ebola in Freetown area, Sierra Leone—a case study of 581 patients. N Engl J Med 2015;372:587–8. 10.1056/NEJMc1413685 [DOI] [PubMed] [Google Scholar]
- 21. http://www.nicd.ac.za/?page=alerts&id=5&rid=531. [Google Scholar]
- 22.Gomes MF, Pastore Y, Piontti A et al. Assessing the international spreading risk associated with the 2014 West African Ebola outbreak. PLoS Curr 2014;6 doi:10.1371/currents.outbreaks.cd818f63d40e24aef769dda7df9e0da5 10.1371/currents.outbreaks.cd818f63d40e24aef769dda7df9e0da5 [DOI] [PMC free article] [PubMed] [Google Scholar]
- 23.Agua-Agum J, Ariyarajah A, Blake IM et al. , WHO Ebola Response Team. Ebola virus disease among children in West Africa. N Engl J Med 2015;372:1274–7. 10.1056/NEJMc1415318 [DOI] [PMC free article] [PubMed] [Google Scholar]
- 24.Ebola crisis: Sierra Leone lockdown to hit 2.5 m people. BBC News. 19 Mar 2015. http://www.bbc.com/news/world-africa-31966989 (accessed 24 Mar 2015).
- 25.Khan A, Naveed M, Dur-e-Ahmad M et al. Estimating the basic reproductive ratio for the Ebola outbreak in Liberia and Sierra Leone. Infect Dis Poverty 2015;4:13 10.1186/s40249-015-0043-3 [DOI] [PMC free article] [PubMed] [Google Scholar]
- 26. http://www.bbc.com/news/world-africa-29324595.