

Abstract
Reduced glomerular filtration rate defines chronic kidney disease and is associated with cardiovascular and all-cause mortality. We conducted a meta-analysis of genome-wide association studies for estimated glomerular filtration rate (eGFR), combining data across 133,413 individuals with replication in up to 42,166 individuals. We identify 24 new and confirm 29 previously identified loci. Of these 53 loci, 19 associate with eGFR among individuals with diabetes. Using bioinformatics, we show that identified genes at eGFR loci are enriched for expression in kidney tissues and in pathways relevant for kidney development and transmembrane transporter activity, kidney structure, and regulation of glucose metabolism. Chromatin state mapping and DNase I hypersensitivity analyses across adult tissues demonstrate preferential mapping of associated variants to regulatory regions in kidney but not extra-renal tissues. These findings suggest that genetic determinants of eGFR are mediated largely through direct effects within the kidney and highlight important cell types and biological pathways.
 Reduced glomerular filtration rate (eGFR) is a hallmark of chronic kidney disease. Here, Pattaro et al. conduct a meta-analysis to discover several new loci associated with variation in eGFR and find that genes associated with eGFR loci often encode proteins potentially related to kidney development.
Chronic kidney disease (CKD) is a global public health problem1,2,3, and is associated with an increased risk for cardiovascular disease, all-cause mortality and end-stage renal disease4,5. Few new therapies have been developed to prevent or treat CKD over the past two decades1,6, underscoring the need to identify and understand the underlying mechanisms of CKD.
Prior genome-wide association studies (GWAS) have identified multiple genetic loci associated with CKD and estimated glomerular filtration rate (eGFR), a measure of the kidney's filtration ability that is used to diagnose and stage CKD7,8,9,10,11,12,13,14,15. Subsequent functional investigations point towards clinically relevant novel mechanisms in CKD that were derived from initial GWAS findings16, providing proof of principle that locus discovery through large-scale GWAS efforts can translate to new insights into CKD pathogenesis.
To identify additional genetic variants associated with eGFR and guide future experimental studies of CKD-related mechanisms, we have now performed GWAS meta-analyses in up to 133,413 individuals, more than double the sample size of previous studies. Here we describe multiple novel genomic loci associated with kidney function traits and provide extensive locus characterization and bioinformatics analyses, further delineating the physiologic basis of kidney function.
Results
Stage 1 discovery analysis
We analysed associations of eGFR based on serum creatinine (eGFRcrea), cystatin C (eGFRcys, an additional, complementary biomarker of renal function) and CKD (defined as eGFRcrea <60 ml min−1 per 1.73 m2) with ∼2.5 million autosomal single-nucleotide polymorphisms (SNPs) in up to 133,413 individuals of European ancestry from 49 predominantly population-based studies (Supplementary Table 1). Results from discovery GWAS meta-analysis are publicly available at http://fox.nhlbi.nih.gov/CKDGen/. We performed analyses in each study sample in the overall population and stratified by diabetes status, since genetic susceptibility to CKD may differ in the presence of this strong clinical CKD risk factor. Population stratification did not impact our results as evidenced by low genomic inflation factors in our meta-analyses, which ranged from 1.00 to 1.04 across all our analyses (Supplementary Fig. 1).
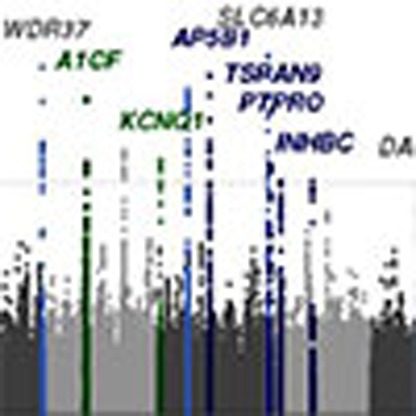
In addition to confirming 29 previously identified loci7,8,9 (Fig. 1a; Supplementary Table 2), we identified 48 independent novel loci (Supplementary Table 3) where the index SNP, defined as the variant with the lowest P value in the region, had an association P value <1.0 × 10⁻⁶. Of these 48 novel SNPs, 21 were genome-wide significant with P values <5.0 × 10⁻⁸. Overall, 43 SNPs were identified in association with eGFRcrea (nine in the non-diabetes sample), one with eGFRcys and four with CKD, as reported in Supplementary Table 3. Manhattan plots for CKD, eGFRcys and eGFRcrea in diabetes are shown in Fig. 1b,c and Supplementary Fig. 2, respectively.
Figure 1. Discovery stage genome-wide association analysis.

Manhattan plots for eGFRcrea, CKD and eGFRcys. Previously reported loci are highlighted in light blue (grey labels). (a) Novel loci uncovered for eGFRcrea in the overall and in the non-diabetes groups are highlighted in blue and green, respectively. (b) Results from CKD analysis with highlighted known and novel loci for eGFRcrea. (c) Results from eGFRcys with highlighted known and novel loci for eGFRcrea and known eGFRcys loci.
Stage-2 replication
Novel loci were tested for replication in up to 42,166 additional European ancestry individuals from 15 studies (Supplementary Table 1). Of the 48 novel candidate SNPs submitted to replication, 24 SNPs demonstrated a genome-wide significant combined stage 1 and 2 P value <5.0 × 10⁻⁸ (Table 1). Of these, 23 fulfilled additional replication criteria (q-value <0.05 in stage 2). Only rs6795744 at the WNT7A locus demonstrated suggestive replication (P value <5.0 × 10⁻⁸, q-value >0.05). Because serum creatinine is used to estimate eGFRcrea, associated genetic loci may be relevant to creatinine production or metabolism rather than kidney function per se. For this reason, we contrasted associations of eGFRcrea versus eGFRcys, the latter estimated from an alternative and creatinine-independent biomarker of GFR (Supplementary Fig. 3; Supplementary Table 4). The majority of loci (22/24) demonstrated consistent effect directions of their association with both eGFRcrea and eGFRcys.
Table 1. The 24 novel SNPs associated with eGFRcrea in European ancestry individuals.
| SNP ID* | Chr. | Position (bp)† | Locus name‡ | Effect/Non effect allele (EAF) | SNP function§ | Stage 1 (discovery)|| | Stage 2 (replication) | Combined analysis¶ | ||||
|---|---|---|---|---|---|---|---|---|---|---|---|---|
| Beta | P value | Beta | q-value | Beta | P value# | I2 %** | ||||||
| The eight loci whose smallest P value was observed in the ‘no diabetes' group | ||||||||||||
| rs3850625 | 1 | 201,016,296 | CACNA1S | A/G (0.12) | Exonic, nonsyn. SNV | 0.0080 | 2.55E−09 | 0.0071 | 5.46E−03 | 0.0083 | 6.82E−11 | 0 |
| rs2712184 | 2 | 217,682,779 | IGFBP5 | A/C (0.58) | Intergenic | −0.0049 | 1.65E−08 | −0.0055 | 2.06E−03 | −0.0053 | 1.33E−10 | 0 |
| rs9682041 | 3 | 170,091,902 | SKIL | T/C (0.87) | Intronic | −0.0067 | 1.36E−07 | −0.0046 | 2.33E−02 | −0.0068 | 2.58E−08 | 2 |
| rs10513801 | 3 | 185,822,353 | ETV5 | T/G (0.87) | Intronic | 0.0070 | 3.80E−09 | 0.0046 | 1.79E−02 | 0.0072 | 1.03E−09 | 0 |
| rs10994860 | 10 | 52,645,424 | A1CF | T/C (0.19) | UTR5 | 0.0075 | 1.00E−11 | 0.0061 | 5.46E−03 | 0.0077 | 1.07E−12 | 2 |
| rs163160 | 11 | 2,789,955 | KCNQ1 | A/G (0.82) | Intronic | 0.0067 | 9.02E−09 | 0.0050 | 9.89E−03 | 0.0065 | 2.26E−09 | 14 |
| rs164748 | 16 | 89,708,292 | DPEP1 | C/G (0.53) | Intergenic | 0.0047 | 9.92E−09 | 0.0019 | 4.19E−02 | 0.0046 | 1.95E−08 | 17 |
| rs8091180 | 18 | 77,164,243 | NFATC1 | A/G (0.56) | Intronic | −0.0054 | 1.43E−08 | −0.0052 | 5.46E−03 | −0.0060 | 1.28E−09 | 0 |
| The 16 loci whose smallest P value was observed in the ‘overall' group | ||||||||||||
| rs12136063 | 1 | 110,014,170 | SYPL2 | A/G (0.70) | Intronic | 0.0049 | 2.33E−07 | 0.0028 | 2.31E−02 | 0.0045 | 4.71E−08 | 0 |
| rs2802729 | 1 | 243,501,763 | SDCCAG8 | A/C (0.43) | Intronic | −0.0050 | 7.37E−08 | −0.0029 | 2.05E−02 | −0.0046 | 2.20E−08 | 9 |
| rs4667594 | 2 | 170,008,506 | LRP2 | A/T (0.53) | Intronic | −0.0045 | 2.37E−07 | −0.0043 | 5.62E−03 | −0.0044 | 3.52E−08 | 4 |
| rs6795744‡‡ | 3 | 13,906,850 | WNT7A | A/G (0.15) | Intronic | 0.0071 | 9.60E−09 | 0.0019 | 5.15E−02 | 0.0060 | 3.33E−08 | 18 |
| rs228611 | 4 | 103,561,709 | NFKB1 | A/G (0.47) | Intronic | −0.0055 | 4.66E−10 | −0.0060 | 8.91E−04 | −0.0056 | 3.58E−12 | 3 |
| rs7759001 | 6 | 27,341,409 | ZNF204 | A/G (0.76) | ncRNA intronic | −0.0053 | 2.64E−07 | −0.0045 | 9.10E−03 | −0.0051 | 1.75E−08 | 0 |
| rs10277115 | 7 | 1,285,195 | UNCX | A/T (0.23) | Intergenic | 0.0095 | 1.05E−10 | 0.0079 | 9.03E−04 | 0.0090 | 8.72E−14 | 0 |
| rs3750082 | 7 | 32,919,927 | KBTBD2 | A/T (0.33) | Intronic | 0.0049 | 2.52E−07 | 0.0031 | 1.96E−02 | 0.0045 | 3.22E−08 | 2 |
| rs6459680 | 7 | 156,258,568 | RNF32 | T/G (0.74) | Intergenic | −0.0065 | 1.96E−10 | −0.0019 | 4.62E−02 | −0.0055 | 1.07E−09 | 0 |
| rs4014195 | 11 | 65,506,822 | AP5B1 | C/G (0.64) | Intergenic | 0.0061 | 2.19E−11 | 0.0034 | 1.42E−02 | 0.0055 | 1.10E−11 | 0 |
| rs10491967 | 12 | 3,368,093 | TSPAN9 | A/G (0.10) | Intronic | −0.0092 | 3.03E−10 | −0.0106 | 3.93E−04 | −0.0095 | 5.18E−14 | 0 |
| rs7956634 | 12 | 15,321,194 | PTPRO | T/C (0.81) | Intronic | −0.0068 | 2.46E−09 | −0.0069 | 1.51E−03 | −0.0068 | 7.17E−12 | 0 |
| rs1106766 | 12 | 57,809,456 | INHBC | T/C (0.22) | Intergenic | 0.0062 | 4.67E−08 | 0.0058 | 8.79E−03 | 0.0061 | 2.41E−09 | 9 |
| rs11666497 | 19 | 38,464,262 | SIPA1L3 | T/C (0.18) | Intronic | −0.0064 | 8.58E−08 | −0.0041 | 1.53E−02 | −0.0058 | 4.25E−08 | 24 |
| rs6088580 | 20 | 33,285,053 | TP53INP2 | C/G (0.47) | Intergenic | −0.0055 | 7.17E−10 | −0.0027 | 2.31E−02 | −0.0049 | 1.79E−09 | 0 |
| rs17216707 | 20 | 52,732,362 | BCAS1 | T/C (0.79) | Intergenic | −0.0084 | 5.96E−13 | −0.0051 | 6.69E−03 | −0.0077 | 8.83E−15 | 1 |
bp, basepairs; Chr, chromosome; EAF, effect allele frequency; eGFRcrea, eGFR based on serum creatinine; GWAS, genome-wide association studies; SNP, single-nucleotide polymorphism; UTR, untranslated region.
*SNPs are grouped by the stratum where the smallest P value in the discovery and combined analysis was observed. In the ‘no diabetes' group, sample size/number of studies were equal to 118,448/45, 36,433/13 and 154,881/58, in the discovery, replication and combined analyses, respectively. In the ‘overall' group, the numbers for the three analyses were equal to 133,413/48, 42,116/14 and 175,579/62, respectively.
†On the basis of RefSeq genes (build 37).
‡Conventional locus name based on relevant genes in the region as identified by bioinformatic investigation (Supplementary Table 12) or closest gene. A complete overview of the genes in each locus is given in the regional association plots (Supplementary Fig. 4).
§SNP function is derived from NCBI RefSeq genes and may not correspond to the named gene.
||Twice genomic-control (GC) corrected P value from discovery GWAS meta-analysis: at the individual study level and after the meta-analysis.
¶For random-effect estimate, see Supplementary Table 4.
#P value of the meta-analysis of the twice GC-corrected discovery meta-analysis results and replication studies.
**Between-study heterogeneity, as assessed by the I2. Q statistic P value >0.05 for all SNPs, except rs11666497 (SIPA1L3, P value=0.04).
‡‡For this SNP, the conditions for replication were not all met (q-value >0.05 in the replication stage).
Association plots of the 24 newly identified genomic regions that contain a replicated or suggestive index SNP appear in Supplementary Fig. 4. The odds ratio for CKD for each of the novel loci ranged from 0.93 to 1.06 (Supplementary Table 4). As evidenced by the relatively small effect sizes, the proportion of phenotypic variance of eGFRcrea explained by all new and known loci was 3.22%: 0.81% for the newly uncovered loci and 2.41% for the already known loci.
Associations stratified by diabetes and hypertension status
The effects of the 53 known and novel loci in individuals with (stage 1+stage 2 n=16,477) and without (stage 1+stage 2 n=154,881) diabetes were highly correlated (correlation coefficient: 0.80; 95% confidence interval: 0.67, 0.88; Supplementary Fig. 5) and of similar magnitude (Fig. 2; Supplementary Table 5), suggesting that identification of genetic loci in the overall population may also provide insights into loci with potential importance among individuals with diabetes. The previously identified UMOD locus showed genome-wide significant association with eGFRcrea among those with diabetes (Supplementary Fig. 2; rs12917707, P value=2.5 × 10⁻⁸), and six loci (NFKB1, UNCX, TSPAN9, AP5B1, SIPA1L3 and PTPRO) had nominally significant associations with eGFRcrea among those with diabetes. Of the previously identified loci, 13 demonstrated nominal associations among those with diabetes, for a total of 19 loci associated with eGFRcrea in diabetes.
Figure 2. Association eGFRcrea loci in subjects with and without diabetes.

Novel (a) and known (b) loci were considered. Displayed are effects and their 95% confidence intervals on ln(eGFRcrea). Results are sorted by increasing effects in the diabetes group. The majority of loci demonstrated similar effect sizes in the diabetes as compared with non-diabetes strata. SNP-specific information and detailed sample sizes are reported in Supplementary Table 5.
Exploratory comparison of the association effect sizes in subjects with and without hypertension based on our previous work7 showed that novel and known loci are also similarly associated with eGFRcrea among individuals with and without hypertension (Supplementary Fig. 6).
Tests for SNP associations with related phenotypes
We tested for overlap with traits that are known to be associated with kidney function in the epidemiologic literature by investigating SNP associations with systolic and diastolic blood pressure17, myocardial infarction18, left ventricular mass19, heart failure20, fasting glucose21 and urinary albumin excretion (CKDGen Consortium, personal communication). We observed little association of the 24 novel SNPs with other kidney function-related traits, with only 2 out of 165 tests reaching the Bonferroni significance level of 0.0003 (see Methods and Supplementary Table 6).
To investigate whether additional traits are associated with the 24 new eGFR loci, we queried the NHGRI GWAS catalog (www.genome.gov). Overall, nine loci were previously identified in association with other traits at a P value of 5.0 × 10⁻⁸ or lower (Supplementary Table 7), including body mass index (ETV5) and serum urate (INHBC, A1CF and AP5B1).
Trans-ethnic analyses
To assess the generalizability of our findings across ethnicities, we evaluated the association of the 24 newly identified loci with eGFRcrea in 16,840 participants of 12 African ancestry population studies (Supplementary Table 8) and in up to 42,296 Asians from the AGEN consortium11 (Supplementary Table 9). Seven SNPs achieved nominal direction-consistent significance (P<0.05) in AGEN, and one SNP was significant in the African ancestry meta-analysis (Supplementary Table 9). Random-effect meta-analysis showed that 12 loci (SDCCAG8, LRP2, IGFBP5, SKIL, UNCX, KBTBD2, A1CF, KCNQ1, AP5B1, PTPRO, TP53INP2 and BCAS1) had fully consistent effect direction across the three ethnic groups (Supplementary Fig. 7), suggesting that our findings can likely be generalized beyond the European ancestry group.
To identify additional potentially associated variants and more formally evaluate trans-ethnic heterogeneity of the loci identified through meta-analysis in European ancestry populations, we performed a trans-ethnic meta-analysis22, combining the 12 African ancestry studies with the 48 European Ancestry studies used in the discovery analysis of eGFRcrea. Of the 24 new loci uncovered for eGFRcrea, 15 were also genome-wide significant in the trans-ethnic meta-analysis (defined as log10 Bayes Factor >6, Supplementary Table 10), indicating that for most of these loci, there is little to no allelic effect heterogeneity across the two ethnic groups. No additional loci were significantly associated with log10 Bayes Factor >6.
Bioinformatic and functional characterization of new loci
We used several techniques to prioritize and characterize genes underlying the identified associations, uncover connections between associated regions, detect relevant tissues and assign functional annotations to associated variants. These included expression quantitative trait loci (eQTL) analyses, pathway analyses, DNAse I hypersensitivity site (DHS) mapping, chromatin mapping, manual curation of genes in each region and zebrafish knockdown.
eQTL analysis
We performed eQTL analysis using publically available eQTL databases (see Methods). These analyses connected novel SNPs to transcript abundance of SYPL2, SDCCAG8, MANBA, KBTBD2, PTPRO and SPATA33 (C16orf55), thereby supporting these as potential candidate genes in the respective associated regions (Supplementary Table 11).
Pathway analyses
We used a novel method, Data-driven Expression Prioritized Integration for Complex Traits (DEPICT)23, to prioritize genes at associated loci, to test whether genes at associated loci are highly expressed in specific tissues or cell types and to test whether specific biological pathways and gene sets are enriched for genes in associated loci. On the basis of all SNPs with eGFRcrea association P values <10−5 in the discovery meta-analysis, representing 124 independent regions, we identified at least one significantly prioritized gene in 49 regions, including in 9 of the 24 novel genome-wide significant regions (Supplementary Table 12). Five tissue and cell type annotations were enriched for expression of genes from the associated regions, including the kidney and urinary tract, as well as hepatocytes and adrenal glands and cortex (Fig. 3a; Supplementary Table 13). Nineteen reconstituted gene sets showed enrichment of genes mapping into the associated regions at a permutation P value <10−5 (Supplementary Table 14; Fig. 4), highlighting processes related to renal development, kidney transmembrane transporter activity, kidney and urogenital system morphology, regulation of glucose metabolism, as well as specific protein complexes important in renal development.
Figure 3. Bioinformatic analysis of eGFR-associated SNPs.

Connection of eGFR-associated SNPs to gene expression and variant function across a variety of tissues, pathways and regulatory marks was considered. (a) The DEPICT method shows that implicated eGFR-associated genes are highly expressed in particular tissues, including kidney and urinary tract. Shown are permutation test P values (see Methods). (b) Enrichment of eGFRcrea-associated SNPs in DHS according to discovery P value threshold. SNPs from the eGFR discovery genome-wide scan meeting a series of P value thresholds in the range 10−4–10−16 preferentially map to DHSs, when compared with a set of control SNPs, in 6 of 123 cell types. Represented are main effects odds ratios from a logistic mixed effect model. Cell types indicated with coloured lines had nominally significant enrichment (* indicate P values <0.05) at the P value <10−16 threshold and/or were derived from renal tissues (H7esDiffa2d: H7 embryonic stem cells, differentiated 2 days with BMP4, activin A and bFGF; Hae, amniotic epithelial cells; Hrce, renal cortical epithelial cells; Hre, renal epithelial cells; Hrgec, renal glomerular endothelial cells; Rptec, renal proximal tubule epithelial cells; Saec, small airway epithelial cells). (c) ENCODE/Chromatin ChIP-seq mapping: known and replicated novel eGFRcrea-associated SNPs and their perfect proxies were annotated based on genomic location using chromatin annotation maps from different tissues including adult kidney epithelial cells. P values from Fishers' exact tests for 2 × 2 tables are reported (significance level=5.6 × 10⁻³, see Methods). There is significant enrichment of variants mapping to enhancer regions specifically in kidney but not other non-renal tissues.
Figure 4. Gene set overlap analysis.

The 19 reconstituted gene sets with P value<10−5 were considered. Their overlap was estimated by computing the pairwise Pearson correlation coefficient ρ between each pair of gene sets followed by discretization into one of three bins: 0.3≤ρ<0.5, low overlap; 0.5≤ρ<0.7, medium overlap; ρ⩾0.7, high overlap. Overlap is shown by edges between gene set nodes and edges representing overlap corresponding to ρ<0.3 are not shown. The network was drawn with Cytoscape48.
DNase I hypersensitivity and H3K4m3 chromatin mark analyses
To evaluate whether eGFRcrea-associated SNPs map into gene regulatory regions and to thereby gain insight into their potential function, we evaluated the overlap of independent eGFRcrea-associated SNPs with P values <10−4 (or their proxies) with DHSs using publicly available data from the Epigenomics Roadmap Project and ENCODE for 123 cell types (see Methods). DHSs mark accessible chromatin regions where transcription may occur. Compared with a set of control SNPs (see Methods), eGFRcrea-associated SNPs were significantly more likely to map to DHS in six specific tissues or cell types (Fig. 3b), including adult human renal cortical epithelial cells, adult renal proximal tubule epithelial cells, H7 embryonic stem cells (differentiated 2 days), adult human renal epithelial cells, adult small airway epithelial cells and amniotic epithelial cells. No significant enrichment was observed for adult renal glomerular endothelial cells, the only other kidney tissue evaluated.
Next, we analysed the overlap of the same set of SNPs with H3K4me3 chromatin marks, promoter-specific histone modifications associated with active transcription24, in order to gather more information about cell-type specific regulatory potential of eGFRcrea-associated SNPs. Comparing 33 available adult-derived cell types, we found that eGFRcrea-associated SNPs showed the most significant overlap with H3K4me3 peaks in adult kidney (P value=0.0029), followed by liver (P value=0.0117), and rectal mucosa (P value=0.0445). Taken together, these findings are suggestive of cell-type-specific regulatory roles for eGFR loci, with greatest specificity for the kidney.
Chromatin annotation maps
In addition to assessing individual regulatory marks separately, we annotated the known and replicated novel SNPs, as well as their perfect proxies in a complementary approach. Chromatin annotation maps were generated integrating >10 epigenetic marks from cells derived from adult human kidney tissue and a variety of non-renal tissues from the ENCODE project (see Methods). The proportion of variants to which a function could be assigned was significantly higher when using chromatin annotation maps from renal tissue compared with using maps that investigated the same epigenetic marks in other non-renal tissues (Fig. 3c), again indicating that eGFRcrea associated SNPs are, or tag, kidney-specific regulatory variants. The difference between kidney and non-renal tissues was particularly evident for marks that define enhancers: the proportion of SNPs mapping to weak and strong enhancer regions in the kidney tissue was higher than in all non-kidney tissues (Fishers' exact test P values from 3.1 × 10⁻³ to 7.9 × 10⁻⁶, multiple testing threshold α=5.6 × 10⁻³).
Functional characterization of new loci
To prioritize genes for functional studies, we applied gene prioritization algorithms including GRAIL25, DEPICT and manual curation of selected genes in each region (Supplementary Table 12). For each region, gene selection criteria were as follows: (1) either GRAIL P value <0.05 or DEPICT false discovery rate (FDR) <0.05; (2) the effect of a given allele on eGFRcrea and on eGFRcys was direction-consistent and their ratio was between 0.2 and 5 (to ensure relative homogeneity of the beta coefficients); (3) nearest gene if the signal was located in a region containing a single gene. Using this approach, NFKB1, DPEP1, TSPAN9, NFATC1, WNT7A, PTPRO, SYPL2, UNCX, KBTBD2, SKIL and A1CF were prioritized as likely genes underlying effects at the new loci (Supplementary Table 12).
We investigated the role of these genes during vertebrate kidney development by examining the functional consequences of gene knockdown in zebrafish embryos utilizing antisense morpholino oligonucleotide (MO) technology. After knockdown, we assessed the expression of established renal markers pax2a (global kidney), nephrin (podocytes) and slc20a1a (proximal tubule) at 48 hours post fertilization by in situ hybridization12. In all cases, morphant embryos did not display significant gene expression defects compared with controls (Supplementary Table 15).
Discussion
We identified 24 new loci in association with eGFR and confirmed 29 previously identified loci. A variety of complementary analytic, bioinformatic and functional approaches indicate enrichment of implicated gene products in kidney and urinary tract tissues. A greater proportion of the lead SNPs or their perfect proxies map into gene regulatory regions, specifically enhancers, in adult renal tissues compared with non-renal tissues. In addition to the importance in the adult kidney, our results indicate a role for kidney function variants during development.
We extend our previous findings, as well as those from other groups7,8,9,10,11,12,13 by identifying >50 genomic loci for kidney function, many of which were not previously known to be connected to kidney function and disease. Using a discovery data set that is nearly double in size to our prior effort7, we are now able to robustly link associated SNPs to kidney-specific gene regulatory function. Our work further exemplifies the continued value of increasing the sample size of GWAS meta-analyses to uncover additional loci and gain novel insights into the mechanisms underlying common phenotypes26.
There are several messages from our work. First, many of the genetic variants associated with eGFR appear to affect processes specifically within the kidney. The kidney is a highly vascular and metabolically active organ that receives 20% of all cardiac output, contains an extensive endothelium-lined capillary network, and is sensitive to ischaemic and toxic injury. As a result, hypertension, cardiovascular diseases and diabetes each affect renal hemodynamics and contribute to kidney injury. However, many of the eGFR-associated SNPs in our GWAS could be assigned gene regulatory function specifically in the kidney and its epithelial cells, but not in human glomerular endothelial cells or the general vasculature. In addition, variants associated with eGFR were not associated with vascular traits, such as blood pressure or myocardial infarction. Taken together, these findings suggest that genetic determinants of eGFR may be mediated largely through direct effects within the kidney.
Second, despite the specificity related to renal processes, we also identified several SNPs that are associated with eGFR in diabetes, and our pathway analyses uncovered gene sets associated with glucose transporter activity and abnormal glucose homeostasis. Uncovering bona fide genetic loci for diabetic CKD has been difficult. We have now identified a total of 19 SNPs that demonstrate at least nominal association with eGFR in diabetes. The diabetes population is at particularly high risk of CKD, and identifying kidney injury pathways may help develop new treatments for diabetic CKD.
Finally, even though CKD is primarily a disease of the elderly, our pathway enrichment analyses highlight developmental processes relevant to the kidney and the urogenital tract. Kidney disease has been long thought to have developmental origins, in part related to early programming (Barker hypothesis)27, low birth weight, nephron endowment and early growth and early-life nutrition28. Our pathway enrichment analyses suggest that developmental pathways such as placental morphology, kidney weight and embryo size, as well as protein complexes of importance in renal development may in part contribute to the developmental origins of CKD.
A limitation of our work is that causal variants and precise molecular mechanisms underlying the observed associations were not identified and will require additional experimental follow-up projects. Our attempt to gain insights into potentially causal genes through knockdown in zebrafish did not yield any clear CKD candidate gene, although the absence of a zebrafish phenotype upon gene knockdown does not mean that the gene cannot be the one underlying the observed association signal in humans. Finally, our conclusions that eGFRcrea-associated SNPs regulate the expression of nearby genes specifically in kidney epithelial cells are based on DHSs, H3K4me3 chromatin marks and chromatin annotation maps. Since these analyses rely mostly on variant positions, additional functional investigation such as luciferase assay that assess transcriptional activity more directly are likely to gain additional insights into the variants' mechanism of action.
The kidney specificity for loci we identified may have important translational implications, particularly since our DHS and chromatin annotation analyses suggest that at least a set of gene regulatory mechanisms is important in the adult kidney. Kidney-specific pathways are important for the development of novel therapies to prevent and treat CKD and its progression with minimal risk of toxicity to other organs. Finally, the biologic insights provided by these new loci may help elucidate novel mechanisms and pathways implicated not only in CKD but also of kidney function in the physiological range.
In conclusion, we have confirmed 29 genomic loci and identified 24 new loci in association with kidney function that together highlight target organ-specific regulatory mechanisms related to kidney function.
Methods
Overview
This was a collaborative meta-analysis with a distributive data model. Briefly, an analysis plan was created and circulated to all participating studies. Studies then uploaded study-specific data centrally; files were cleaned, and a specific meta-analysis for each trait was performed. Details regarding each step are provided below. All participants in all discovery and replication studies provided informed consent. Each study had its research protocol approved by the local ethics committee.
Phenotype definitions
Serum creatinine was measured in each discovery and replication study as described in Supplementary Tables 16 and 17, and statistically calibrated to the US nationally representative National Health and Nutrition Examination Study data in all studies to account for between-laboratory variation9,29,30. eGFRcrea was estimated using the four-variable Modification of Diet in Renal Disease Study Equation. Cystatin C, an alternative biomarker for kidney function, was measured in a sub-set of participating studies. eGFRcys was estimated as 76.7 × (serum cystatin C)−1.19 (ref. 31). eGFRcrea and eGFRcys values <15 ml min per 1.73 m2 were set to 15, and those >200 were set to 200 ml min−1 per 1.73 m2. CKD was defined as eGFRcrea <60 ml min−1 per 1.73 m2.
Diabetes was defined as fasting glucose ⩾126 mg dl−1, pharmacologic treatment for diabetes or by self-report. In all studies, diabetes and kidney function were assessed at the same point in time.
Genotypes
Genotyping was conducted in each study as specified in Supplementary Tables 18 and 19. After applying appropriate quality filters, 45 studies used markers of highest quality to impute ∼2.5 million SNPs, based on European-ancestry haplotype reference samples (HapMap II CEU). Four studies based their imputation on the 1000 Genomes Project data. Imputed genotypes were coded as the estimated number of copies of a specified allele (allelic dosage).
Genome-wide association analysis
By following a centralized analysis plan, each study regressed sex- and age-adjusted residuals of the logarithm of eGFRcrea or eGFRcys on SNP dosage levels. Logistic regression of CKD status was performed on SNP dosage levels adjusting for sex and age. For all traits, adjustment for appropriate study-specific features, including study site and genetic principal components was included in the regression and family-based studies appropriately accounted for relatedness.
Stage 1 discovery meta-analysis
GWAS of eGFRcrea were contributed by 48 studies (total sample size, N=133,413); 45 studies contributed GWAS data for the non-diabetes subgroup (N=118,448) and 39 for the diabetes group (N=11,522). GWAS of CKD were comprised by 43 studies, for a total sample size of 117,165, including 12,385 CKD cases. GWAS of eGFRcys were comprised by 16 studies for a total sample size of 32,834. All GWAS files underwent quality control using the GWAtoolbox package32 in R, before including them into the meta-analysis. Genome-wide meta-analysis was performed with the software METAL33, assuming fixed effects and using inverse-variance weighting. The genomic inflation factor λ was estimated for each study as the ratio between the median of all observed test statistics (b/s.e.)2 and the expected median of a χ2 with 1 degree of freedom, with b and s.e. representing the effect of each SNP on the phenotype and its standard error, respectively34. Genomic-control (GC) correction was applied to P values and s.e.'s in case of λ>1 (first GC correction). SNPs with an average minor allele frequency (MAF) of ⩾0.01 were used for the meta-analysis. To limit the possibility of false positives, after the meta-analysis, a second GC correction on the aggregated results was applied. Between-study heterogeneity was assessed through the I2 statistic.
After removing SNPs with MAF of <0.05 and which were available in <50% of the studies, SNPs with a P value of ≤10−6 were selected and clustered into independent loci through LD pruning based on an r2 of ≤0.2 within a window of ±1 MB to each side of the index SNP. After removing loci containing variants that have been previously replicated at a P value of 5.0 × 10⁻⁸ (refs 7, 8), the SNP with the lowest P value within each locus was selected for replication (‘index SNP'). If a SNP had an association P value of ≤10−6 with more than one trait, the trait where the SNP had the lowest P value was selected as discovery trait/stratum. Altogether, this resulted in 48 SNPs: 34 from eGFRcrea, 9 from eGFRcrea among those without diabetes, 4 from CKD and 1 from eGFRcys.
Stage 2 replication analysis
In silico replication analysis for any of the studied traits was carried out using eight independent studies whose genotyping platforms are provided in Supplementary Table 19. De novo genotyping was performed in seven additional studies (N=22,850 individuals) of European ancestry (Supplementary Table 20), including the Bus Santé, ESTHER, KORA-F3 (subset of F3 without GWAS), KORA-F4 (subset of F4 without GWAS), Ogliastra Genetic Park (OGP, without Talana whose GWAS was included in the discovery analysis), SAPHIR and SKIPOGH studies (Supplementary Table 20). Summarizing all in silico and de novo replication studies (Supplementary Table 1), replication data for eGFRcrea were contributed by 14 studies (total sample size=42,166), which also contributed eGFRcrea results from non-diabetes (13 studies, N=36,433) and diabetes samples (13 studies, N=4,955). Thirteen studies contributed replication data on CKD (N=33,972; 4,245 CKD cases; studies with <50 CKD cases were excluded) and five on eGFRcys (N=14,930).
Association between eGFRcrea, CKD and eGFRcys and each of the 48 SNPs in the replication studies was assessed using the same analysis protocol detailed for the discovery studies above. Quality control of the replication files was performed with the same software as described above.
We performed a combined fixed-effect meta-analysis of the double-GC corrected results from the discovery meta-analysis and the replication studies, based on inverse-variance weighting. The total sample size in the combined analysis of eGFRcrea was 175,579 subjects (154,881 in the non-diabetes stratum and 16,477 in the diabetes stratum; the sum of these two sample sizes is smaller than the sample size of the overall analysis because some studies did not contribute both strata), 151,137 samples for CKD (16,630 CKD cases) and 47,764 for eGFRcys. Three criteria were used to ensure validity of novel loci declared as significant: (1) P value from the combined meta-analysis ≤5.0 × 10⁻⁸ in accordance with previously published guidelines35; (2) direction-consistent associations of the beta coefficients in stage 1 and stage 2 (one-sided P values were estimated to test for consistent effect direction with the discovery stage); (3) q-value <0.05 in the replication stage. Q-values were estimated using the package QVALUE36 in R. The tuning parameter lambda for the estimation of the overall proportion of true null hypotheses, π0, was estimated using the bootstrap method37. When the third criterion was not satisfied, the locus was declared ‘suggestive'.
Power analysis
With the sample size achieved in the combined analysis of stage 1 and stage 2 data, the power to assess replication at the canonical genome-wide significance level of 5.0 × 10⁻⁸ was estimated with the software QUANTO38 version 1.2.4, assuming the same MAF and effect size observed in the discovery sample. Power to replicate associations ranged from 87 to 100% for eGFRcrea associated SNPs (median=98%), from 72 to 96% for the CKD-associated SNPs, and was equal to 59% for the eGFRcys-associated SNP (Supplementary Table 3).
Associations stratified by diabetes and hypertension status
For all the 24 novel and 29 known SNPs, the difference between the SNP effect on eGFRcrea in the diabetes versus the non-diabetes groups was assessed by means of a two-sample t-test for correlated data at a significance level of 0.05. We used the following two-sample t-test for correlated data:
 |
where bDM and bnonDM represent the SNP effects on log(eGFRcrea) in the two groups, s.e. is the standard error of the estimate and ρ(.) indicates the correlation between effects in the two groups, which was estimated as 0.044 by sampling 100,000 independent SNPs from our DM and nonDM GWAS, after removing known and novel loci associated with eGFRcrea. For a large sample size, as in our case, t follows a standard normal distribution.
A similar analysis was performed to compare results in subjects with and without hypertension, based on results from our previous work7. The correlation between the two strata was of 0.01.
Proportion of phenotypic variance explained
The percent of phenotypic variance explained by novel and known loci was estimated as  , where
 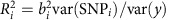 is the coefficient of determination for each of the 53 individual SNPs associated with eGFRcrea uncovered to date (24 novel and 29 known ones), bi is the estimated effect of the ith SNP on y, y corresponds to the sex- and age-adjusted residuals of the logarithm of eGFRcrea and var(SNPi)=2 × MAFSNPi × (1−MAFSNPi)39. Var(y) was estimated in the ARIC study and all loci were assumed to have independent effects on the phenotype.
Test for SNP associations with related traits
We performed evaluations of SNP association with results generated from consortia investigating other traits. Specifically, we evaluated systolic and diastolic blood pressure in ICBP17, myocardial infarction in CARDiOGRAM18, left ventricular mass19, heart failure20, the urinary albumin to creatinine ratio (CKDGen consortium, personal communication) and fasting plasma glucose in MAGIC21. In total, we performed 165 tests, corresponding to 7 traits tested for association against each of the 24 novel SNP, with the exception of myocardial infarction for which results from 3 SNPs were not available (Supplementary Table 6). Significance was evaluated at the Bonferroni corrected level of 0.05/165=0.0003.
Lookup of replicated loci in the NHGRI GWAS catalog
All replicated SNPs, as well as SNPs in LD (r2>0.2) within ±1 MB distance were checked for their association with other traits according to the NHGRI GWAS catalog40 (accessed April 14, 2014).
SNP assessments in other ethnic groups
We performed cross-ethnicity SNP evaluations in participants of African ancestry from a meta-analysis of African ancestry individuals and from participants of Asian descent from the AGEN consortium11.
African ancestry meta-analysis
We performed fixed-effect meta-analysis of the genome-wide association data from 12 African ancestry studies (Supplementary Table 8) with imputation to HapMap reference panel, based on inverse-variance weighting using METAL. Only SNPs with MAF ⩾0.01 and imputation quality r2⩾0.3 were considered for the meta-analysis. After meta-analysis, we removed SNPs with MAF <0.05 and which were available in <50% of the studies. Statistical significance was assessed at the standard threshold of 5.0 × 10⁻⁸. Genomic control correction was applied at both the individual study level before meta-analysis and after the meta-analysis.
Transethnic meta-analysis
We performed a trans-ethnic meta-analysis of GWAS data from cohorts of different ethnic backgrounds using MANTRA (Meta-Analysis of Trans-ethnic Association studies) software22. We combined the 48 European ancestry studies that contributed eGFRcrea, which were included in stage 1 discovery meta-analysis, and the 12 African ancestry studies mentioned above for a total sample size of 150,253 samples. We limited our analysis to biallelic SNPs with MAF ⩾0.01 and imputation quality r2⩾0.3. Relatedness between the 60 studies was estimated using default settings from up to 5.9 million SNPs. Only SNPs that were present in more than 25 European ancestry studies and 6 African ancestry studies (total sample size ⩾120,000) were considered after meta-analysis. Genome-wide significance was defined as a log10 Bayes' Factor (log10BF) ⩾6 (ref. 41).
Gene Relationships Across Implicated Loci (GRAIL)
To prioritize the gene(s) most likely to give rise to association signals in a given region, the software GRAIL was used25. The index SNP of all previously known kidney function associated regions, as well as the novel SNPs identified here was used as input, using the CEU HapMap (hg18 assembly) and the functional datasource text_2009_03, established before the publication of kidney function-related GWAS. Results from GRAIL were used to prioritize genes for follow-up functional work.
Expression quantitative trait loci analysis
We identified alias rsIDs and proxies (r2>0.8) for our index SNPs using SNAP software across 4 HapMap builds. SNP rsIDs and aliases were searched for primary SNPs and LD proxies against a collected database of expression SNP (eSNP) results. The collected eSNP results met criteria for statistical thresholds for association with gene transcript levels in their respective original analyses (for references see Supplementary Table 11). Correlation of selected eSNPs to the best eSNPs per transcript per expression quantitative trait loci (eQTL) data set were assessed by pairwise LD. All results are reported in Supplementary Table 11.
DEPICT analysis
In this work, we first used PLINK42 to identify independently associated SNPs using all SNPs with eGFRcrea association P values <10−5 (HapMap release 27 CEU data43; LD r2 threshold=0.01; physical kb threshold=1,000). We then used the DEPICT method23 to construct associated regions by mapping genes to independently associated SNPs if they overlapped or resided within LD (r2>0.5) distance of a given associated SNP. After merging overlapping regions and discarding regions that mapped within the major histocompatibility complex locus (chromosome 6, base pairs 20,000,000–40,000,000), 124 non-overlapping regions remained that covered a total of 320 genes. Finally, we ran the DEPICT software program on the 124 regions to prioritize genes that may represent promising candidates for experimental follow up studies, identify reconstituted gene sets that are enriched in genes from associated regions and therefore may provide insight into general kidney function biology, and identify tissue and cell-type annotations in which genes from associated regions are highly expressed. Specifically, for each tissue, the DEPICT method performs a t-test comparing the tissue-specific expression of eGFRcrea-associated genes and all other genes. Next, for each tissue, empirical enrichment P values are computed by repeatedly sampling random sets of loci (matched to the actual eGFRcrea loci by gene density) from the entire genome to estimate the empirical mean and s.d. of the enrichment statistic's null distribution. To visualize the nineteen reconstituted gene sets with P value <1e−5 (Fig. 4), we estimated their overlap by computing the pairwise Pearson correlation coefficient ρ between each pair of gene sets followed by discretization into one of three bins; 0.3≤ρ<0.5, low overlap; 0.5≤ρ<0.7, medium overlap; ρ⩾0.7, high overlap.
DNase I hypersensitivity analysis
The overlap of SNPs associated with eGFRcrea at P<10−4 with DHSs was examined using publically available data from the Epigenomics Roadmap Project and ENCODE. In all, DHS mappings were available for 123 mostly adult cells and tissues44 (downloaded from http://hgdownload.cse.ucsc.edu/goldenPath/hg19/encodeDCC/wgEncodeUwDnase/). The analysis here pertains to DHS's defined as ‘broad' peaks, which were available as experimental replicates (typically duplicates) for the majority of cells and tissues.
SNPs from our stage 1 eGFRcrea GWAS meta-analysis were first clumped in PLINK42 in windows of 100 kb and maximum r2 of 0.1 using LD relationships from the 1,000 Genomes EUR panel (phase I, v3, 3/14/2012 haplotypes) using a series of P value thresholds (10−4, 10−6, 10−8, ... and 10−16). LD proxies of the index SNPs from the clumping procedure were then identified by LD tagging in PLINK with r2=0.8 in windows of 100 kb, again using LD relationships in the 1000G EUR panel, restricted to SNPs with MAF >1% and also present in the HapMap2 CEU population. A reference set of control SNPs was constructed using the same clumping and tagging procedures applied to NHGRI GWAS catalog SNPs (available at http://www.genome.gov/gwastudies/, accessed 13 March 2013) with discovery P values <5.0 × 10⁻⁸ in European populations. In total, there were 1,204 such reference SNPs after LD pruning. A small number of reference SNPs or their proxies overlapping with the eGFRcrea SNPs or their proxies were excluded. For each cell-type and P value threshold, the enrichment of eGFR SNPs (or their LD proxies) mapping to DHSs relative to the GWAS catalog reference SNPs (or their LD proxies) was expressed as an odds ratio from logistic mixed effect models that treated the replicate peak determinations as random effects (lme4 package in R). Significance for enrichment odds ratio was derived from the significance of beta coefficients for the main effects in the mixed models.
Interrogation of human kidney chromatin annotation maps
Different chromatin modification patterns can be used to generate tissue-specific chromatin-state annotation maps. These can serve as a valuable resource to discover regulatory regions and study their cell-type-specific distributions and activities, which may help with the interpretation especially of intergenic variants identified in association studies45. We therefore investigated the genomic mapping of the known and replicated novel index SNPs, as well as their perfect LD proxies (n=173, r2=1 for proxies) using a variety of resources, including chromatin maps generated from human kidney tissue cells (HKC-E cells). Chromatin immune-precipitation sequencing (ChIP-seq) data from human kidney samples were generated by NIH Roadmap Epigenomics Mapping Consortium46. Briefly, proximal tubule cells derived from an adult human kidney were collected and cross-linked with 1% formaldehyde. Subsequently, ChIP-seq was conducted using whole-cell extract from adult kidney tissue as the input (GSM621638) and assessing the following chromatin marks: H3K36me3 (GSM621634), H3K4me1 (GSM670025), H3K4me3 (GSM621648), H3K9ac (GSM772811) and H3K9me3 (GSM621651). The MACS version 1.4.1 (model-based analysis of ChIP-Seq) peak-finding algorithm was used to identify regions of ChIP-Seq enrichment47. A FDR threshold of enrichment of 0.01 was used for all data sets. The resulting genomic coordinates in bed format were further used in ChromHMM v1.06 for chromatin annotation45. For comparison, the same genomic coordinates were investigated in chromatin annotation maps of renal tissue, as well as across nine different cell lines from the ENCODE Project: umbilical vein endothelial cells (HUVEC), mammary epithelial cells (HMEC), normal epidermal keratinocytes (NHEK), B-lymphoblastoid cells (GM12878), erythrocytic leukemia cells (K562), normal lung fibroblasts (NHLF), skeletal muscle myoblasts (HSMM), embryonic stem cells (H1 ES) and hepatocellular carcinoma cells (HepG2). We tested whether the proportion of SNPs pointing to either strong or weak enhancers in the human kidney tissue cells was different from that of the other nine tissues by means of a Fishers' exact test for 2 × 2 tables, contrasting each of the nine cell lines listed above against the reference kidney cell line, at a Bonferroni-corrected significance level of 0.05/9=5.6 × 10−3.
Functional characterization of new loci
Replicated gene regions were prioritized for functional studies using the following criteria: (1) GRAIL identification of a gene in each region of P value<0.05 or DEPICT, FDR <0.05); (2) an eGFRcrea to eGFRcys ratio between 0.2 and 5 with direction consistency between the beta coefficients; (3) nearest gene if the signal was located in a gene-poor region. The list of genes selected for functional work can be found in Supplementary Table 12. This same prioritization scheme was also used to assign locus names. Morpholino knockdowns were performed in zebrafish.
Zebrafish (strain Tübingen, TU) were maintained according to established Harvard Medical School Institutional Animal Care and Use Committee protocols (protocol # 04626). Male and female fish were mated (age 6–12 months) for embryo production. Embryos were injected at the one-cell stage with MOs (GeneTools) designed to block either the ATG start site or an exon–intron splice site of the target gene (Supplementary Table 21). In cases where human loci are duplicated in zebrafish, both orthologues were knocked down simultaneously by combination MO injection. MOs were injected in escalating doses at concentrations up to 250 μM. Embryos were fixed in 4% paraformaldehyde at 48 h post fertilization for in situ hybridization using published methods (http://zfin.org/ZFIN/Methods/ThisseProtocol.html). Gene expression was visualized using established renal markers pax2a (global kidney), nephrin (podocytes) and slc20a1a (proximal tubule). The number of morphant embryos displaying abnormal gene expression was compared with control embryos by means of a Fisher's exact test.
Additional information
How to cite this article: Pattaro, C. et al. Genetic associations at 53 loci highlight cell types and biological pathways relevant for kidney function. Nat. Commun. 7:10023 doi: 10.1038/ncomms10023 (2016).
Supplementary Material
Supplementary Figures 1-7, Supplementary Tables 1-21, Supplementary Note 1 and Supplementary References
Acknowledgments
Study-specific acknowledgements and funding sources for participating studies are reported in Supplementary Note. Zebrafish work was supported by NIH R01DK090311 and R24OD017870 to W.G.
Footnotes
J.T. and P.H. are consultants for Servier. J.C. received research grants and honoraria from Servier. K.S. obtained research support from Boehringer Ingelheim. The remaining authors declared no competing financial interests.
Author contributions Study design: C Helmer, B Stengel, J Chalmers, M Woodward, P Hamet, G Eiriksdottir, LJ Launer, TB Harris, V Gudnason, JR O'Connell, A Köttgen, E Boerwinkle, WHL Kao, P Mitchell, I Guessous, JM Gaspoz, N Bouatia-Naji, P Froguel, A Metspalu, T Esko, BA Oostra, CM van Duijn, V Emilsson, H Brenner, I Borecki, CS Fox, Q Yang, BK Krämer, PS Wild, BI Freedman, J Ding, Y Liu, AB Zonderman, MK Evans, A Adeyemo, CN Rotimi, D Cusi, P Gasparini, M Ciullo, D Toniolo, C Gieger, C Meisinger, CA Böger, HE Wichmann, T Illig, I Rudan, W März, PP Pramstaller, EP Bottinger, BW Penninx, H Snieder, U Gyllensten, AF Wright, H Campbell, JF Wilson, SH Wild, GJ Navis, BM Buckley, I Ford, JW Jukema, B Paulweber, L Kedenko, F Kronenberg, K Endlich, R Rettig, R Biffar, H Völzke, JK Fernandes, MM Sale, M Pruijm, GB Ehret, A Tönjes, M Stumvoll, JC Denny, RJ Carroll, N Hastie, O Polasek, PM Ridker, J Viikari, M Kähönen, O Raitakari, T Lehtimäki.
Study management: C Helmer, M Metzger, J Tremblay, J Chalmers, M Woodward, P Hamet, G Eiriksdottir, TB Harris, T Aspelund, V Gudnason, A Parsa, AR Shuldiner, BD Mitchell, E Boerwinkle, J Coresh, WHL Kao, R Schmidt, L Ferrucci, E Rochtchina, JJ Wang, J Attia, P Mitchell, I Guessous, JM Gaspoz, M Bochud, DS Siscovick, O Devuyst, P Froguel, T Esko, BA Oostra, CM van Duijn, V Emilsson, AK Dieffenbach, H Brenner, I Borecki, CS Fox, M Rheinberger, ST Turner, S Kloiber, PS Wild, J Ding, Y Liu, SLR Kardia, AB Zonderman, MK Evans, MC Cornelis, A Adeyemo, CN Rotimi, D Cusi, E Salvi, PB Munroe, P Gasparini, M Ciullo, R Sorice, C Sala, D Toniolo, AW Dreisbach, DI Chasman, C Gieger, C Meisinger, M Waldenberger, HE Wichmann, T Illig, W Koenig, I Rudan, I Kolcic, M Boban, T Zemunik, W März, H Kramer, PP Pramstaller, EP Bottinger, O Gottesman, BW Penninx, H Snieder, JH Smit, AF Wright, H Campbell, JF Wilson, SH Wild, W Lieb, GJ Navis, BM Buckley, I Ford, JW Jukema, A Hofman, OH Franco, M Adam, M Imboden, N Probst-Hensch, B Paulweber, L Kedenko, F Kronenberg, S Coassin, M Haun, HK Kroemer, K Endlich, M Nauck, R Rettig, R Biffar, S Stracke, U Völker, H Wallaschofski, H Völzke, KL Keene, MM Sale, B Ponte, D Ackermann, M Pruijm, GB Ehret, A Tönjes, P Kovacs, JC Denny, RJ Carroll, C Hayward, O Polasek, V Vitart, PM Ridker, J Viikari, M Kähönen, O Raitakari, T Lehtimäki.
Subject recruitment: C Helmer, P Hamet, TB Harris, T Aspelund, V Gudnason, AR Shuldiner, BD Mitchell, J Coresh, WHL Kao, M Cavalieri, R Schmidt, JB Whitfield, NG Martin, L Ferrucci, P Mitchell, I Guessous, DS Siscovick, O Devuyst, A Metspalu, BA Oostra, CM van Duijn, BK Krämer, ST Turner, S Kloiber, PS Wild, BI Freedman, MA McEvoy, RJ Scott, AB Zonderman, MK Evans, GC Curhan, A Adeyemo, CN Rotimi, D Cusi, A Lupo, G Gambaro, P d'Adamo, A Robino, S Ulivi, D Ruggiero, M Ciullo, R Sorice, D Toniolo, C Gieger, C Meisinger, CA Böger, HE Wichmann, T Illig, W Koenig, I Rudan, I Kolcic, M Boban, T Zemunik, PP Pramstaller, EP Bottinger, BW Penninx, Å Johansson, I Persico, M Pirastu, JF Wilson, SH Wild, A Franke, G Jacobs, GJ Navis, IM Leach, BM Buckley, I Ford, JW Jukema, N Probst-Hensch, B Paulweber, L Kedenko, F Kronenberg, R Rettig, R Biffar, S Stracke, H Völzke, P Muntner, JK Fernandes, MM Sale, B Ponte, D Ackermann, M Pruijm, GB Ehret, A Tönjes, JC Denny, RJ Carroll, O Polasek, J Viikari, M Kähönen, O Raitakari, T Lehtimäki.
Interpretation of results: C Helmer, JC Lambert, M Metzger, B Stengel, V Chouraki, J Tremblay, J Chalmers, M Woodward, P Hamet, AV Smith, A Parsa, JR O'Connell, A Tin, A Köttgen, M Li, WHL Kao, Y Li, EG Holliday, J Attia, I Guessous, CA Peralta, AC Morrison, JF Felix, C Pattaro, G Li, IH de Boer, O Devuyst, H Lin, A Isaacs, V Emilsson, AD Johnson, CS Fox, M Olden, Q Yang, EJ Atkinson, M de Andrade, ST Turner, T Zeller, J Ding, Y Liu, M Nalls, A Adeyemo, D Shriner, D Cusi, E Salvi, V Mijatovic, D Ruggiero, R Sorice, AW Dreisbach, AY Chu, DI Chasman, CA Böger, IM Heid, M Gorski, B Tayo, C Fuchsberger, H Snieder, IM Nolte, W Igl, K Susztak, N Verweij, S Trompet, A Dehghan, B Kollerits, F Kronenberg, A Teumer, J Divers, KL Keene, MM Sale, WM Chen, GB Ehret, I Prokopenko, R Mägi, JC Denny, RJ Carroll.
Design, performance and interpretation of zebrafish experiments: M Garnaas, W Goessling.
Drafting manuscript: J Chalmers, A Tin, A Köttgen, WHL Kao, M Bochud, CA Peralta, C Pattaro, IH de Boer, CS Fox, M Garnaas, W Goessling, N Soranzo, CA Böger, IM Heid, M Gorski, S Trompet, A Dehghan, A Teumer, KL Keene, MM Sale.
Critical review of the manuscript: J Tremblay, J Chalmers, M Woodward, P Hamet, TB Harris, V Gudnason, A Parsa, AR Shuldiner, BD Mitchell, A Tin, A Köttgen, E Boerwinkle, J Coresh, M Li, WHL Kao, Y Li, H Schmidt, M Cavalieri, R Schmidt, JB Whitfield, EG Holliday, JJ Wang, J Attia, P Mitchell, I Guessous, JM Gaspoz, M Bochud, CA Peralta, AC Morrison, JF Felix, C Pattaro, DS Siscovick, IH de Boer, M Rao, R Katz, O Devuyst, TH Pers, A Isaacs, H Brenner, M Garnaas, W Goessling, BK Krämer, M Rheinberger, ST Turner, D Czamara, S Kloiber, T Zeller, BI Freedman, JM Stafford, J Ding, Y Liu, MA McEvoy, RJ Scott, SJ Hancock, JA Smith, JD Faul, SLR Kardia, AB Zonderman, M Nalls, MK Evans, FB Hu, GC Curhan, MC Cornelis, A Lupo, G Gambaro, G Malerba, M Ciullo, R Sorice, AW Dreisbach, AY Chu, DI Chasman, C Gieger, H Grallert, C Meisinger, M Waldenberger, CA Böger, HE Wichmann, IM Heid, M Gorski, T Illig, W Koenig, I Kolcic, M Boban, T Zemunik, W März, B Tayo, H Kramer, SE Rosas, C Fuchsberger, D Ruderfer, EP Bottinger, O Gottesman, RJF Loos, Y Lu, H Snieder, H Campbell, A Franke, W Lieb, IM Leach, BM Buckley, I Ford, JW Jukema, S Trompet, A Dehghan, S Sedaghat, GA Thun, M Adam, M Imboden, N Probst-Hensch, B Kollerits, B Paulweber, L Kedenko, F Kronenberg, A Teumer, K Endlich, H Völzke, KL Keene, MM Sale, WM Chen, B Ponte, D Ackermann, M Pruijm, GB Ehret, A Tönjes, I Prokopenko, M Stumvoll, P Kovacs, R Mägi, JC Denny, O Polasek, J Viikari, LP Lyytikäinen, M Kähönen, O Raitakari, T Lehtimäki.
Statistical methods and analysis: C Helmer, JC Lambert, M Metzger, V Chouraki, J Tremblay, P Hamet, AV Smith, T Aspelund, A Parsa, JR O'Connell, A Tin, A Köttgen, M Li, M Foster, WHL Kao, Y Li, H Schmidt, M Struchalin, NG Martin, RPS Middelberg, T Tanaka, E Rochtchina, EG Holliday, I Guessous, M Bochud, JF Felix, C Pattaro, G Li, R Katz, JN Hirschhorn, J Karjalainen, L Franke, TH Pers, L Yengo, N Bouatia-Naji, H Lin, T Nikopensius, T Esko, A Isaacs, A Demirkan, MF Feitosa, M Olden, MH Chen, Q Yang, SJ Hwang, M Garnaas, W Goessling, EJ Atkinson, M de Andrade, D Czamara, S Kloiber, C Müller, JM Stafford, J Ding, K Lohman, Y Liu, JA Smith, JD Faul, M Nalls, MC Cornelis, A Adeyemo, D Shriner, E Salvi, V Mijatovic, A Robino, S Ulivi, R Sorice, G Pistis, M Cocca, AY Chu, DI Chasman, LM Rose, CA Böger, IM Heid, M Gorski, ME Kleber, B Tayo, C Fuchsberger, A Saint-Pierre, D Taliun, D Ruderfer, Y Lu, IM Nolte, PJ van der Most, S Enroth, W Igl, F Murgia, L Portas, K Susztak, YA Ko, N Verweij, S Trompet, A Dehghan, S Sedaghat, GA Thun, M Adam, M Imboden, N Probst-Hensch, B Kollerits, A Teumer, J Divers, WM Chen, GB Ehret, I Prokopenko, R Mägi, CM Shaffer, RJ Carroll, C Hayward, V Vitart, LP Lyytikäinen, V Aalto.
Genotyping: JC Lambert, J Tremblay, P Hamet, E Boerwinkle, WHL Kao, H Schmidt, GW Montgomery, L Ferrucci, M Bochud, BA Oostra, CM van Duijn, K Butterbach, I Borecki, M de Andrade, T Zeller, Y Liu, RJ Scott, SLR Kardia, M Nalls, FB Hu, GC Curhan, A Adeyemo, D Shriner, D Cusi, N Soranzo, P d'Adamo, D Ruggiero, M Ciullo, R Sorice, DI Chasman, H Grallert, T Zemunik, ME Kleber, EP Bottinger, O Gottesman, RJF Loos, AF Wright, JF Wilson, A Franke, D Ellinghaus, JW Jukema, S Trompet, AG Uitterlinden, F Rivadeneira, F Kronenberg, S Coassin, M Haun, F Ernst, G Homuth, HK Kroemer, M Nauck, U Völker, H Wallaschofski, MM Sale, GB Ehret, A Tönjes, M Stumvoll, P Kovacs, CM Shaffer, JC Denny, PM Ridker, T Lehtimäki.
Bioinformatics: JC Lambert, V Chouraki, J Tremblay, P Hamet, AV Smith, T Aspelund, JR O'Connell, E Boerwinkle, Y Li, M Struchalin, GW Montgomery, RPS Middelberg, T Tanaka, C Pattaro, G Li, JN Hirschhorn, J Karjalainen, L Franke, TH Pers, L Yengo, T Esko, AD Johnson, M Olden, M Garnaas, W Goessling, D Czamara, C Müller, JA Smith, SLR Kardia, M Nalls, E Salvi, G Malerba, V Mijatovic, P d'Adamo, S Ulivi, R Sorice, C Sala, G Pistis, M Cocca, DI Chasman, H Grallert, M Waldenberger, CA Böger, IM Heid, M Gorski, ME Kleber, D Taliun, O Gottesman, S Enroth, K Susztak, YA Ko, D Ellinghaus, N Verweij, I Ford, S Trompet, F Rivadeneira, WM Chen, GB Ehret, R Mägi, CM Shaffer, JC Denny, RJ Carroll, C Hayward, LP Lyytikäinen, V Aalto.
Contributor Information
ICBP Consortium:
Goncalo R. Abecasis, Linda S. Adair, Myriam Alexander, David Altshuler, Najaf Amin, Dan E. Arking, Pankaj Arora, Yurii Aulchenko, Stephan J. L. Bakker, Stefania Bandinelli, Ines Barroso, Jacques S. Beckmann, John P. Beilby, Richard N. Bergman, Sven Bergmann, Joshua C. Bis, Michael Boehnke, Lori L. Bonnycastle, Stefan R. Bornstein, Michiel L. Bots, Jennifer L. Bragg-Gresham, Stefan-Martin Brand, Eva Brand, Peter S. Braund, Morris J. Brown, Paul R. Burton, Juan P. Casas, Mark J. Caulfield, Aravinda Chakravarti, John C. Chambers, Giriraj R. Chandak, Yen-Pei C. Chang, Fadi J. Charchar, Nish Chaturvedi, Yoon Shin Cho, Robert Clarke, Francis S. Collins, Rory Collins, John M. Connell, Jackie A. Cooper, Matthew N. Cooper, Richard S. Cooper, Anna Maria Corsi, Marcus Dörr, Santosh Dahgam, John Danesh, George Davey Smith, Ian N. M. Day, Panos Deloukas, Matthew Denniff, Anna F. Dominiczak, Yanbin Dong, Ayo Doumatey, Paul Elliott, Roberto Elosua, Jeanette Erdmann, Susana Eyheramendy, Martin Farrall, Cristiano Fava, Terrence Forrester, F. Gerald R. Fowkes, Ervin R. Fox, Timothy M. Frayling, Pilar Galan, Santhi K. Ganesh, Melissa Garcia, Tom R. Gaunt, Nicole L. Glazer, Min Jin Go, Anuj Goel, Jürgen Grässler, Diederick E. Grobbee, Leif Groop, Simonetta Guarrera, Xiuqing Guo, David Hadley, Anders Hamsten, Bok-Ghee Han, Rebecca Hardy, Anna-Liisa Hartikainen, Simon Heath, Susan R. Heckbert, Bo Hedblad, Serge Hercberg, Dena Hernandez, Andrew A. Hicks, Gina Hilton, Aroon D. Hingorani, Judith A Hoffman Bolton, Jemma C. Hopewell, Philip Howard, Steve E. Humphries, Steven C. Hunt, Kristian Hveem, M. Arfan Ikram, Muhammad Islam, Naoharu Iwai, Marjo-Riitta Jarvelin, Anne U. Jackson, Tazeen H. Jafar, Charles S. Janipalli, Toby Johnson, Sekar Kathiresan, Kay-Tee Khaw, Hyung-Lae Kim, Sanjay Kinra, Yoshikuni Kita, Mika Kivimaki, Jaspal S. Kooner, M. J. Kranthi Kumar, Diana Kuh, Smita R. Kulkarni, Meena Kumari, Johanna Kuusisto, Tatiana Kuznetsova, Markku Laakso, Maris Laan, Jaana Laitinen, Edward G. Lakatta, Carl D. Langefeld, Martin G. Larson, Mark Lathrop, Debbie A. Lawlor, Robert W. Lawrence, Jong-Young Lee, Nanette R. Lee, Daniel Levy, Yali Li, Will T. Longstreth, Jian'an Luan, Gavin Lucas, Barbara Ludwig, Massimo Mangino, K. Radha Mani, Michael G. Marmot, Francesco U. S. Mattace-Raso, Giuseppe Matullo, Wendy L. McArdle, Colin A. McKenzie, Thomas Meitinger, Olle Melander, Pierre Meneton, James F. Meschia, Tetsuro Miki, Yuri Milaneschi, Karen L. Mohlke, Vincent Mooser, Mario A. Morken, Richard W. Morris, Thomas H. Mosley, Samer Najjar, Narisu Narisu, Christopher Newton-Cheh, Khanh-Dung Hoang Nguyen, Peter Nilsson, Fredrik Nyberg, Christopher J. O'Donnell, Toshio Ogihara, Takayoshi Ohkubo, Tomonori Okamura, RickTwee-Hee Ong, Halit Ongen, N. Charlotte Onland-Moret, Paul F. O'Reilly, Elin Org, Marco Orru, Walter Palmas, Jutta Palmen, Lyle J. Palmer, Nicholette D. Palmer, Alex N. Parker, John F. Peden, Leena Peltonen, Markus Perola, Vasyl Pihur, Carl G. P. Platou, Andrew Plump, Dorairajan Prabhakaran, Bruce M. Psaty, Leslie J. Raffel, Dabeeru C. Rao, Asif Rasheed, Fulvio Ricceri, Kenneth M. Rice, Annika Rosengren, Jerome I. Rotter, Megan E. Rudock, Siim Sõber, Tunde Salako, Danish Saleheen, Veikko Salomaa, Nilesh J. Samani, Steven M. Schwartz, Peter E. H. Schwarz, Laura J. Scott, James Scott, Angelo Scuteri, Joban S. Sehmi, Mark Seielstad, Sudha Seshadri, Pankaj Sharma, Sue Shaw-Hawkins, Gang Shi, Nick R. G. Shrine, Eric J. G. Sijbrands, Xueling Sim, Andrew Singleton, Marketa Sjögren, Nicholas L. Smith, Maria Soler Artigas, Tim D. Spector, Jan A. Staessen, Alena Stancakova, Nanette I. Steinle, David P. Strachan, Heather M. Stringham, Yan V. Sun, Amy J. Swift, Yasuharu Tabara, E-Shyong Tai, Philippa J. Talmud, Andrew Taylor, Janos Terzic, Dag S. Thelle, Martin D. Tobin, Maciej Tomaszewski, Vikal Tripathy, Jaakko Tuomilehto, Ioanna Tzoulaki, Manuela Uda, Hirotsugu Ueshima, Cuno S. P. M. Uiterwaal, Satoshi Umemura, Pim van der Harst, Yvonne T. van der Schouw, Wiek H. van Gilst, Erkki Vartiainen, Ramachandran S. Vasan, Gudrun Veldre, Germaine C. Verwoert, Margus Viigimaa, D. G. Vinay, Paolo Vineis, Benjamin F. Voight, Peter Vollenweider, Lynne E. Wagenknecht, Louise V. Wain, Xiaoling Wang, Thomas J. Wang, Nicholas J. Wareham, Hugh Watkins, Alan B. Weder, Peter H. Whincup, Kerri L. Wiggins, Jacqueline C. M. Witteman, Andrew Wong, Ying Wu, Chittaranjan S. Yajnik, Jie Yao, J. H. Young, Diana Zelenika, Guangju Zhai, Weihua Zhang, Feng Zhang, Jing Hua Zhao, Haidong Zhu, Xiaofeng Zhu, Paavo Zitting, and Ewa Zukowska-Szczechowska
AGEN Consortium:
Yukinori Okada, Jer-Yuarn Wu, Dongfeng Gu, Fumihiko Takeuchi, Atsushi Takahashi, Shiro Maeda, Tatsuhiko Tsunoda, Peng Chen, Su-Chi Lim, Tien-Yin Wong, Jianjun Liu, Terri L. Young, Tin Aung, Yik-Ying Teo, Young Jin Kim, Daehee Kang, Chien-Hsiun Chen, Fuu-Jen Tsai, Li-Ching Chang, S. -J. Cathy Fann, Hao Mei, James E. Hixson, Shufeng Chen, Tomohiro Katsuya, Masato Isono, Eva Albrecht, Kazuhiko Yamamoto, Michiaki Kubo, Yusuke Nakamura, Naoyuki Kamatani, Norihiro Kato, Jiang He, Yuan-Tsong Chen, and Toshihiro Tanaka
CARDIOGRAM:
Muredach P Reilly, Heribert Schunkert, Themistocles L. Assimes, Alistair Hall, Christian Hengstenberg, Inke R. König, Reijo Laaksonen, Ruth McPherson, John R. Thompson, Unnur Thorsteinsdottir, Andreas Ziegler, Devin Absher, Li Chen, L. Adrienne Cupples13, Eran Halperin, Mingyao Li, Kiran Musunuru, Michael Preuss, Arne Schillert, Gudmar Thorleifsson, George A. Wells, Hilma Holm, Robert Roberts, Alexandre F. R. Stewart, Stephen Fortmann, Alan Go, Mark Hlatky, Carlos Iribarren, Joshua Knowles, Richard Myers, Thomas Quertermous, Steven Sidney, Neil Risch, Hua Tang, Stefan Blankenberg, Renate Schnabel, Christoph Sinning, Karl J. Lackner, Laurence Tiret, Viviane Nicaud, Francois Cambien, Christoph Bickel, Hans J. Rupprecht, Claire Perret, Carole Proust, Thomas F. Münzel, Maja Barbalic, Ida Yii-Der Chen, Serkalem Demissie-Banjaw, Aaron Folsom, Thomas Lumley, Kristin Marciante, Kent D. Taylor, Kelly Volcik, Solveig Gretarsdottir, Jeffrey R. Gulcher, Augustine Kong, Kari Stefansson, Gudmundur Thorgeirsson, Karl Andersen, Marcus Fischer, Anika Grosshennig, Patrick Linsel-Nitschke, Klaus Stark, Stefan Schreiber, Zouhair Aherrahrou, Petra Bruse, Angela Doering, Norman Klopp, Patrick Diemert, Christina Loley, Anja Medack, Janja Nahrstedt, Annette Peters, Arnika K. Wagner, Christina Willenborg, Bernhard O. Böhm, Harald Dobnig, Tanja B. Grammer, Michael M. Hoffmann, Andreas Meinitzer, Bernhard R. Winkelmann, Stefan Pilz, Wilfried Renner, Hubert Scharnagl, Tatjana Stojakovic, Andreas Tomaschitz, Karl Winkler, Candace Guiducci, Noel Burtt, Stacey B. Gabriel, Sonny Dandona, Olga Jarinova, Liming Qu, Robert Wilensky, William Matthai, Hakon H. Hakonarson, Joe Devaney, Mary Susan Burnett, Augusto D. Pichard, Kenneth M. Kent, Lowell Satler, Joseph M. Lindsay, Ron Waksman, Christopher W. Knouff, Dawn M. Waterworth, Max C. Walker, Stephen E. Epstein, Daniel J. Rader, Christopher P. Nelson, Benjamin J. Wright, Anthony J. Balmforth, and Stephen G. Ball
CHARGe-Heart Failure Group:
Laura R. Loehr, Wayne D. Rosamond, Emelia Benjamin, Talin Haritunians, David Couper, Joanne Murabito, Ying A. Wang, Bruno H. Stricker, Patricia P. Chang, and James T. Willerson
ECHOGen Consortium:
Stephan B. Felix, Norbert Watzinger, Jayashri Aragam, Robert Zweiker, Lars Lind, Richard J. Rodeheffer, Karin Halina Greiser, Jaap W. Deckers, Jan Stritzke, Erik Ingelsson, Iftikhar Kullo, Johannes Haerting, Thorsten Reffelmann, Margaret M. Redfield, Karl Werdan, Gary F. Mitchell, Donna K. Arnett, John S. Gottdiener, Maria Blettner, and Nele Friedrich
References
- Eckardt K. U. et al. Evolving importance of kidney disease: from subspecialty to global health burden. Lancet 382, 158–169 (2013) . [DOI] [PubMed] [Google Scholar]
- El Nahas M. The global challenge of chronic kidney disease. Kidney Int. 68, 2918–2929 (2005) . [DOI] [PubMed] [Google Scholar]
- Baumeister S. E. et al. Effect of chronic kidney disease and comorbid conditions on health care costs: A 10-year observational study in a general population. Am. J. Nephrol. 31, 222–229 (2010) . [DOI] [PubMed] [Google Scholar]
- Fox C. S. et al. Associations of kidney disease measures with mortality and end-stage renal disease in individuals with and without diabetes: a meta-analysis. Lancet 380, 1662–1673 (2012) . [DOI] [PMC free article] [PubMed] [Google Scholar]
- Mahmoodi B. K. et al. Associations of kidney disease measures with mortality and end-stage renal disease in individuals with and without hypertension: a meta-analysis. Lancet 380, 1649–1661 (2012) . [DOI] [PMC free article] [PubMed] [Google Scholar]
- Himmelfarb J. & Tuttle K. R. New therapies for diabetic kidney disease. N. Engl. J. Med. 369, 2549–2550 (2013) . [DOI] [PubMed] [Google Scholar]
- Pattaro C. et al. Genome-wide association and functional follow-up reveals new loci for kidney function. PLoS Genet. 8, e1002584 (2012) . [DOI] [PMC free article] [PubMed] [Google Scholar]
- Kottgen A. et al. New loci associated with kidney function and chronic kidney disease. Nat. Genet. 42, 376–384 (2010) . [DOI] [PMC free article] [PubMed] [Google Scholar]
- Kottgen A. et al. Multiple loci associated with indices of renal function and chronic kidney disease. Nat. Genet. 41, 712–717 (2009) . [DOI] [PMC free article] [PubMed] [Google Scholar]
- Chambers J. C. et al. Genetic loci influencing kidney function and chronic kidney disease. Nat. Genet. 42, 373–375 (2010) . [DOI] [PMC free article] [PubMed] [Google Scholar]
- Okada Y. et al. Meta-analysis identifies multiple loci associated with kidney function-related traits in east Asian populations. Nat. Genet. 44, 904–909 (2012) . [DOI] [PMC free article] [PubMed] [Google Scholar]
- Liu C. T. et al. Genetic association for renal traits among participants of African ancestry reveals new loci for renal function. PLoS Genet. 7, e1002264 (2011) . [DOI] [PMC free article] [PubMed] [Google Scholar]
- Boger C. A. et al. Association of eGFR-Related Loci Identified by GWAS with Incident CKD and ESRD. PLoS Genet. 7, e1002292 (2011) . [DOI] [PMC free article] [PubMed] [Google Scholar]
- Chasman D. I. et al. Integration of genome-wide association studies with biological knowledge identifies six novel genes related to kidney function. Hum. Mol. Genet. 21, 5329–5343 (2012) . [DOI] [PMC free article] [PubMed] [Google Scholar]
- Pattaro C. et al. A meta-analysis of genome-wide data from five European isolates reveals an association of COL22A1, SYT1, and GABRR2 with serum creatinine level. BMC Med. Genet. 11, 41 (2010) . [DOI] [PMC free article] [PubMed] [Google Scholar]
- Trudu M. et al. Common noncoding UMOD gene variants induce salt-sensitive hypertension and kidney damage by increasing uromodulin expression. Nat. Med. 19, 1655–1660 (2013) . [DOI] [PMC free article] [PubMed] [Google Scholar]
- International Consortium for Blood Pressure Genome-Wide Association Studies. et al. Genetic variants in novel pathways influence blood pressure and cardiovascular disease risk. Nature 478, 103–109 (2011) . [DOI] [PMC free article] [PubMed] [Google Scholar]
- Schunkert H. et al. Large-scale association analysis identifies 13 new susceptibility loci for coronary artery disease. Nat. Genet. 43, 333–338 (2011) . [DOI] [PMC free article] [PubMed] [Google Scholar]
- Vasan R. S. et al. Genetic variants associated with cardiac structure and function: a meta-analysis and replication of genome-wide association data. JAMA 302, 168–178 (2009) . [DOI] [PMC free article] [PubMed] [Google Scholar]
- Smith N. L. et al. Association of genome-wide variation with the risk of incident heart failure in adults of European and African ancestry: a prospective meta-analysis from the cohorts for heart and aging research in genomic epidemiology (CHARGE) consortium. Circ. Cardiovasc. Genet. 3, 256–266 (2010) . [DOI] [PMC free article] [PubMed] [Google Scholar]
- Dupuis J. et al. New genetic loci implicated in fasting glucose homeostasis and their impact on type 2 diabetes risk. Nat. Genet. 42, 105–116 (2010) . [DOI] [PMC free article] [PubMed] [Google Scholar]
- Morris A. P. Transethnic meta-analysis of genomewide association studies. Genet. Epidemiol. 35, 809–822 (2011) . [DOI] [PMC free article] [PubMed] [Google Scholar]
- Pers T. H. et al. Biological interpretation of genome-wide association studies using predicted gene functions. Nat. Commun. 6, 5890 (2015) . [DOI] [PMC free article] [PubMed] [Google Scholar]
- Trynka G. et al. Chromatin marks identify critical cell types for fine mapping complex trait variants. Nat. Genet. 45, 124–130 (2013) . [DOI] [PMC free article] [PubMed] [Google Scholar]
- Raychaudhuri S. et al. Identifying relationships among genomic disease regions: predicting genes at pathogenic SNP associations and rare deletions. PLoS Genet. 5, e1000534 (2009) . [DOI] [PMC free article] [PubMed] [Google Scholar]
- Panagiotou O. A., Willer C. J., Hirschhorn J. N. & Ioannidis J. P. The power of meta-analysis in genome-wide association studies. Annu. Rev. Genomics Hum. Genet. 14, 441–465 (2013) . [DOI] [PMC free article] [PubMed] [Google Scholar]
- Barker D. J. The fetal and infant origins of adult disease. BMJ 301, 1111 (1990) . [DOI] [PMC free article] [PubMed] [Google Scholar]
- Boubred F. et al. Developmental origins of chronic renal disease: an integrative hypothesis. Int. J. Nephrol. 2013, 346067 (2013) . [DOI] [PMC free article] [PubMed] [Google Scholar]
- Fox C. S. et al. Predictors of new-onset kidney disease in a community-based population. JAMA 291, 844–850 (2004) . [DOI] [PubMed] [Google Scholar]
- Coresh J. et al. Calibration and random variation of the serum creatinine assay as critical elements of using equations to estimate glomerular filtration rate. Am. J. Kidney Dis. 39, 920–929 (2002) . [DOI] [PubMed] [Google Scholar]
- Stevens L. A. et al. Estimating GFR using serum cystatin C alone and in combination with serum creatinine: a pooled analysis of 3,418 individuals with CKD. Am. J. Kidney Dis. 51, 395–406 (2008) . [DOI] [PMC free article] [PubMed] [Google Scholar]
- Fuchsberger C., Taliun D., Pramstaller P. P. & Pattaro C. CKDGen consortium. GWAtoolbox: an R package for fast quality control and handling of GWAS meta-analysis data. Bioinformatics 28, 444–445 (2012) . [DOI] [PubMed] [Google Scholar]
- Willer C. J., Li Y. & Abecasis G. R. METAL: fast and efficient meta-analysis of genomewide association scans. Bioinformatics 26, 2190–2191 (2010) . [DOI] [PMC free article] [PubMed] [Google Scholar]
- Devlin B. & Roeder K. Genomic control for association studies. Biometrics 55, 997–1004 (1999) . [DOI] [PubMed] [Google Scholar]
- Skol A. D., Scott L. J., Abecasis G. R. & Boehnke M. Joint analysis is more efficient than replication-based analysis for two-stage genome-wide association studies. Nat. Genet. 38, 209–213 (2006) . [DOI] [PubMed] [Google Scholar]
- Storey J. D. A direct approach to false discovery rates. J. R. Stat. Soc. B 64, 479–498 (2002) . [Google Scholar]
- Storey J. D., Taylor J. E. & Siegmund D. Strong control, conservative point estimation, and simultaneous conservative consistency of false discovery rates: a unified approach. J. R. Stat. Soc. B 66, 187–205 (2004) . [Google Scholar]
- Gauderman W. J. Sample size requirements for matched case-control studies of gene-environment interaction. Stat. Med. 21, 35–50 (2002) . [DOI] [PubMed] [Google Scholar]
- Rosner B. in Fundamentals of Biostatistics Thomson-Brooks/Cole, Duxbury (2006) . [Google Scholar]
- Welter D. et al. The NHGRI GWAS Catalog, a curated resource of SNP-trait associations. Nucleic Acids Res. 42, D1001–D1006 (2014) . [DOI] [PMC free article] [PubMed] [Google Scholar]
- Wang X. et al. Comparing methods for performing trans-ethnic meta-analysis of genome-wide association studies. Hum. Mol. Genet. 22, 2303–2311 (2013) . [DOI] [PubMed] [Google Scholar]
- Purcell S. et al. PLINK: a tool set for whole-genome association and population-based linkage analyses. Am. J. Hum. Genet. 81, 559–575 (2007) . [DOI] [PMC free article] [PubMed] [Google Scholar]
- International HapMap Consortium. The International HapMap Project. Nature 426, 789–796 (2003) . [DOI] [PubMed] [Google Scholar]
- Maurano M. T. et al. Systematic localization of common disease-associated variation in regulatory DNA. Science 337, 1190–1195 (2012) . [DOI] [PMC free article] [PubMed] [Google Scholar]
- ENCODE Project Consortium. et al. An integrated encyclopedia of DNA elements in the human genome. Nature 489, 57–74 (2012) . [DOI] [PMC free article] [PubMed] [Google Scholar]
- Ko Y. A. et al. Cytosine methylation changes in enhancer regions of core pro-fibrotic genes characterize kidney fibrosis development. Genome Biol. 14, R108 (2013) . [DOI] [PMC free article] [PubMed] [Google Scholar]
- Zhang Y. et al. Model-based analysis of ChIP-Seq (MACS). Genome Biol. 9, R137 (2008) . [DOI] [PMC free article] [PubMed] [Google Scholar]
- Shannon P. et al. Cytoscape: a software environment for integrated models of biomolecular interaction networks. Genome Res. 13, 2498–2504 (2003) . [DOI] [PMC free article] [PubMed] [Google Scholar]
Associated Data
This section collects any data citations, data availability statements, or supplementary materials included in this article.
Supplementary Materials
Supplementary Figures 1-7, Supplementary Tables 1-21, Supplementary Note 1 and Supplementary References