

Abstract
Racial/ethnic disparities in the prevalence of type 2 diabetes mellitus (T2DM) are well documented and until recently, research has focused almost exclusively on individual-based determinants as potential contributors to these disparities (health behaviors, biological/genetic factors, and individual-level sociodemographics). Research on the role of neighborhood characteristics in relation to racial/ethnic disparities in T2DM is very limited. Therefore, the aim of this research is to identify and estimate the contribution of specific aspects of neighborhoods that may be associated with racial/ethnic disparities in T2DM.
Data from the Boston Area Community Health III Survey (N = 2,764) was used in this study, which is a community-based random-sample survey of adults in Boston, Massachusetts from three racial/ethnic groups (Black, Hispanic, and White). We applied two-level random intercepts logistic regression to assess the associations between race/ethnicity, neighborhood characteristics (census tract socioeconomic status, racial composition, property and violent crime, open space, geographic proximity to grocery stores, convenience stores, and fast food, and neighborhood disorder) and prevalent T2DM (fasting glucose > 125 mg/dL, HbA1c ≥ 6.5%, or self-report of a T2DM diagnosis).
Black and Hispanic participants had 2.89 times and 1.48 times the odds of T2DM as White participants, respectively. Multilevel models indicated a significant between-neighborhood variance estimate of 0.943, providing evidence of neighborhood variation. Individual demographics (race/ethnicity, age and gender) explained 22.3% of the neighborhood variability in T2DM. The addition of neighborhood-level variables to the model had very little effect on the magnitude of the racial/ethnic disparities and on the between-neighborhood variability. For example, census tract poverty explained less than 1% and 6% of the excess odds of T2DM among Blacks and Hispanics and only 1.8% of the neighborhood variance in T2DM.
While the findings of this study overall suggest that neighborhood factors are not a major contributor to racial/ethnic disparities in T2DM, further research is needed including data from other geographic locations.
Keywords: Boston Massachusetts, Neighborhood research, Type 2 diabetes, Disparities, Race/ethnicity, Contextual research, Local environment, Multilevel modeling
1. Introduction
Racial/ethnic disparities in the prevalence and incidence of type 2 diabetes mellitus (T2DM) are an important public health problem in the United States (US) and worldwide. Disparities are defined here as differences in the incidence, prevalence, mortality, and burden of diseases and other adverse health conditions that exist among specific population groups such as racial/ethnic minorities. To illustrate, compared to White adults, the prevalence of diabetes is 77% higher among Black and 66% higher among Hispanic adults in the US (Centers for Disease Control and Prevention, 2011, 2009). Racial/ethnic disparities in diabetes are associated with poorer diabetes control (Kirk et al., 2006; Harris et al., 1999), greater diabetes-related complications (Lanting et al., 2005; Wong et al., 2002; Karter et al., 2002), higher rates of hospitalization (U.S. Department of Health), and increased health care costs (Economic costs of diabetes, 2008). Extensive research has been conducted on individual-level explanations for these disparities including: variations in lifestyles and behaviors, biological and genetic factors, family history and individual-level socio-demographic characteristics. However, this prevailing paradigm, which puts emphasis on the individual, fails to consider contextual factors (such as residential neighborhoods) which may in part explain existing disparities in T2DM.
The notion that where we live can influence our health is not new. The influence of neighborhood context on health has been the focus of an extensive body of research over the past decade. The worldwide increase in T2DM is largely attributed to increases in obesity (BMI ≥ 30 kg/m2), poor diet, and physical inactivity (American Diabetes Association, 2012; Chan et al., 1994; Colditz et al., 1990). There is an abundance of research linking neighborhood resources and precursors to/risk factors for T2DM (i.e. dietary patterns (Dubowitz et al., 2008; Corral et al., 2012; Larson et al., 2009), physical activity (Corral et al., 2012; Shishehbor et al., 2008), and body mass index/obesity (Corral et al., 2012; Larson et al., 2009; Casagrande et al., 2011; Auchincloss et al., 2008, 2007; Diez Roux et al., 2002)). However, to our knowledge, studies linking neighborhood characteristics directly with T2DM are limited (Cox et al., 2007; Schootman et al., 2007a; Auchincloss et al., 2009; Krishnan et al., 2010). Furthermore, few studies have focused on the local contextual environment as a fundamental contributor to racial/ethnic disparities in health—including T2DM. The emerging socio-ecological framework attempts to identify both individual and contextual characteristics that may amplify, or moderate, racial/ethnic disparities in health. Neighborhoods are a context in which disparities may be fostered as they possess both social and physical attributes which can affect the health of individuals.
1.1. Neighborhood deprivation and socioeconomic status
It has previously been suggested that most of the racial/ethnic variation in T2DM is explained by social and economic factors at the neighborhood-level (Cohen et al., 2006). Neighborhood socioeconomic status (SES) appears to be an important contributor to obesity (Laraia et al., 2001; Dubowitz et al., 2012; Ford and Dzewaltowski, 2011), cardiovascular disease risk factors (Diez-Roux et al., 1997; Chichlowska et al., 2008; Cubbin et al., 2001, 2006; Abeyta et al., 2012), metabolic syndrome among women (Chichlowska et al., 2008), as well as T2DM prevalence (Connolly et al., 2000) and incidence (Cox et al., 2007; Krishnan et al., 2010). The neighborhood socioeconomic environment can influence the availability of grocery stores, recreational facilities, and educational resources which may influence diet, physical activity and subsequent T2DM. In addition, economically deprived neighborhoods may increase exposure to chronic stress (i.e. noise, violence, and poverty) which is a known risk factor for negative health outcomes including T2DM (Anderson et al., 1997; Sundquist et al., 2006). These results suggest that neighborhood-level SES may modify the relationship between individual-level SES and negative health outcomes. This underscores the potential importance of accounting for indicators of neighborhood deprivation in studies examining health disparities (Laveist et al., 2011; Jones et al., 2013).
1.2. Racial composition
Contextual research on the local environment often fails to account for the fact that the US is largely racially segregated. Racial segregation, which refers to the physical separation of racial subgroups in space, is a byproduct of institutional discrimination and often affects the social, economic and health-related well-being of the segregated minority group (Massey, 1990; Subramanian et al., 2005). Racial and socioeconomic segregation are also considered to be a fundamental cause of racial/ethnic disparities in health outcomes (Williams and Collins, 2001; Massey and Denton, 1993). Racial segregation often perpetuates disparities in educational and employment opportunities, resulting in concentrated poverty, while shaping the social and physical contextual environment (Williams and Collins, 2001). These patterns of segregation are posited to influence obesity (Chang, 2006) and T2DM by shaping disparities in neighborhood environments. A few studies have examined the association between racial segregation and neighborhood amenities. While some studies have indicated that high levels of residential segregation are associated with obesogenetic characteristics (less access to healthy food options (Gordon et al., 2011; Galvez et al., 2008; Morland et al., 2002), greater access to unhealthy food (Powell et al., 2007), and less open spaces for recreational activities (Duncan et al., 2012a; Maroko et al., 2009)), other studies have found that spatial inequalities in racial/ethnic composition and socioeconomic disadvantage do not always result in disparate access to physical resources (Duncan et al., 2012b, 2013a).
1.3. Built environment
The term ‘built environment’ refers to the man-made surroundings of a neighborhood (e.g. density of fast food restaurants, distance to nearest park, and sidewalk completeness) that may or may not provide the setting for healthy behaviors, including healthy eating and physical activity. The domains and measures of the built environment used in scientific research vary considerably, in part, because of the large number of features that could potentially influence health behavior (Cradock et al., 2013). Some aspects of the built environment, such as access to grocery stores, convenience stores, and restaurants, are the focus of research because they are potentially modifiable (Zick et al., 2009). Access to supermarkets and grocery stores are positively associated with healthy food behaviors such as increased fruit and vegetable intake, more healthful diets, and lower BMI in a number of studies (Dubowitz et al., 2012; Morland et al., 2002, 2006; Morland and Evenson, 2009; Inagami et al., 2006; Hattori et al., 2013). On the other hand, a high density of fast food restaurants has been associated with detrimental effects on BMI (Dubowitz et al., 2012; Hattori et al., 2013; Maddock, 2004; Li et al., 2009; Inagami et al., 2009). Differential rates of local area food store type availability by neighborhood characteristics (i.e. neighborhood deprivation, racial composition) may contribute to the differential prevalence of obesity, and subsequent T2DM, by race/ethnicity (Diez-Roux et al., 1999; Cummins and Macintyre, 2006).
The distribution of parks and other “green spaces” e (i.e. walking/biking trails) are increasingly viewed as a target for policymakers and urban planners for promoting healthier, more active lifestyles in disadvantaged communities Proximity to parks has been linked to and increased frequency of and the intensity of physical activity (Mytton et al., 2012; Astell-Burt et al., 2013a), lower BMI (Coombes et al., 2010; Astell-Burt et al., 2013b), and lower risk of T2DM (Astell-Burt et al., 2013c). These health benefits are manifested even among people living in deprived neighborhoods (Mitchell and Popham, 2008). These findings indicate that increased access to parks and green space may potentially reduce obesity and T2DM disparities.
1.4. Crime/safety and neighborhood disorder
Racial/ethnic minorities, specifically African Americans and Hispanics, are more likely to live in neighborhoods with higher levels of social, physical and economic disorder, which include features such as crime, graffiti, lack of trust among neighbors, abandoned buildings, and concentrated poverty that contribute to social instability (Franzini et al., 2010; Bishaw, 2011). Residents of neighborhoods with high crime rates are less likely to walk and be physically active, particularly women and young children (Lovasi et al., 2009; Harrison et al., 2007; Gomez et al., 2004; Bennett et al., 2007). This physical inactivity likely contributes to greater risk for obesity and T2DM. There is also evidence that residents’ beliefs, or perceptions, about the safety of their neighborhood may influence their behavior thus influencing (or mediating) BMI and T2DM risk (Fish et al., 2010). There are several studies that demonstrate evidence for this mediating effect. In two studies, perceived neighborhood disorder mediated the associations between neighborhood disadvantage and self-rated health, physical function, adolescent obesity and several chronic conditions (Dulin-Keita et al., 2013; Ross and Mirowsky, 2001). Reports of physical disorder (abandoned buildings, vacant lots, graffiti, etc.) have been shown to partly mediate the association between racial isolation and BMI, while incident crime was not associated with BMI (Chang et al., 2009).
In summary, the influence of neighborhood context on diet, physical activity, and obesity has been the subject of considerable research over the past decade. However, few studies have examined the role of neighborhood characteristics as a fundamental contributor to racial/ethnic disparities in T2DM. Further, very little research has examined which specific aspects of neighborhoods influence these facets of health, including T2DM.
1.5. Research objective
Our research aims to fill two key gaps in the literature. First, we aim to quantify the contribution of neighborhood versus individual factors to racial/ethnic disparities in T2DM. In particular, we aim to assess whether neighborhood characteristics will explain a substantive proportion of the disparities in T2DM beyond the contribution of individual-level factors/mediators (i.e. individual-level socioeconomic status, diet, exercise, BMI). Second, we aim to identify specific aspects of neighborhoods that are associated with disparities in T2DM and measure their relative contributions to disparities. Specifically, we propose to examine the roles of five important contextual factors as potential mediators of racial/ethnic disparities: (1) neighborhood socioeconomic status, (2) racial composition, (3) built environment, (4) safety, and (5) neighborhood disorder.
2. Materials and methods
2.1. The Boston Community Health (BACH) Survey
The Boston Area Community Health Survey (BACH) is a longitudinal, community-based random sample survey of 5,502 residents (2,301 men, 3,201 women) aged 30–79 years from three racial/ethnic groups (Black, Hispanic, and White) in Boston, MA (Piccolo et al., 2014). BACH was initiated in 2002 and was conducted in participants’ homes approximately every 5 years, with a total of three surveys to date. The current analysis uses cross-sectional data from the third round conducted between 2010 and 2012. A total of 3,155 men and women participated in BACH III. Only participants who had a geocodable address (99.9%) and who resided in Boston proper at the third round were included in the analysis, leaving 2,764 subjects. Participants who moved out of Boston proper were more likely to be White (vs. Black), younger (<45), and of higher income (≥$50,000 vs. <$20,000). In all surveys, data were collected during a two-hour interview in English or Spanish, after written informed consent. The study was approved by New England Research Institutes’ Institutional Review Board.
2.2. Address geocoding
BACH III participants provided their house number, street name and nearest cross-street in addition to other geographic information (e.g. zip code). All addresses were preprocessed before geocoding to improve their quality. For example, addresses were crosschecked against previous reported addresses for misspelled street names. The ArcGIS 10.1 (ESRI, Redlands, CA) North America Geocode Service (ArcGIS Online) address locator was used to geocode participants’ addresses to the building level. Positional error for ArcGIS in comparison to aerial photography is on average 40 meters (Schootman et al., 2007b) and addresses with a match rate ≥80 have been found to be positionally accurate in a previous study (Duncan et al., 2011). All failures (match rate <80) were crosschecked with Google Maps to assist in remedying incorrect addresses. Geocoded residences were then used to link participants with 2010 US census tract-level data. BACH III participants were located within 155 of the 179 census tracts within Boston. We used census tracts as the primary measure of the contextual unit following conventions established in previous studies of neighborhoods and health (Kawachi and Berkman, 2003) including in Boston, (Duncan et al., 2012a, 2012b) Census tracts generally contain 2500–8000 people and when first delineated, were designed to be homogeneous with respect to population characteristics, economic status, and living conditions (U.S. Census Bureau, 2000). Neighborhood socioeconomic status, neighborhood racial composition, neighborhood recreational open space, and neighborhood crime were measured at the census tract level.
2.3. Neighborhood measures
2.3.1. Neighborhood socioeconomic status (SES)
Neighborhood SES was based on methods used by Diez-Roux (Diez-Roux et al., 2001). A composite index Z-score was created for census tract based on six measures including: log median household income; log median value of owner occupied housing; percent of households receiving interest, dividend or net rental income; percent of adults 25 and over with a high school degree; percent of adults 25 and over with a college degree; and percent of individuals ages 16 and over in management and professional occupations. An increasing score signifies increasing neighborhood socioeconomic advantage. Census tracts were designated as low, middle, or high SES according to the tertiles of the Z-score (Diez-Roux et al., 1997). Census tract poverty was categorized using standard categories: less than 5% poverty, 5–9.9% poverty, 10–19.9% poverty, and 20% or greater poverty (Krieger et al., 2002).
2.3.2. Neighborhood racial composition
The percentages of non-Hispanic Black, non-Hispanic White, and Hispanic residents in a census tract were used to measure racial composition (surrogates for residential segregation) and have been used in previous research (Duncan et al., 2012a; Franzini et al., 2010).
2.3.3. Recreational open space
The percentage of recreational open space per census tract was estimated from shapefiles obtained from the Massachusetts Office of Geographic Information (MassGIS) (Massachusetts Office of Geographic Information, 2013). This data layer of outdoor recreational facilities includes parks, playing fields, school fields, and playgrounds, whether privately or publicly owned.
2.3.4. Crime
Crime incident reports provided by the Boston Police Department were downloaded from the City of Boston website at https://data.cityofboston.gov/. Data were coded using conventions described by others (Yang et al., 2012). The property crime rates in 2010–2011 were calculated as the number of offenses of burglary, larceny, and motor vehicle theft per 1,000 population. Violent crime was calculated as murder, robbery, and assault (including sexual assault) per 1,000 population.
2.3.5. Food environment
Data on food establishments located in the Boston metro area were purchased from InfoUSA Inc, a proprietary information service. Food environment was operationalized as the distance to the closest grocery store, convenience store, and fast food restaurant from each participant’s residence (Moore and Diez Roux, 2006; Oreskovic et al., 2009).
2.3.6. Neighborhood disorder
Social and physical neighborhood order and disorder were measured using the “Perceived Neighborhood Disorder” scale developed by Ross and Mirowsky (1999). Social disorder refers to people hanging around on the streets, drug and alcohol use, trouble with neighbors, and a general perception of lack of safety. Physical disorder refers to graffiti, vandalism, abandoned buildings, cleanliness, and maintenance of homes and apartments. The physical and social disorder indices were created by reverse coding “order” items and summing the six items in each subscale with higher scores indicating greater perceived disorder (Ross and Mirowsky, 2009; Ross et al., 2001).
2.4. Individual factors
2.4.1. Race/ethnicity
Race/ethnicity was self-reported by survey participants according to two separate survey questions: “Do you consider yourself to be Spanish, Hispanic, or Latino (Latina)?” and “What do you consider yourself to be? Select one or more of the following” with response categories of American Indian or Alaska Native, Asian, Black or African American, Native Hawaiian or other Pacific Islander, White or Caucasian, and Other (Specify). These questions are the standard used in the US as recommended by the Office of Management and Budget (OMB, 1997). Consistent with our previous work (McKinlay and Link, 2007), the racial/ethnic categories used in this research are 1) non-Hispanic Black (Black), 2) Hispanic of any race (Hispanic), and 3) non-Hispanic White (White).
2.4.2. Socioeconomic status (SES)
The individual SES indicators considered were: self-reported household income, educational attainment, and occupation. Household income was collapsed into three categories of US dollars: <20,000,20–49,999, and ≥50,000. Education was categorized as less than high school, high school graduate or equivalent, some college, and college or advanced degree were combined due to smaller numbers. Current or former occupation was categorized into four groups: (1) management, professional, sales and office occupations; (2) service occupations; (3) manual labor which includes construction, maintenance, farming, production, and transportation occupations; and (4) never worked. We use the broader term ‘SES’ when referring to these three distinct socioeconomic factors in the aggregate, all of which have strongly been related to overall health (Lynch et al., 2000).
2.4.3. Lifestyle/behavioral factors
BMI was measured by trained field interviewers during an in-home visit. Physical activity was categorized as low, moderate, or high using the Physical Activity Scale for the Elderly (PASE) (Washburn and Ficker, 1999; Washburn et al., 1999,1993). Participants completed the Block 2005 food frequency questionnaire to assess dietary patterns (Willett et al., 1997, 1987). Diet was operationalized as indicator variables representing intake of vegetables, fruit, meat and grain servings per the USDA MyPyramid (USDA, 2008).
2.5. Type 2 diabetes (T2DM)
Trained field interviewers (phlebotomists) collected fasting blood samples in BACH III using a HemoCue 201 point-of-care analyzer. Self-reported diabetes status was identified by affirmative answers to the question, “Have you ever been told by a health care provider that you now have or previously had non-insulin dependent or adult-onset diabetes Type II?” The primary outcome for this study was operationalized as fasting glucose >125 mg/dL, HbA1c ≥ 6.5% or self-report of a diabetes diagnosis (American Diabetes Association, 2012).
2.6. Statistical methods
Descriptive statistics of the study population were calculated in SUDAAN 11 (Research Triangle Park, North Carolina). ArcGIS 10.1 (ESRI, Redlands, CA) was used to geocode participants’ addresses, measure distances, link individual to contextual data, and visually inspect the data for potential spatial patterns. We assessed the presence of overall spatial dependence in diabetes with the Global Moran’s I statistic, a common test statistic for spatial autocorrelation, using the k nearest neighbor (KNN) method.
We applied two-level random intercepts logistic regression to assess the associations between individual-level race/ethnicity, neighborhood characteristics and T2DM. Multilevel regression methods accommodate clustering of participant observations within their census tract of residence. Multilevel models were constructed in steps of increasing complexity. First, an intercept-only model was constructed to quantify the between neighborhood variance ( σ2B) of the outcome and to test for significant variation in T2DM by neighborhood. A pseudo intra-class correlation coefficient (ICC) was computed using the latent variable approach to approximate the ICC for a binary outcome, where the within-neighborhood variance for a standard logistic regression is π2/3. The ICC roughly quantifies the amount of variability in T2DM attributable to the neighborhood level relative to the sum of within (σ 2W = π2/3) and between neighborhood variances ( σ2BW) (i.e. total variability) (ICC = [σ2B/(π2/3 + σ2B)]) (Wu et al., 2012).
Next, multilevel random intercepts models were constructed, with individual-level predictors modeled as fixed effects, to examine the influence of neighborhood characteristics on racial/ ethnic disparities in T2DM. We first included exogenous demographic variables (race/ethnicity, gender, and age), and then individual-level socioeconomic factors, both are hypothesized to influence neighborhood of residence and therefore neighborhood exposures. Next, lifestyle factors, hypothesized to be influenced by neighborhood exposures and to be potential mediators, were added to the model. Finally, individual- and neighborhood-level contextual factors were added to the demographic and socioeconomic adjusted random intercepts models. At each step two metrics were evaluated. First, the magnitude of the racial/ethnic disparities (ORs) were evaluated to determine the contribution of the individual- and neighborhood-factors to racial/ethnic disparities in the prevalence of T2DM. Comparing these ORs allowed us to evaluate whether individual- and/or neighborhood-level factors mediate or “explain” a proportion of the racial/ethnic disparities in T2DM (Baron and Kenny, 1986; Vanderweele and Vansteelandt, 2010). Second, the proportion of neighborhood variability in T2DM that was explained by the model was calculated to determine whether neighborhood variation persisted after accounting for these factors. Next, a parsimonious multilevel model was constructed by first including all variables marginally associated (p < 0.20) with T2DM in bivariate analyses. The model was then purposefully reduced to all individual- and neighborhood-level factors either: 1) proving to have a confounding or mediating effect on the main determinant (race/ethnicity) outcome (T2DM) relationship (>10%); or 2) were marginally significant in bivariates with the outcome (T2DM) (p < 0.20). All multilevel models were estimated using Mplus Version 7 (Muthen and Muthen, Los Angeles, CA). Residuals from the final regression model were tested using the Global Moran’s I for evidence of spatial autocorrelation.
In order to minimize reductions in precision, multiple imputation was implemented using the Multivariate Imputation by Chained Equations (MICE) (van Buuren and Groothuis-Oudshoorn, 2011) algorithm in R (R Foundation, 2012). Fifteen multiple imputation datasets were created. Imputations were conducted separately for each racial/ethnic group by gender combination to preserve interaction effects, and the complex survey sample design was taken into account. Seventeen percent of participants were missing household income and 21% were missing dietary data. The proportion of missing data on other covariates was low with 9% having ambiguous diabetes status and less than 1% missing education, occupation, or weight. BACH’s sampling design requires weighting observations inversely proportional to their probability of selection for results to be generalizable to the base population (Cochran, 1977; Heeringa et al., 2010). Sampling weights were post-stratified in order to produce estimates representative of the Black, Hispanic, and White population of Boston, MA between the ages of 34 and 88 years (based on the 2010 US Census).
3. Results
The study population consisted of 2,764 BACH III participants (33.6% Black, 33.9% Hispanic, 32.5% White) living in 155 census tracts. The average age of participants was 55.9 years. Sample characteristics by race/ethnicity are shown in Table 1. Black and Hispanic participants tended to have lower incomes, less education, and live in neighborhoods (census tracts) with lower SES and higher poverty. Black participants tended to live in high minority neighborhoods; 54.9% lived in neighborhoods where >75% of residents were non-White and 39.7% lived in neighborhoods where 25–75% of residents were non-White (Table 1 and Fig. 1). Hispanic participants were more likely to live in mixed-race (25–75% non-White) neighborhoods (57.2%), followed by high (>75% non-White) minority neighborhoods (34.7%). White participants tended to live in mixed-race (25–75% non-White, 49.3%) or low minority (<25% non-White, 48.0%) neighborhoods (p < 0.001).
Table 1.
Characteristics of the BACH III study population overall by race/ethnicity (N = 2,764).
| Overall N = 2764 | Black N = 929 | Hispanic N = 937 | White N = 898 | |
|---|---|---|---|---|
| Individual characteristics | ||||
| Age (continuous)a | 55.89 (0.53) | 53.99 (0.69) | 50.58 (0.59) | 57.80 (0.74) |
| Age (categorical)b | ||||
| 34–44 | 406 (29.85) | 138 (33.88) | 171 (44.93) | 97 (24.47) |
| 45–54 | 741 (26.23) | 286 (27.25) | 262 (28.31) | 193 (25.26) |
| 55–64 | 813 (19.09) | 261 (20.03) | 281 (14.88) | 271 (19.55) |
| 65–74 | 536 (13.97) | 165 (12.08) | 161 (8.28) | 210 (16.19) |
| 75–88 | 272 (10.86) | 81 (6.77) | 63 (3.60) | 128 (14.53) |
| Gender, % Male | 1019 (44.57) | 327 (40.96) | 318 (45.39) | 374 (46.19) |
| BMI (continuous)b | 29.64 (0.23) | 31.26 (0.41) | 29.96 (0.31) | 28.75 (0.29) |
| BMI (categorical) | ||||
| Normal | 551 (24.33) | 168 (18.76) | 137 (16.99) | 246 (28.75) |
| Overweight | 934 (34.64) | 295 (31.36) | 338 (38.74) | 301 (35.37) |
| Obese | 1283 (41.03) | 468 (49.88) | 463 (44.26) | 352 (35.88) |
| Diet | ||||
| 3–4 Vegetable servings | 277 (11.83) | 114 (10.98) | 46 (4.19) | 116 (13.96) |
| 2–3 Fruit servings | 382 (17.90) | 126 (12.67) | 90 (12.76) | 166 (21.66) |
| 2–3 Meat servings | 590 (22.41) | 177 (20.59) | 209 (22.87) | 205 (23.22) |
| 6–11 Grain servings | 401 (18.15) | 115 (12.61) | 117 (16.80) | 169 (21.22) |
| Physical activity | ||||
| Low | 1132 (34.67) | 378 (33.63) | 399 (33.03) | 355 (35.56) |
| Medium | 1288 (50.16) | 417 (48.47) | 432 (51.25) | 439 (50.76) |
| High | 348 (15.17) | 136 (17.90) | 107 (15.72) | 105 (13.68) |
| Income | ||||
| <$20,000 | 1234 (30.50) | 389 (36.26) | 581 (47.34) | 265 (23.86) |
| $20,000–$49,999 | 801 (26.62) | 321 (34.90) | 271 (35.64) | 209 (20.46) |
| ≥$50,000 | 733 (42.87) | 221 (28.83) | 87 (17.01) | 425 (55.68) |
| Education | ||||
| Less than high school | 560 (8.73) | 146 (11.06) | 363 (30.40) | 51 (2.73) |
| High school or equivalent | 867 (27.11) | 348 (38.15) | 318 (39.60) | 201 (18.79) |
| Some college | 579 (20.63) | 258 (30.86) | 151 (15.79) | 170 (16.58) |
| College or advanced degree | 762 (43.53) | 179 (19.92) | 106 (14.21) | 477 (61.90) |
| Occupation | ||||
| Professional, managerial, sales, and office | 1328 (63.10) | 473 (54.78) | 227 (31.61) | 628 (74.29) |
| Service | 715 (18.85) | 246 (24.46) | 338 (31.95) | 131 (13.12) |
| Manual labor | 495 (13.92) | 180 (17.48) | 206 (21.85) | 109 (10.36) |
| Never worked | 229 (4.13) | 32 (3.28) | 166 (14.58) | 31 (2.23) |
| Census tract (CT) characteristics | ||||
| Number of census tracts | 155 | 111 | 115 | 126 |
| CT SES | ||||
| Low | 962 (21.57) | 448 (43.31) | 373 (37.83) | 141 (7.05) |
| Middle | 1192 (44.95) | 393 (45.51) | 415 (44.89) | 384 (44.68) |
| High | 614 (33.48) | 90 (11.18) | 150 (17.28) | 374 (48.27) |
| CT poverty | ||||
| <5% | 160 (9.57) | 11 (0.79) | 18 (1.61) | 131 (15.76) |
| 5–9.9% | 280 (13.21) | 37 (3.43) | 81 (6.24) | 162 (19.68) |
| 10–19.9% | 792 (35.55) | 240 (31.36) | 216 (28.02) | 336 (39.34) |
| ≥20% | 1535 (41.66) | 643 (64.42) | 623 (64.13) | 269 (25.22) |
| CT racial composition, continuous | ||||
| % Black | 28.03 (1.14) | 51.98 (1.89) | 36.23 (2.04) | 14.19 (0.98) |
| % Hispanic | 16.62 (0.53) | 19.71 (0.76) | 25.89 (1.02) | 13.38 (0.62) |
| % White | 52.11 (1.30) | 26.80 (1.69) | 37.90 (1.89) | 67.98 (1.36) |
| CT racial composition, categorical | ||||
| > 75% non-White | 863 (20.75) | 531 (54.93) | 299 (34.72) | 33 (2.70) |
| 25–75% non-White | 1439 (47.67) | 357 (39.67) | 564 (57.15) | 518 (49.34) |
| < 25% non-White | 462 (31.57) | 41 (5.40) | 74 (8.14) | 347 (47.97) |
| Property crime per 1,000 | 6.35 (0.29) | 7.22 (0.24) | 7.44 (0.55) | 5.67 (0.42) |
| Violent crime per 1,000 | 74.75 (3.18) | 94.49 (3.31) | 91.55 (5.90) | 61.10 (4.46) |
| Built environment average distance to closest, in miles | ||||
| Grocery store | 0.30 (0.01) | 0.30 (0.01) | 0.26 (0.01) | 0.31 (0.02) |
| Convenience store | 0.23 (0.01) | 0.23 (0.01) | 0.20 (0.01) | 0.24 (0.01) |
| Fast food | 0.42 (0.02) | 0.44 (0.01) | 0.40 (0.02) | 0.42 (0.02) |
| CT % open space, continuous | 0.08 (0.01) | 0.06 (0.01) | 0.07 (0.01) | 0.09 (0.01) |
| CT open space, categorical | ||||
| ≤ 5% | 1393 (47.95) | 518 (58.36) | 501 (55.80) | 374 (41.73) |
| 5.1–10% | 686 (26.66) | 198 (20.46) | 229 (22.02) | 259 (30.36) |
| 10.1–20% | 440 (16.07) | 146 (14.45) | 141 (15.28) | 153 (16.96) |
| > 20% | 245 (9.32) | 67 (6.74) | 66 (6.90) | 112 (10.96) |
| Physical disorder | 13.67 (0.14) | 14.27 (0.22) | 14.52 (0.24) | 13.18 (0.20) |
| Social disorder | 14.07 (0.16) | 15.50 (0.26) | 15.36 (0.29) | 13.06 (0.21) |
CT = census tract.
Mean and standard error presented for continuous variables.
n and column percent presented for categorical variables.
Fig. 1.
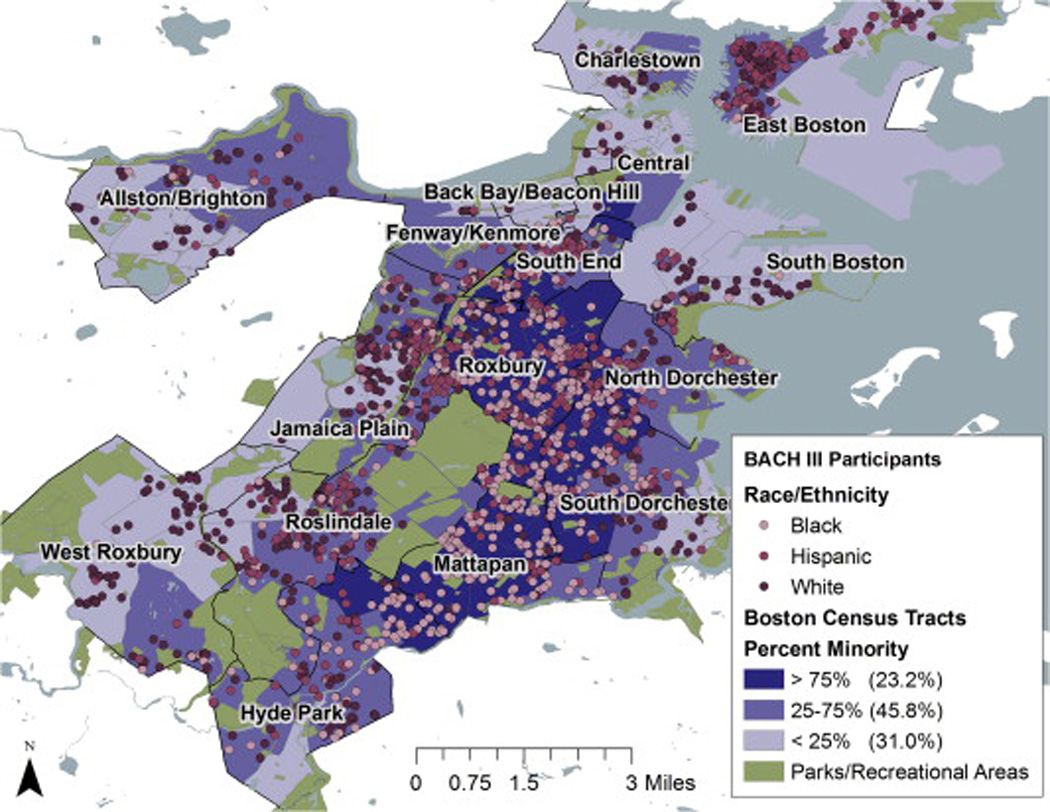
Boston Area Community Health (BACH) III Survey participants by race/ethnicity by the racial composition of census tracts in Boston, MA.
Overall, 892 (22.8%) of participants had diabetes (64.9% diagnosed, 35.1% undiagnosed). Black (33.3%) and Hispanic (23.5%) participants were more likely to have diabetes than White participants (18.0%, p < 0.001). The prevalence of diabetes was higher among individuals with lower income (p < 0.001), less education (p < 0.001), and with non-professional occupations (p < 0.001, bivariate results not shown). Diabetes was more prevalent among individuals living in low (34.1%) or middle (40.7%) SES neighborhoods (p = 0.002), high poverty neighborhoods (48.0% among participants living in neighborhoods with ≥20% of residents living in poverty, p = 0.02), and greater minority populations (p = 0.003). Participants with diabetes were more likely to perceive their neighborhood as socially disordered (i.e. people hanging around on the streets, drug and alcohol use, trouble with neighbors, and a perception of lack of safety, p = 0.003).
There appeared to be a spatial pattern in the distribution of T2DM (Fig. 2, map a). This was confirmed statistically via the Global Moran’s I statistic (I = 0.09, p = 0.03). Fig. 2, maps b–d, demonstrate the patterning of SES, poverty and percentage of White in Boston measured at the census tract level. The Global Moran’s I statistic evaluating spatial autocorrelation in the ordinary multilevel model of census tract-level poverty on T2DM, however, indicated no significant positive autocorrelation (I = 0.003, p = 0.77). Therefore analyses proceeded using ordinary multilevel models as opposed to spatial autoregressive models. Multilevel models indicated a significant between-neighborhood variance estimate of σ2B = 0.943, providing evidence of geographic variation in T2DM (Table 2). The ICC indicated that 22.3% of the total variability in T2DM is due to variation between neighborhoods, while the remainder of the variation in T2DM is due to variation within neighborhoods (i.e. individual variation). With the addition of individual-level demographic variables (Model 1: race/ethnicity—our primary determinant of interest-age, and gender) to the model, between-neighborhood variance (σ2B) persisted but was reduced by 22.3% [(0.943 – 0.733)/0.943 × 100%]. In other words, the composition of the neighborhood (i.e. clustering of demographic characteristics by neighborhood) explained 22.3% of the neighborhood variability in T2DM. Racial/ethnic disparities in T2DM were large, with Black participants having 2.89 times the odds of having T2DM as White participants (95% CI: 1.20–3.97) and Hispanic participants having 1.48 times the odds (95% CI: 1.91 – 3.51). With the addition of individual-level socioeconomic factors (Model 2), neighborhood variation in T2DM was further reduced so that nearly 31.9% of the between-neighborhood variability was explained by these factors. The excess odds of diabetes among Black participants was reduced by 34.4%, and the excess odds among Hispanic participants by 69.8%, with the introduction of individual socioeconomic factors (ORBlack vs. White = 2.24, 95% CI: 1.61–3.13; ORHispanic vs. White = 1.48, 95% CI: 1.03–2.12). Further inclusion of all individual lifestyle factors marginally associated with T2DM (physical activity, grains servings, and BMI) had little impact on between-neighborhood variability in T2DM or the magnitude of the racial/ethnic disparities (Table 2, Models 3 and 4). The addition of neighborhood-level variables to the model had very little effect on the magnitude of the racial/ethnic disparities and on the between-neighborhood variability (Models 5–10). For example, the addition of census tract poverty (Model 5) explained less than 1% of the excess odds of T2DM among Blacks and 6% of the excess odds among Hispanics and explained only 1.8% of the neighborhood variance in T2DM.
Fig. 2.
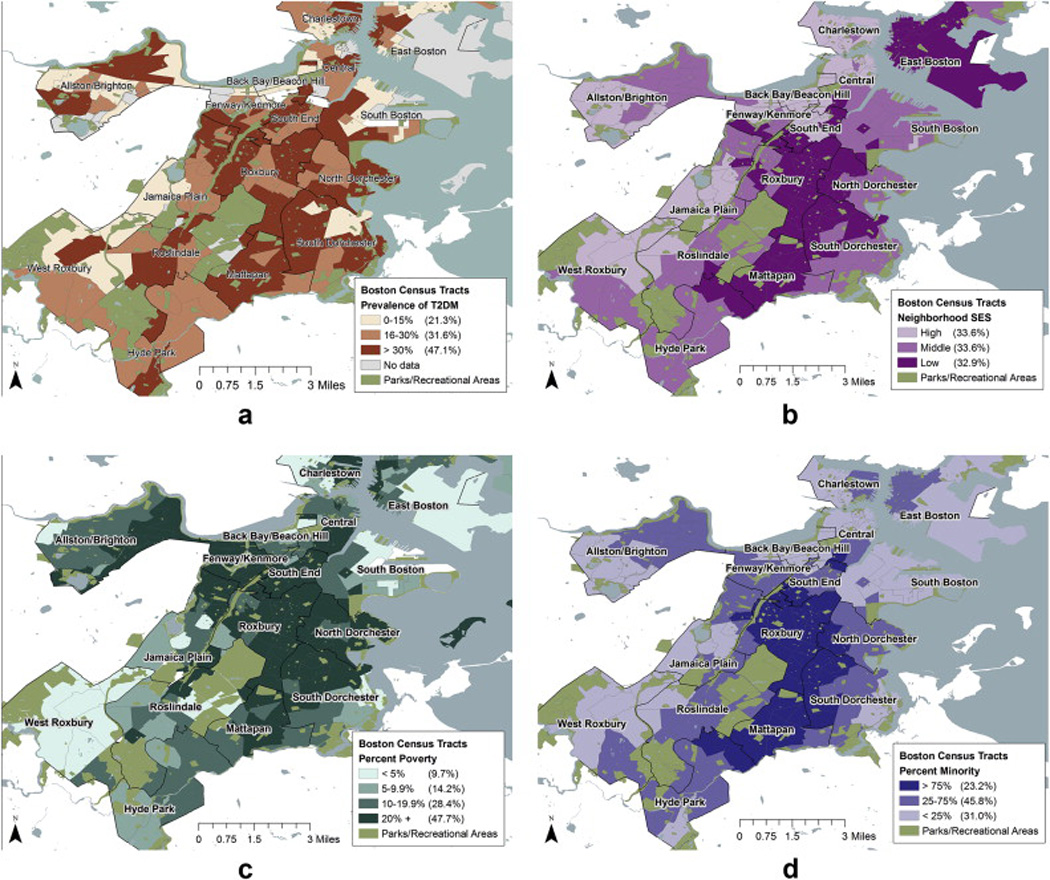
a. The distribution of T2DM prevalence in Boston, MA as measured by the BACH Survey. b. The distribution of socioeconomic status by census tracts in Boston, MA. c. The distribution of poverty by census tracts in Boston, MA d. The racial composition of census tracts in Boston, MA.
Table 2.
Within and between neighborhood variance estimates from null and adjusted multilevel models of diabetes from the Boston Area Community Health Survey.
| OR (95% CI) Black vs. White OR (95% CI) Hispanic vs. White % of neighborhood variance explained ICCa | |||||
|---|---|---|---|---|---|
| Null model (intercept only) | 0.943 | – | 0.223 | ||
| Random intercept models (individual-level variables only) | |||||
| Model 1: Race/ethnicity, Age, Gender | 2.89 (1.20–3.97) | 2.59 (1.91–3.51) | 0.733 | 22.3 | 0.182 |
| Model 2: Model 1 + Socioeconomic factors | 2.24 (1.61–3.13) | 1.48 (1.03–2.12) | 0.642 | 31.9 | 0.163 |
| Model 3: Model 2 + BMI | 2.33 (1.66–3.29) | 1.74 (1.20–2.52) | 0.652 | 30.9 | 0.165 |
| Model 4: Model 3 + Grains, physical activity | 2.30 (1.63–3.24) | 1.57 (1.08–2.28) | 0.650 | 31.1 | 0.165 |
| Random intercept models (contextual variables) | |||||
| Model 5: Model 2 + CT Poverty | 2.23 (1.57–3.16) | 1.45 (1.00–2.10) | 0.625 | 33.7 | 0.160 |
| Model 6: Model 2 + % Black | 2.31 (1.58–3.39) | 1.50 (1.04–2.16) | 0.641 | 32.0 | 0.163 |
| Model 7: Model 2 + Violent and Property Crime | 2.22 (1.58–3.12) | 1.47 (1.02–2.11) | 0.642 | 31.9 | 0.163 |
| Model 8: Model 2 + Built Environment (Distances) | 2.26 (1.62–3.16) | 1.47 (1.02–2.10) | 0.628 | 33.4 | 0.160 |
| Model 9: Model 2 + Open Space | 2.24 (1.61–3.13) | 1.48 (1.03–2.12) | 0.639 | 32.2 | 0.163 |
| Model 10: Model 2 + Disorder (Physical and Social) | 2.23 (1.60–3.12) | 1.47 (1.02–2.11) | 0.642 | 31.9 | 0.163 |
Latent variable approach to approximate ICC for a binary outcome; within neighborhood variance for a standard logistic regression is π2/3.
Table 3 shows the most parsimonious model for racial/ethnic disparities in T2DM and includes all variables with either an influence on the magnitude of the racial/ethnic disparities or that were independently associated with T2DM. In this model, the between-neighborhood variability ( σ2B) was reduced to 0.614. While this still involved a significant between-neighborhood variance (p = 0.002), the compositional (race/ethnicity, gender, age, income, education, physical activity, and BMI) and contextual (proximity to grocery stores, and census tract poverty) variables included in this model explained 34.9% of the between-neighborhood variance in T2DM [(0.943 – 0.614)/0.943 × 100%]. Only two contextual factors had marginally significant (p < 0.20) associations with prevalent T2DM: (1) the distance to the nearest grocery store for each participant and (2) census tract poverty. Participants living one mile further from a grocery store had approximately half the odds of having T2DM though this result was not statistically significant (OR = 0.53; 95% CI: 0.25–1.15). Participants living in lower poverty census tracts (<5%, 10–20%) had lower odds of T2DM but again this finding was not statistically significant (OR10–19.9% vs. ≥20% = 0.79; 95% CI: 0.59–1.06).
Table 3.
Full multilevel model, (p = 0.002).
| Full model |
||
|---|---|---|
| OR | 95% CI | |
| Demographics | ||
| Race | ||
| Black vs. White | 2.34 | 1.64–3.34 |
| Hispanic vs. White | 1.54 | 1.07–2.21 |
| Male vs. female | 1.68 | 1.31–2.15 |
| Age | 1.04 | 1.03–1.05 |
| SES | ||
| Income | ||
| <$20,000 vs. ≥$50,000 | 1.77 | 1.21–2.58 |
| $20,000-$49,999 vs. ≥$50,000 | 1.18 | 0.81 – 1.72 |
| Education | ||
| Less than high school vs. college or advanced degree | 2.09 | 1.37–3.19 |
| High school or equivalent vs. college or advanced degree | 1.4 | 0.96–2.04 |
| Some college vs. college or advanced degree | 1.21 | 0.82–1.78 |
| Lifestyle | ||
| Physical activity | ||
| Low vs. medium or high | 1.37 | 1.06–1.78 |
| BMI | ||
| Overweight vs. normal | 1.81 | 1.24–2.63 |
| Obese vs. normal | 4.18 | 2.89–6.04 |
| Contextual factors | ||
| Distance to nearest grocery store (miles) | 0.53 | 0.25–1.15 |
| CT poverty | ||
| <5% vs. ≥20% | 0.92 | 0.49–1.71 |
| 5–9.9% vs. ≥20% | 1.32 | 0.88–1.96 |
| 10–19.9% vs. ≥ 20% | 0.79 | 0.59–1.06 |
Bold = significant at the 0.05 level.
4. Conclusions
Racial and ethnic disparities in T2DM remain a major public health problem. While many studies investigating the potential causes for these disparities have focused on variations in individual lifestyles and behaviors, genetics, and/or individual-level socio-demographic factors, we examined the added influence of neighborhood-level factors. We found that there was a large variation in the prevalence of T2DM by neighborhood that could not be explained by the composition of the neighborhood (i.e. individual-level factors). We also sought to identify specific aspects of neighborhoods that were associated with variability in T2DM by race/ ethnicity. However, despite the comprehensive list of contextual variables amassed in this study (built environment, neighborhood socioeconomics, racial composition, safety, and neighborhood disorder), we were unable to identify contextual elements that could explain the racial/ethnic disparities in T2DM nor the neighborhood variability present in this study. While bivariate associations indicated that neighborhood socioeconomic factors (SES, poverty), racial composition, and social disorder were associated with higher odds of T2DM, these factors explained neither the racial/ethnic differences, nor the between-neighborhood variance, in T2DM in multilevel models.
Our finding that there was significant neighborhood variability in T2DM is consistent with results reported by others (Astell-Burt et al., 2013c). However, the extent to which this variability is explained by the contextual factors under consideration varies with the outcome of interest, the specific contextual measures included, the population examined, and the analytic techniques used. All of the contextual factors included in this study have been found to be associated with precursors to T2DM (dietary patterns (Dubowitz et al., 2008; Corral et al., 2012; Larson et al., 2009), physical activity (Corral et al., 2012; Shishehbor et al., 2008), or body mass index/ obesity (Corral et al., 2012; Larson et al., 2009; Casagrande et al., 2011; Auchincloss et al., 2008, 2007; Diez Roux et al., 2002)) in previous studies. However, T2DM is a more distal biological manifestation of residential conditions than behavioral and BMI outcomes. This indirect relationship may be one potential explanation for the null findings of this particular study. It is worth noting that several studies have successfully made the link between neighborhood socioeconomic factors like unemployment (Muller et al., 2013), economic disadvantage (Krishnan et al., 2010; Freedman et al., 2011), and racial segregation (Laveist et al., 2011; Jones et al., 2013; LaVeist et al., 2009) and T2DM. Astell-Burt found that individuals residing in neighborhoods with greater green space had lower odds of having T2DM (Astell-Burt et al., 2013c) and lower insulin resistance (Hsieh et al., 2014). Therefore, the mixed results to date may largely result from the specific contextual factors measured and from the specific locales and populations examined.
There are several potential explanations for our negative findings with regards to contextual factors. First, despite our attempts to address a comprehensive list of neighborhood factors, it is possible we may be missing a key contextual factor that would explain the large between neighborhood variability in T2DM. For example, we did not include a direct measure of neighborhood “walkability,” but rather measured individuals’ distances to specific features of their neighborhoods thought to influence conduciveness to walking and linked this data to individual physical activity. Comprehensive measures of neighborhood walkability have been linked to physical activity and body mass index (Duncan, 2013; Hirsch et al., 2013), and thus could be an area for future type 2 diabetes research. Second, we recognize that we examined only one neighborhood context, neighborhood of residence. People experience and interact with multiple neighborhood environments each day, known as spatial polygamy, which can influence their health and health behavior (Matthews, 2011). Most notably people’s work environment may influence their dietary and physical activity behaviors (Hoehner et al., 2013), thus influencing their risk of T2DM. Third, it is important to note that the contextual characteristics measured here are shaped by the macroeconomic forces of the larger community. The degree of economic or racial segregation of the larger community may contribute to scant variation at smaller units. Boston has previously ranked as one of the most residentially segregated metropolitan areas in the US. The racial segregation index of Boston is 67.7 (Logan and Stults, 2011) (a score of 60 and above is considered to be a high degree of segregation). Despite Boston being a segregated city, we found variation in individual versus neighborhood racial composition. Therefore, we believe it is reasonable to expect co-variation between neighborhood racial composition in relation to T2DM. Previous studies conducted in Boston found similarly high levels of residential segregation (Duncan et al., 2012b) but not necessarily segregation in the built environment (Duncan et al., 2012b).
The heterogeneous findings across the literature may be attributable to differences in the contextual measures examined and differences in the way constructs were evaluated (e.g. distance to versus density of), but it is also possible that the patterning of neighborhood social and physical attributes may be locale-specific. For example, in a study that examined the density of supermarkets, retail areas, recreational facilities, and health opportunities across three US cities, neighborhood racial/ethnic composition was significantly associated with access to facilities in both New York, NY and Baltimore, MD, but not in Winston-Salem, NC (Smiley et al., 2010). The macro-economic influences of living in this urban, northeast environment may not be generalizable to other contexts or to the conditions in which racial/ethnic disparities in T2DM are fostered in the US at large. Nonetheless, the BACH cohort has been compared to other large regionally (Behavioral Risk Factor Surveillance System), and nationally (National Health and Nutrition Examination Survey) representative samples and has been shown to have a similar chronic disease profile to these survey populations with the exception of the exclusion of Asians (Asians comprise approximately 7.5% of the Boston, Massachusetts population) (McKinlay and Link, 2007).
A notable limitation of this study is the cross-sectional nature of the analyses which prevent causal inferences and limit our ability to determine temporality. While US Census data were available for previous rounds of the BACH Survey, a unique strength of the BACH III Survey was the inclusion of contextual data from a variety of sources such as InfoUSA (food environment), the Boston Police Department (crime data), and participants’ perceptions (physical and social disorder). Another advantage to using the BACH III data was that on-the-spot diabetes testing was conducted (this was not done in any other BACH study) allowing us to examine both diagnosed and undiagnosed diabetes which may more accurately depict the true nature of racial/ethnic disparities in T2DM. Finally, BACH III participants had lived at their current address, on average, for over 15 years (Mean = 15.5, SE = 0.5) and over 80% of participants lived in the same neighborhood for all three rounds of the BACH Survey. These findings may mitigate concerns regarding the temporality between neighborhood exposure and diabetes onset.
It may be argued our results are influenced by the analytic approach. Exploratory analyses using the residuals from the census tract poverty-T2DM regression indicated no spatial autocorrelation. Therefore, we did not employ spatial modeling techniques. In addition, the modeling strategy presented here allowed individual-level variables to enter the model first to test the contribution of compositional factors. However, we also built the models introducing neighborhood-level contextual variables first and the results were the same. In addition, the modifiable areal unit problem (MAUP) is an issue. However, we note that the neighborhood definitions used in the current study are common in the social epidemiology of neighborhoods literature.
Finally, residential selection bias is a well-known limitation of many investigations of neighborhood effects (Hedman et al., 2012). Neighborhood selection is the result of residential mobility choices made by individuals and households within a restricted set of choices that can produce residential segregation patterns. To reduce the potential for bias relating to residential selection, we adjusted for variables that may be associated with neighborhood selection (e.g. individual income, education, and occupation). We recognize that this is a crude method to account for selection into neighborhoods (Duncan et al., 2013b; Lovasi et al., 2012), but unfortunately there was not a variable in our dataset for neighborhood selection. Finally, it is important to note that results from this study might only be generalizable to adults in similar urban locations to Boston.
There are a number of strengths to this study and the analytic approaches used here. Features of BACH that make it uniquely suitable for this investigation include: large diverse random sample of community-dwelling men and women; the utilization of established survey instruments; the collection of fasting blood samples at BACH III that allowed us to examine both diagnosed and undiagnosed T2DM; and collection of neighborhood measures from a wide variety of sources including the US Census Bureau, InfoUSA, as well as the individual participants’ perceptions of their neighborhood.
We attempted to compile a list of compositional and contextual factors representative of both the physical (food store availability, green space) and social (socioeconomics, racial composition, safety) environments in which individuals live. While many studies of neighborhood effects rely solely on objective assessments of neighborhood, we included residents’ subjective characterization of their neighborhood using a psychometrically validated scale (Ross and Mirowsky, 1999). In addition, the racial/ethnic diversity of our sample allowed us to examine the impact of neighborhood characteristics on disparities, an understudied potential impact of the contextual environment.
In conclusion, using data from the BACH Survey, we have identified large, significant, neighborhood variability in the prevalence of T2DM. However, the many neighborhood factors we were able to examine did not explain this neighborhood variability, nor did they appear to play a role in the amplification or creation of racial/ethnic disparities in T2DM. While the findings of this study overall suggest that neighborhood factors are not a major contributor to racial/ethnic disparities in T2DM, there is a need for further research including data from other geographic locations, capturing both urban and rural areas and locations with both high and low residential segregation.
Highlights.
There are large racial/ethnic disparities in type 2 diabetes mellitus (T2DM).
Neighborhood factors may play a role in racial/ethnic disparities in T2DM.
There is substantial neighborhood variability in the prevalence of T2DM.
Racial/ethnic disparities in T2DM remain largely unexplained.
References
- Abeyta IM, Tuitt NR, Byers TE, Sauaia A. Effect of community affluence on the association between individual socioeconomic status and cardiovascular disease risk factors, Colorado, 2007–2008. Prev. Chronic Dis. 2012;9:E115. doi: 10.5888/pcd9.110305. [DOI] [PMC free article] [PubMed] [Google Scholar]
- American Diabetes Association. Standards of medical care in diabetes–2012. Diabetes Care. 2012 Jan;35(Suppl. 1):S11–S63. doi: 10.2337/dc12-s011. [DOI] [PMC free article] [PubMed] [Google Scholar]
- Anderson RT, Sorlie P, Backlund E, Johnson N, Kaplan GA. Epidemiology. 1. Vol. 8. Cambridge, Mass: 1997. Jan, Mortality effects of community socioeconomic status; pp. 42–47. [DOI] [PubMed] [Google Scholar]
- Astell-Burt T, Feng X, Kolt GS. Green space is associated with walking and moderate-to-vigorous physical activity (MVPA) in middle-to-older-aged adults: findings from 203 883 Australians in the 45 and up Study. Br. J. Sports Med. 2013a Apr 30; doi: 10.1136/bjsports-2012-092006. [DOI] [PubMed] [Google Scholar]
- Astell-Burt T, Feng X, Kolt GS. Greener neighborhoods, slimmer people? Evidence from 246 920 Australians. Int. J. Obes. 2013b May 3;(2005) doi: 10.1038/ijo.2013.64. [DOI] [PubMed] [Google Scholar]
- Astell-Burt T, Feng X, Kolt GS. Is neighbourhood green space associated with a lower risk of Type 2 diabetes Mellitus? Evidence from 267,072 Australians. Diabetes Care. 2013c Sep 11; doi: 10.2337/dc13-1325. [DOI] [PubMed] [Google Scholar]
- Auchincloss AH, Diez Roux AV, Brown DG, O’Meara ES, Raghunathan TE. Association of insulin resistance with distance to wealthy areas: the multi-ethnic study of atherosclerosis. Am. J. Epidemiol. 2007 Feb 15;165(4):389–397. doi: 10.1093/aje/kwk028. [DOI] [PubMed] [Google Scholar]
- Auchincloss AH, Diez Roux AV, Brown DG, Erdmann CA, Bertoni AG. Epidemiology. 1. Vol. 19. Cambridge, Mass: 2008. Jan, Neighborhood resources for physical activity and healthy foods and their association with insulin resistance; pp. 146–157. [DOI] [PubMed] [Google Scholar]
- Auchincloss AH, Diez Roux AV, Mujahid MS, Shen M, Bertoni AG, Carnethon MR. Neighborhood resources for physical activity and healthy foods and incidence of type 2 diabetes mellitus: the Multi-Ethnic study of Atherosclerosis. Arch. Intern. Med. 2009 Oct 12;169(18):1698–1704. doi: 10.1001/archinternmed.2009.302. [DOI] [PMC free article] [PubMed] [Google Scholar]
- Baron RM, Kenny DA. The moderator-mediator variable distinction in social psychological research: conceptual, strategic, and statistical considerations. J. Personal. Soc Psychol. 1986 Dec;51(6):1173–1182. doi: 10.1037//0022-3514.51.6.1173. [DOI] [PubMed] [Google Scholar]
- Bennett GG, McNeill LH, Wolin KY, Duncan DT, Puleo E, Emmons KM. Safe to walk? Neighborhood safety and physical activity among public housing residents. PLoS Med. 2007 Oct;4(10):1599–1606. doi: 10.1371/journal.pmed.0040306. Discussion 1607. [DOI] [PMC free article] [PubMed] [Google Scholar]
- Bishaw A. Areas with Concentrated Poverty: 2006–2010. Bureau USC. 2011 [Google Scholar]
- Casagrande SS, Franco M, Gittelsohn J, et al. Healthy food availability and the association with BMI in Baltimore, Maryland. Public Health Nutr. 2011 Jun;14(6):1001–1007. doi: 10.1017/S1368980010003812. [DOI] [PMC free article] [PubMed] [Google Scholar]
- Centers for Disease Control and Prevention. Differences in Prevalence of Obesity Among Black, White, and Hispanic Adults – United States, 2006–2008. Washington, DC: 2009. [Google Scholar]
- Centers for Disease Control and Prevention. National Diabetes Fact Sheet: National Estimates and General Information on Diabetes and Prediabetes in the United States, 2011. Atlanta, GA: 2011. [Google Scholar]
- Chan JM, Rimm EB, Colditz GA, Stampfer MJ, Willett WC. Obesity, fat distribution, and weight gain as risk factors for clinical diabetes in men. Diabetes Care. 1994;17:961–969. doi: 10.2337/diacare.17.9.961. [DOI] [PubMed] [Google Scholar]
- Chang VW. Racial residential segregation and weight status among US adults. Soc. Sci. Med. (1982) 2006 Sep;63(5):1289–1303. doi: 10.1016/j.socscimed.2006.03.049. [DOI] [PubMed] [Google Scholar]
- Chang VW, Hillier AE, Mehta NK. Neighborhood racial isolation, disorder and obesity. Soc. Forces Sci. Medium Soc. Study interpret. 2009 Jun 1;87(4):2063–2092. doi: 10.1353/sof.0.0188. [DOI] [PMC free article] [PubMed] [Google Scholar]
- Chichlowska KL, Rose KM, Diez-Roux AV, Golden SH, McNeill AM, Heiss G. Individual and neighborhood socioeconomic status characteristics and prevalence of metabolic syndrome: the Atherosclerosis Risk in Communities (ARIC) Study. Psychosom. Med. 2008 Nov;70(9):986–992. doi: 10.1097/PSY.0b013e318183a491. [DOI] [PMC free article] [PubMed] [Google Scholar]
- Cochran W. Sampling Techniques. third. New York: John Wiley & Sons; 1977. [Google Scholar]
- Cohen DA, Finch BK, Bower A, Sastry N. Collective efficacy and obesity: the potential influence of social factors on health. Soc. Sci. Med. (1982) 2006 Feb;62(3):769–778. doi: 10.1016/j.socscimed.2005.06.033. [DOI] [PubMed] [Google Scholar]
- Colditz GA, Willett WC, Stampfer MJ, et al. Weight as a risk factor for clinical diabetes in women. Am. J. Epidemiol. 1990;132:501–513. doi: 10.1093/oxfordjournals.aje.a115686. [DOI] [PubMed] [Google Scholar]
- Connolly V, Unwin N, Sherriff P, Bilous R, Kelly W. Diabetes prevalence and socioeconomic status: a population based study showing increased prevalence of type 2 diabetes mellitus in deprived areas. J. Epidemiol. Community Health. 2000 Mar;54(3):173–177. doi: 10.1136/jech.54.3.173. [DOI] [PMC free article] [PubMed] [Google Scholar]
- Coombes E, Jones AP, Hillsdon M. The relationship of physical activity and overweight to objectively measured green space accessibility and use. Soc. Sci. Med. (1982) 2010 Mar;70(6):816–822. doi: 10.1016/j.socscimed.2009.11.020. [DOI] [PMC free article] [PubMed] [Google Scholar]
- Corral I, Landrine H, Hao Y, Zhao L, Mellerson JL, Cooper DL. Residential segregation, health behavior and overweight/obesity among a national sample of African American adults. J. Health Psychol. 2012 Apr;17(3):371–378. doi: 10.1177/1359105311417191. [DOI] [PubMed] [Google Scholar]
- Cox M, Boyle PJ, Davey PG, Feng Z, Morris AD. Locality deprivation and Type 2 diabetes incidence: a local test of relative inequalities. Soc Sci. Med. (1982) 2007 Nov;65(9):1953–1964. doi: 10.1016/j.socscimed.2007.05.043. [DOI] [PubMed] [Google Scholar]
- Cradock AL, Duncan DT. The role of the built environment in supporting health behavior change. In: Riekert KA, Ockene JK, Pbert L, editors. The Handbook of Health Behavior Change. fourth. Springer; 2013. [Google Scholar]
- Cubbin C, Hadden WC, Winkleby MA. Neighborhood context and cardiovascular disease risk factors: the contribution of material deprivation. Ethn. Dis. 2001 Fall;11(4):687–700. [PubMed] [Google Scholar]
- Cubbin C, Sundquist K, Ahlen H, Johansson SE, Winkleby MA, Sundquist J. Neighborhood deprivation and cardiovascular disease risk factors: protective and harmful effects. Scand. J. Public Health. 2006;34(3):228–237. doi: 10.1080/14034940500327935. [DOI] [PubMed] [Google Scholar]
- Cummins S, Macintyre S. Food environments and obesity–neighbourhood or nation? Int. J. Epidemiol. 2006 Feb;35(1):100–104. doi: 10.1093/ije/dyi276. [DOI] [PubMed] [Google Scholar]
- Diez Roux AV, Jacobs DR, Kiefe CI. Coronary Artery Risk Development in Young Adults S. Neighborhood characteristics and components of the insulin resistance syndrome in young adults: the coronary artery risk development in young adults (CARDIA) study. Diabetes Care. 2002 Nov;25(11):1976–1982. doi: 10.2337/diacare.25.11.1976. [DOI] [PubMed] [Google Scholar]
- Diez-Roux AV, Nieto FJ, Muntaner C, et al. Neighborhood environments and coronary heart disease: a multilevel analysis. Am. J. Epidemiol. 1997 Jul 1;146(1):48–63. doi: 10.1093/oxfordjournals.aje.a009191. [DOI] [PubMed] [Google Scholar]
- Diez-Roux AV, Nieto FJ, Caulfield L, Tyroler HA, Watson RL, Szklo M. Neighbourhood differences in diet: the Atherosclerosis Risk in Communities (ARIC) Study. J. Epidemiol. Community Health. 1999 Jan;53(1):55–63. doi: 10.1136/jech.53.1.55. [DOI] [PMC free article] [PubMed] [Google Scholar]
- Diez-Roux AV, Kiefe CI, Jacobs DR, Jr, et al. Area characteristics and individual-level socioeconomic position indicators in three population-based epidemiologic studies. Ann. Epidemiol. 2001 Aug;11(6):395–405. doi: 10.1016/s1047-2797(01)00221-6. [DOI] [PubMed] [Google Scholar]
- Dubowitz T, Heron M, Bird CE, et al. Neighborhood socioeconomic status and fruit and vegetable intake among Whites, Blacks, and Mexican Americans in the United States. Am. J. Clin. Nutr. 2008 Jun;87(6):1883–1891. doi: 10.1093/ajcn/87.6.1883. [DOI] [PMC free article] [PubMed] [Google Scholar]
- Dubowitz T, Ghosh-Dastidar M, Eibner C, et al. The Women’s Health Initiative: the food environment, neighborhood socioeconomic status, BMI, and blood pressure. Obesity (Silver Spring) 2012 Apr;20(4):862–871. doi: 10.1038/oby.2011.141. [DOI] [PMC free article] [PubMed] [Google Scholar]
- Dulin-Keita A, Kaur Thind H, Affuso O, Baskin ML. The associations of perceived neighborhood disorder and physical activity with obesity among African American adolescents. BMC Public Health. 2013;13:440. doi: 10.1186/1471-2458-13-440. [DOI] [PMC free article] [PubMed] [Google Scholar]
- Duncan DT. What’s your walk score(R)?: Web-based neighborhood walkability assessment for health promotion and disease prevention. Am. J. Prev. Med. 2013 Aug;45(2):244–245. doi: 10.1016/j.amepre.2013.04.008. [DOI] [PubMed] [Google Scholar]
- Duncan DT, Castro MC, Blossom JC, Bennett GG, Gortmaker SL. Evaluation of the positional difference between two common geocoding methods. Geospatial Health. 2011 May;5(2):265–273. doi: 10.4081/gh.2011.179. [DOI] [PubMed] [Google Scholar]
- Duncan DT, Kawachi I, White K, Williams DR. The geography of recreational open space: influence of neighborhood racial composition and neighborhood poverty. J. Urban Health Bull. N. Y Acad. Med. 2012a Oct 26; doi: 10.1007/s11524-012-9770-y. [DOI] [PMC free article] [PubMed] [Google Scholar]
- Duncan DT, White K, Aldstadt J, Castro MC, Whalden J, Williams DR. Space, race, and poverty: spatial inequalities in walkable neighborhood amenities? Demogr. Res. 2012;26:409–448. doi: 10.4054/DemRes.2012.26.17. [DOI] [PMC free article] [PubMed] [Google Scholar]
- Duncan DT, Kawachi I, Kum S, et al. A spatially explicit approach to the study of socio-demographic inequality in the spatial distribution of trees across Boston neighborhoods. Spat. Demogr. 2013;1(3):229–257. doi: 10.1007/BF03354902. [DOI] [PMC free article] [PubMed] [Google Scholar]
- Duncan DT, Piras G, Dunn EC, Johnson RM, Melly SJ, Molnar BE. The built environment and depressive symptoms among urban youth: a spatial regression study. Spat. Spatio-Temporal Epidemiol. 2013 Jun;5:11–25. doi: 10.1016/j.sste.2013.03.001. [DOI] [PMC free article] [PubMed] [Google Scholar]
- Economic costs of diabetes in the U.S. in 2007. Diabetes Care. 2008 Mar;31(3):596–615. doi: 10.2337/dc08-9017. [DOI] [PubMed] [Google Scholar]
- Fish JS, Ettner S, Ang A, Brown AF. Association of perceived neighborhood safety with [corrected] body mass index. Am. J. Public Health. 2010 Nov;100(11):2296–2303. doi: 10.2105/AJPH.2009.183293. [DOI] [PMC free article] [PubMed] [Google Scholar]
- Ford PB, Dzewaltowski DA. Neighborhood deprivation, supermarket availability, and BMI in low-income women: a multilevel analysis. J. Community Health. 2011 Oct;36(5):785–796. doi: 10.1007/s10900-011-9377-3. [DOI] [PubMed] [Google Scholar]
- Franzini L, Taylor W, Elliott MN, et al. Neighborhood characteristics favorable to outdoor physical activity: disparities by socioeconomic and racial/ ethnic composition. Health Place. 2010 Mar;16(2):267–274. doi: 10.1016/j.healthplace.2009.10.009. [DOI] [PubMed] [Google Scholar]
- Freedman VA, Grafova IB, Rogowski J. Neighborhoods and chronic disease onset in later life. Am. J. Public Health. 2011 Jan;101(1):79–86. doi: 10.2105/AJPH.2009.178640. [DOI] [PMC free article] [PubMed] [Google Scholar]
- Galvez MP, Morland K, Raines C, et al. Race and food store availability in an inner-city neighbourhood. Public Health Nutr. 2008 Jun;11(6):624–631. doi: 10.1017/S1368980007001097. [DOI] [PubMed] [Google Scholar]
- Gomez JE, Johnson BA, Selva M, Sallis JF. Violent crime and outdoor physical activity among inner-city youth. Prev. Med. 2004 Nov;39(5):876–881. doi: 10.1016/j.ypmed.2004.03.019. [DOI] [PubMed] [Google Scholar]
- Gordon C, Purciel-Hill M, Ghai NR, Kaufman L, Graham R, Van Wye G. Measuring food deserts in New York City’s low-income neighborhoods. Health Place. 2011 Mar;17(2):696–700. doi: 10.1016/j.healthplace.2010.12.012. [DOI] [PubMed] [Google Scholar]
- Harris MI, Eastman RC, Cowie CC, Flegal KM, Eberhardt MS. Racial and ethnic differences in glycemic control of adults with type 2 diabetes. Diabetes Care. 1999 Mar;22(3):403–408. doi: 10.2337/diacare.22.3.403. [DOI] [PubMed] [Google Scholar]
- Harrison RA, Gemmell I, Heller RF. The population effect of crime and neighbourhood on physical activity: an analysis of 15, 461 adults. J. Epidemiol. Community Health. 2007 Jan;61(1):34–39. doi: 10.1136/jech.2006.048389. [DOI] [PMC free article] [PubMed] [Google Scholar]
- Hattori A, An R, Sturm R. Neighborhood food outlets, diet, and obesity among california adults, 2007 and 2009. Prev. Chronic Dis. 2013 Mar;10:E35. doi: 10.5888/pcd10.120123. [DOI] [PMC free article] [PubMed] [Google Scholar]
- Hedman L, van Ham M. Understanding neighbourhood effects: selection bias and residential mobility. In: Ham van M, Manley D, Bailey N, Simpson L, Maclennan D, editors. Neighbourhood Effects Research: New Perspectives. Netherlands: Springer; 2012. pp. 79–99. [Google Scholar]
- Heeringa S, West BT, Berglund PA. Applied Survey Data Analysis. Boca Raton, Fla: CRC Press; 2010. [Google Scholar]
- Hirsch JA, Moore KA, Evenson KR, Rodriguez DA, Diez Roux AV. Walk score(R) and transit score(R) and walking in the multi-ethnic study of atherosclerosis. Am. J. Prev. Med. 2013 Aug;45(2):158–166. doi: 10.1016/j.amepre.2013.03.018. [DOI] [PMC free article] [PubMed] [Google Scholar]
- Hoehner CM, Allen P, Barlow CE, Marx CM, Brownson RC, Schootman M. Understanding the independent and joint associations of the home and workplace built environments on cardiorespiratory fitness and body mass index. Am. J. Epidemiol. 2013 Oct 1;178(7):1094–1105. doi: 10.1093/aje/kwt111. [DOI] [PMC free article] [PubMed] [Google Scholar]
- Hsieh S, Klassen AC, Curriero FC, et al. Fast-food restaurants, park access, and insulin resistance among Hispanic youth. Am. J. Prev. Med. 2014 Apr;46(4):378–387. doi: 10.1016/j.amepre.2013.12.007. [DOI] [PubMed] [Google Scholar]
- Inagami S, Cohen DA, Finch BK, Asch SM. You are where you shop: grocery store locations, weight, and neighborhoods. Am. J. Prev. Med. 2006 Jul;31(1):10–17. doi: 10.1016/j.amepre.2006.03.019. [DOI] [PubMed] [Google Scholar]
- Inagami S, Cohen DA, Brown AF, Asch SM. Body mass index, neighborhood fast food and restaurant concentration, and car ownership. J. Urban Health Bull. N. Y. Acad. Med. 2009 Sep;86(5):683–695. doi: 10.1007/s11524-009-9379-y. [DOI] [PMC free article] [PubMed] [Google Scholar]
- Jones A, Grigsby-Toussaint DS, Kubo J. Black-White residential segregation and diabetes status: results from the behavioral risk factor surveillance system. Open J. Prev. Med. 2013;3(2):165–171. [Google Scholar]
- Karter AJ, Ferrara A, Liu JY, Moffet HH, Ackerson LM, Selby JV. Ethnic disparities in diabetic complications in an insured population. JAMA. 2002 May 15;287(19):2519–2527. doi: 10.1001/jama.287.19.2519. [DOI] [PubMed] [Google Scholar]
- Kawachi I, Berkman L, editors. Neighborhoods and Health. New York: Oxford University Press; 2003. [Google Scholar]
- Kirk JK, D’Agostino RB, Jr, Bell RA, et al. Disparities in HbA1c levels between African–American and non-Hispanic white adults with diabetes: a meta-analysis. Diabetes Care. 2006 Sep;29(9):2130–2136. doi: 10.2337/dc05-1973. [DOI] [PMC free article] [PubMed] [Google Scholar]
- Krieger N, Chen JT, Waterman PD, Soobader MJ, Subramanian SV, Carson R. Geocoding and monitoring of US socioeconomic inequalities in mortality and cancer incidence: does the choice of area-based measure and geographic level matter?: The Public Health Disparities Geocoding Project. Am. J. Epidemiol. 2002 Sep 1;156(5):471–482. doi: 10.1093/aje/kwf068. [DOI] [PubMed] [Google Scholar]
- Krishnan S, Cozier YC, Rosenberg L, Palmer JR. Socioeconomic status and incidence of type 2 diabetes: results from the Black Women’s Health Study. Am. J. Epidemiol. 2010 Mar 1;171(5):564–570. doi: 10.1093/aje/kwp443. [DOI] [PMC free article] [PubMed] [Google Scholar]
- Lanting LC, Joung IM, Mackenbach JP, Lamberts SW, Bootsma AH. Ethnic differences in mortality, end-stage complications, and quality of care among diabetic patients: a review. Diabetes Care. 2005 Sep;28(9):2280–2288. doi: 10.2337/diacare.28.9.2280. [DOI] [PubMed] [Google Scholar]
- Laraia BA, Karter AJ, Warton EM, Schillinger D, Moffet HH, Adler N. Place matters: neighborhood deprivation and cardiometabolic risk factors in the Diabetes Study of Northern California (DISTANCE) Soc. Sci. Med. (1982) 2001 Apr;74(7):1082–1090. doi: 10.1016/j.socscimed.2011.11.036. [DOI] [PMC free article] [PubMed] [Google Scholar]
- Larson NI, Story MT, Nelson MC. Neighborhood environments: disparities in access to healthy foods in the U.S. Am. J. Prev. Med. 2009;36:74–81. doi: 10.1016/j.amepre.2008.09.025. [DOI] [PubMed] [Google Scholar]
- LaVeist TA, Thorpe RJ, Jr, Galarraga JE, Bower KM, Gary-Webb TL. Environmental and socio-economic factors as contributors to racial disparities in diabetes prevalence. J. Gen. Intern. Med. 2009 Oct;24(10):1144–1148. doi: 10.1007/s11606-009-1085-7. [DOI] [PMC free article] [PubMed] [Google Scholar]
- Laveist T, Pollack K, Thorpe R, Jr, Fesahazion R, Gaskin D. Place, not race: disparities dissipate in southwest Baltimore when blacks and whites live under similar conditions. Health Aff. (Project Hope) 2011 Oct;30(10):1880–1887. doi: 10.1377/hlthaff.2011.0640. [DOI] [PMC free article] [PubMed] [Google Scholar]
- Li F, Harmer P, Cardinal BJ, Bosworth M, Johnson-Shelton D. Obesity and the built environment: does the density of neighborhood fast-food outlets matter? Am. J. Health Promot. 2009 Jan-Feb;23(3):203–209. doi: 10.4278/ajhp.071214133. [DOI] [PMC free article] [PubMed] [Google Scholar]
- Logan JR, Stults B. The Persistence of Segregation in the Metropolis: New Findings from the 2010 Census. 2011 [Google Scholar]
- Lovasi GS, Hutson MA, Guerra M, Neckerman KM. Built environments and obesity in disadvantaged populations. Epidemiol. Rev. 2009;31:7–20. doi: 10.1093/epirev/mxp005. [DOI] [PubMed] [Google Scholar]
- Lovasi GS, Bader MD, Quinn J, Neckerman K, Weiss C, Rundle A. Body mass index, safety hazards, and neighborhood attractiveness. Am. J. Prev. Med. 2012 Oct;43(4):378–384. doi: 10.1016/j.amepre.2012.06.018. [DOI] [PMC free article] [PubMed] [Google Scholar]
- Lynch J, Kaplan G. Socioeconomic position. In: Berkman LF, Kawachi I, editors. Social Epidemiology. New York: Oxford University Press; 2000. pp. 13–35. [Google Scholar]
- Maddock J. The relationship between obesity and the prevalence of fast food restaurants: state-level analysis. Am. J. Health Promot. 2004 Nov-Dec;19(2):137–143. doi: 10.4278/0890-1171-19.2.137. [DOI] [PubMed] [Google Scholar]
- Maroko AR, Maantay JA, Sohler NL, Grady KL, Arno PS. The complexities of measuring access to parks and physical activity sites in New York City: a quantitative and qualitative approach. Int. J. Health Geogr. 2009;8:34. doi: 10.1186/1476-072X-8-34. [DOI] [PMC free article] [PubMed] [Google Scholar]
- Massachusetts Office of Geographic Information. Office of Geographic Information (MassGIS) 2013 http://www.mass.gov/anf/research-and-tech/it-serv-and-support/application-serv/office-of-geographic-information-massgis/
- Massey DS. American Apartheid: segregation and the making of the Underclass. Am. J. Sociol. 1990;96(2):329–357. [Google Scholar]
- Massey DS, Denton NA. American Apartheid: Segregation and the Making of the Underclass. Cambridge, MA: Harvard University Press; 1993. [Google Scholar]
- Matthews SA. Communities, Neighborhoods, and Health. Springer; 2011. Spatial Polygamy and the Heterogeneity of Place: Studying People and Place via Egocentric Methods; pp. 35–55. [Google Scholar]
- McKinlay JB, Link CL. Measuring the urologic iceberg: design and implementation of the Boston Area Community Health (BACH) Survey. Eur. Urol. 2007 Aug;52(2):389–396. doi: 10.1016/j.eururo.2007.03.013. [DOI] [PMC free article] [PubMed] [Google Scholar]
- Mitchell R, Popham F. Effect of exposure to natural environment on health inequalities: an observational population study. Lancet. 2008 Nov 8;372(9650):1655–1660. doi: 10.1016/S0140-6736(08)61689-X. [DOI] [PubMed] [Google Scholar]
- Moore LV, Diez Roux A. Associations of neighborhood characteristics with the location and type of food stores. Am. J. Public Health. 2006;96(2):325–331. doi: 10.2105/AJPH.2004.058040. [DOI] [PMC free article] [PubMed] [Google Scholar]
- Morland KB, Evenson KR. Obesity prevalence and the local food environment. Health Place. 2009 Jun;15(2):491–495. doi: 10.1016/j.healthplace.2008.09.004. [DOI] [PMC free article] [PubMed] [Google Scholar]
- Morland K, Wing S, Diez Roux A. The contextual effect of the local food environment on residents’ diets: the Atherosclerosis Risk in Communities Study. Am. J. Public Health. 2002;92(11):1761–1767. doi: 10.2105/ajph.92.11.1761. [DOI] [PMC free article] [PubMed] [Google Scholar]
- Morland K, Diez Roux AV, Wing S. Supermarkets, other food stores, and obesity: the atherosclerosis risk in communities study. Am. J. Prev. Med. 2006 Apr;30(4):333–339. doi: 10.1016/j.amepre.2005.11.003. [DOI] [PubMed] [Google Scholar]
- Muller G, Kluttig A, Greiser KH, et al. Regional and neighborhood disparities in the odds of type 2 diabetes: results from 5 population-based studies in Germany (DIAB-CORE consortium) Am. J. Epidemiol. 2013 Jul 15;178(2):221–230. doi: 10.1093/aje/kws466. [DOI] [PubMed] [Google Scholar]
- Mytton OT, Townsend N, Rutter H, Foster C. Green space and physical activity: an observational study using Health Survey for England data. Health Place. 2012 Sep;18(5):1034–1041. doi: 10.1016/j.healthplace.2012.06.003. [DOI] [PMC free article] [PubMed] [Google Scholar]
- OMB (Office of Management and Budget) Register F, editor. Recommendations from the Interagency Committee for the Review of the Racial and Ethnic Standards to the Office of Management and Budget Concerning Changes to the Standards for the Classification of Federal Data on Race and Ethnicity, Revisions to the Standards for the Classification of Federal Data on Race and Ethnicity. 1997:36873–36946. [Google Scholar]
- Oreskovic NM, Kuhlthau KA, Romm D, Perrin JM. Built environment and weight disparities among children in high- and low- income towns. Acad. Pediatr. 2009;9(5):315–321. doi: 10.1016/j.acap.2009.02.009. [DOI] [PubMed] [Google Scholar]
- Piccolo RS, Araujo AB, Pearce N, McKinlay JB. Cohort profile: The Boston Area Community Health (BACH) survey. Int. J. Epidemiol. 2014;43(1):42–51. doi: 10.1093/ije/dys198. [DOI] [PMC free article] [PubMed] [Google Scholar]
- Powell LM, Chaloupka FJ, Bao Y. The availability of fast-food and full-service restaurants in the United States: associations with neighborhood characteristics. Am. J. Prev. Med. 2007 Oct;33(4 Suppl. l):S240–S245. doi: 10.1016/j.amepre.2007.07.005. [DOI] [PubMed] [Google Scholar]
- R: A Language and Environment for Statistical Computing [Computer Program] R Foundation for Statistical Computing. Austria: Vienna; 2012. [Google Scholar]
- Ross CE, Mirowsky J. Disorder and decay: the concept and measurement of perceived neighborhood disorder. Urban Aff. Rev. 1999;34:412–432. [Google Scholar]
- Ross CE, Mirowsky J. Neighborhood disadvantage, disorder, and health. J. Health Soc. Behav. 2001 Sep;42(3):258–276. [PubMed] [Google Scholar]
- Ross CE, Mirowsky J. Neighborhood disorder, subjective alienation, and distress. J. Health Soc. Behav. 2009 Mar;50:49–64. doi: 10.1177/002214650905000104. [DOI] [PubMed] [Google Scholar]
- Ross CE, Mirowsky J, Pribesh S. Powerlessness and the amplification of threat: neighborhood disadvantage, disorder, and mistrust. Am. Sociol. Rev. 2001;66(4):568–591. [Google Scholar]
- Schootman M, Andresen EM, Wolinsky FD, et al. The effect of adverse housing and neighborhood conditions on the development of diabetes mellitus among middle-aged African Americans. Am. J. Epidemiol. 2007 Aug 15;166(4):379–387. doi: 10.1093/aje/kwm190. [DOI] [PMC free article] [PubMed] [Google Scholar]
- Schootman M, Sterling DA, Struthers J, et al. Positional accuracy and geographic bias of four methods of geocoding in epidemiologic research. Ann. Epidemiol. 2007 Jun;17(6):464–470. doi: 10.1016/j.annepidem.2006.10.015. [DOI] [PubMed] [Google Scholar]
- Shishehbor MH, Gordon-Larsen P, Kiefe CI, Litaker D. Association of neighborhood socioeconomic status with physical fitness in healthy young adults: the Coronary Artery Risk Development in Young Adults (CARDIA) study. Am. Heart J. 2008 Apr;155(4):699–705. doi: 10.1016/j.ahj.2007.07.055. [DOI] [PMC free article] [PubMed] [Google Scholar]
- Smiley MJ, Diez Roux AV, Brines SJ, Brown DG, Evenson KR, Rodriguez DA. A spatial analysis of health-related resources in three diverse metropolitan areas. Health Place. 2010 Sep;16(5):885–892. doi: 10.1016/j.healthplace.2010.04.014. [DOI] [PMC free article] [PubMed] [Google Scholar]
- Subramanian SV, Acevedo-Garcia D, Osypuk TL. Racial residential segregation and geographic heterogeneity in black/white disparity in poor self-rated health in the US: a multilevel statistical analysis. Soc. Sci. Med. (1982) 2005 Apr;60(8):1667–1679. doi: 10.1016/j.socscimed.2004.08.040. [DOI] [PubMed] [Google Scholar]
- Sundquist K, Theobald H, Yang M, Li X, Johansson SE, Sundquist J. Neighborhood violent crime and unemployment increase the risk of coronary heart disease: a multilevel study in an urban setting. Soc Sci. Med. (1982) 2006 Apr;62(8):2061–2071. doi: 10.1016/j.socscimed.2005.08.051. [DOI] [PubMed] [Google Scholar]
- U.S. Census Bureau. Census Tracts and Block Numbering Areas. 2000 http://www.census.gov/geo/www/cen_tract.html (accessed 26.04.13.) and Human Services Office of Minority Health. Diabetes and African Americans http://minorityhealth.hhs.gov/templates/content.aspx?lvl=2&lvlID=51&ID=3017 (accessed 04.08. 12)
- USDA. Center for nutrition policy and promotion. Health Eat. Index 2005. 2008 [Google Scholar]
- van Buuren S, Groothuis-Oudshoorn K. Mice: mutlivariate imputation by chained equations R. J. Stat. Softw. 2011;45(3):1–67. [Google Scholar]
- Vanderweele TJ, Vansteelandt S. Odds ratios for mediation analysis for a dichotomous outcome. Am. J. Epidemiol. 2010 Dec 15;172(12):1339–1348. doi: 10.1093/aje/kwq332. [DOI] [PMC free article] [PubMed] [Google Scholar]
- Washburn RA, Ficker JL. Physical Activity Scale for the Elderly (PASE): the relationship with activity measured by a portable accelerometer. J. Sports Med. Phys. Fit. 1999 Dec;39(4):336–340. [PubMed] [Google Scholar]
- Washburn RA, Smith KW, Jette AM, Janney CA. The Physical Activity Scale for the Elderly (PASE): development and evaluation. J. Clin. Epidemiol. 1993 Feb;46(2):153–162. doi: 10.1016/0895-4356(93)90053-4. [DOI] [PubMed] [Google Scholar]
- Washburn RA, McAuley E, Katula J, Mihalko SL, Boileau RA. The physical activity scale for the elderly (PASE): evidence for validity. J. Clin. Epidemiol. 1999 Jul;52(7):643–651. doi: 10.1016/s0895-4356(99)00049-9. [DOI] [PubMed] [Google Scholar]
- Willett WC, Reynolds RD, Cottrell-Hoehner S, Sampson L, Browne ML. Validation of a semi-quantitative food frequency questionnaire: comparison with a 1-year diet record. J. Am. Dietetic Assoc. 1987 Jan;87(1):43–47. [PubMed] [Google Scholar]
- Willett WC, Howe GR, Kushi LH. Adjustment for total energy intake in epidemiologic studies. Am. J. Clin. Nutr. 1997 Apr;65(4 Suppl. 1):1220S–1228S. doi: 10.1093/ajcn/65.4.1220S. Discussion 1229S-1231S. [DOI] [PubMed] [Google Scholar]
- Williams DR, Collins C. Racial residential segregation: a fundamental cause of racial disparities in health. Public Health Rep. 2001;116(5):404–416. doi: 10.1093/phr/116.5.404. [DOI] [PMC free article] [PubMed] [Google Scholar]
- Wong MD, Shapiro MF, Boscardin WJ, Ettner SL. Contribution of major diseases to disparities in mortality. N. Engl. J. Med. 2002 Nov 14;347(20):1585–1592. doi: 10.1056/NEJMsa012979. [DOI] [PubMed] [Google Scholar]
- Wu S, Crespi CM, Wong WK. Comparison of methods for estimating the intraclass correlation coefficient for binary responses in cancer prevention cluster randomized trials. Contemp. Clin. Trials. 2012 Sep;33(5):869–880. doi: 10.1016/j.cct.2012.05.004. [DOI] [PMC free article] [PubMed] [Google Scholar]
- Yang W, Spears K, Zhang F, Lee W, Himler HL. Evaluation of personal and built environment attributes to physical activity: a multilevel analysis on multiple population-based data sources. J. Obes. 2012;2012:548910. doi: 10.1155/2012/548910. [DOI] [PMC free article] [PubMed] [Google Scholar]
- Zick CD, Smith KR, Fan JX, Brown BB, Yamada I, Kowaleski-Jones L. Running to the store? The relationship between neighborhood environments and the risk of obesity. Soc. Sci. Med. (1982) 2009 Nov;69(10):1493–1500. doi: 10.1016/j.socscimed.2009.08.032. [DOI] [PMC free article] [PubMed] [Google Scholar]