Abstract
Local delivery of anti-HIV drugs to the colorectal mucosa, a major site of HIV replication, and their retention within mucosal tissue would allow for a reduction in dose administered, reduced dosing frequency and minimal systemic exposure. The current report describes a mucosal Pre-Exposure Prophylaxis (mPrEP) strategy that utilizes nanocarrier conjugates (NC) consisting of poly(ethylene glycol) (PEG), amprenavir (APV) and a cell penetrating peptide (CPP; namely Bac7, a fragment derived from bactenecin 7). APV-PEG NCs with linear PEGs (2, 5, 10, and 30 kDa) exhibited reduced (52 – 21%) anti-HIV-1 protease (PR) activity as compared to free APV in an enzyme-based FRET assay. In MT-2 T-cells, APV-PEG3.4kDa-FITC (APF) anti-HIV-1 activity was significantly reduced (160-fold, IC50 = 8.064 µM) due to poor cell uptake whereas it was restored (IC50 = 78.29 nM) and similar to APV (IC50 = 50.29 nM) with the addition of Bac7 to the NC (i.e., APV-PEG3.4kDa-Bac7, APB). Flow cytometry and confocal microscopy demonstrated Bac7-PEG3.4kDa-FITC (BPF) uptake was two- and four-fold higher than APF in MT-2 T-cells and Caco-2 intestinal epithelial cells, respectively. There was no detectable punctate fluorescence in either cell line suggesting that BPF directly enters the cytosol thus avoiding endosomal entrapment. After colorectal administration in mice, BPF mucosal concentrations were 21-fold higher than APF concentrations. BPF concentrations also remained constant for the 5 days of the study suggesting that (1) the NC’s structural characteristics (i.e., the size of the PEG carrier and the presence of a CPP) significantly influenced tissue persistence and (2) the NCs were probably lodged in the lamina propria since the average rodent colon mucosal cell turnover time is 2–3 days. These encouraging results suggest that Bac7 functionalized NCs delivered locally to the colorectal mucosa may form drug delivery depots that are capable of sustaining colorectal drug concentrations. Although the exact mechanisms for tissue persistence are unclear and will require further study, these results provide proof-of-concept feasibility for mPrEP.
Keywords: amprenavir, bactenecin 7, cell penetrating peptide, darunavir, HIV, mucosal delivery, PEG conjugation, polymeric drug delivery systems, pre-exposure prophylaxis
INTRODUCTION
Eradicating HIV and preventing new infections remain formidable challenges despite enormous progress made during the past three decades in combating the HIV pandemic. There were more than 35 million people living with HIV in 2014, of whom 2.1 million were newly infected. This includes 50,000 new cases in the United States alone [1]. The majority of new HIV infections in the US each year occur in men who have sex with men (MSM) (63%) [2]. In the absence of an effective vaccine, multiple other prevention strategies including the use of condoms, microbicides and oral Pre-Exposure Prophylaxis (PrEP) and microbicide strategies have been evaluated but have had limited success [3]. CAPRISA 004, the first clinical trial to evaluate topical administration of the ARV drug tenofovir to the vaginal mucosa in a gel formulation, was somewhat effective (39%) in preventing HIV transmission [4],[5]. Since then, numerous microbicide or mixed microbicide/PrEP clinical trials (e.g., VOICE) have been conducted without success. Most of the focus has been directed in the area of vaginal microbicides, some of which have advanced to phase 3 clinical trials before termination. To our knowledge, there have only been eight phase 1 clinical trials completed for rectal ARV microbicides; none of which have progressed to late-stage clinical testing according to clinicaltrials.gov. Unfortunately, technologies developed for vaginal delivery cannot be directly translated for rectal administration due to anatomical and luminal differences between the colorectum and vagina[6]. Whether considering rectal or vaginal prevention approaches, dosing and formulation acceptability remain significant concerns to patient adherence and clinical trial success[7]. Truvada®, the first approved orally administered PrEP regimen, is a 300mg tenofovir disoproxil fumarate (TDF) and 200 mg emtricitabine (FTC) fixed dose combination product that demonstrated 75–90% effectiveness but requires strict patient adherence to the regimen. Since Truvada is administered orally every day, chronic systemic exposure to TDF/FTC increases the potential for toxicity and side effects.
Treating HIV soon after mucosal transmission is likely to be more effective than treating at later stages due to viral vulnerability at the early stages of infection [8]. Dissemination of HIV to the secondary lymphatic tissues occurs once local viral expansion reaches a critical threshold level. This results in the establishment of chronic systemic HIV infection. Thus early intervention can limit viral expansion so the critical threshold for systemic viral dissemination is not reached. The window of opportunity to successfully intervene lasts about a week from the time of initial sexual exposure to HIV [8]. The vaginal and colorectal mucosae are considered early prevention sites for drug delivery due to their direct exposure to HIV. However, approaches for eliminating HIV at the early stages of infection should also consider the gut since, immediately post colorectal/vaginal transmission, massive viral replication and CD4+ T cell depletion occurs in the gut mucosa establishing it as a major reservoir site [9], [10]. The pivotal role of the gut in HIV replication and CD4+ T cell depletion persists thereafter at all subsequent stages of infection making it a prime target for eradication as well.
Clinical trial data suggests that topical application of ARV drugs by the vaginal and rectal routes is superior to the oral route in preventing sexual transmission of HIV-1 since the concentrations achieved in local tissues are significantly higher [11]. For example, tenofovir concentrations in vaginal tissue when administered as a vaginal gel (1%) are over 1000-fold higher than when administered orally [12],[13]. Drug concentrations after oral administration were found to be below what is believed to be the threshold of efficacy in clinical trials [14], [15], [11]. Although the ARV threshold concentrations in mucosal tissues for infection prevention have yet to be established, suboptimal concentrations of tenofovir, the main agent used in clinical trials, may have been achieved. An analysis of phase 1 trial results suggests that the concentration of tenofovir diphosphate, the metabolite of TDF, should be greater than 1000 fmol/mg. Unfortunately, vaginal concentrations in tissue after daily gel administration were about 1000 fmol/mg or just at the effective limit suggesting that current topical formulations operate within a thin margin of safety and missing one daily dose could result in the failure of protection [11]. It should be noted that TDF has a relatively long half-life (about 17 hours in serum), and this situation becomes further complicated when considering other ARVs, most of which are small molecule drugs and even more rapidly cleared from mucosal tissues[16]. More frequent administration may result in higher and more sustained mucosal drug concentrations but this regimen is likely to be too frequent to achieve sufficient patient adherence. Pre-clinical and clinical studies have established that polymer-drug conjugates that increase drug retention in the body result in reduced dosing frequency and improved patient adherence may offer a solution [17].
ARVs and drug carriers encounter multiple biological barriers in series as they attempt to reach their mucosal targets in the colon, gut, rectum and vagina. The first is the mucus layer, a viscoelastic gel consisting of interwoven glycoprotein fibers with water-filled spaces that is tightly associated with the mucosal surface [18]. Translocation through mucus is size and charge dependent [19, 20]. Certain polymers such as poly(ethylene glycol) (PEG) and polyvinylpyrrolidone (PVP) as well as nanoparticles (NP) displaying short (~ 2 kDa) PEG polymers can penetrate the mucus layer [21, 22]. In addition to being a mechanical barrier, mucus can act as a carrier itself and deliver drugs and drug carriers past absorption sites since adherent mucus begins to flow distally under its own weight as additional mucus is secreted into the intestine [23, 24]. After crossing the mucus layer, a drug carrier must also penetrate the epithelial mucosal barrier to reach the lamina propria (LP) where HIV replication occurs. Cell penetrating peptides (CPP) conjugated to drug carriers have shown utility in enhancing cell uptake [25]. However, the commonly used Arg-rich family of CPPs is not a good choice as its prototype Tat CPP enters cells by endocytosis becoming trapped inside endosomes [26, 27]. On the other hand, the Pro-rich family of CPPs penetrate directly into the cytosol thus avoiding endosomal entrapment altogether [28]. One such example is a 10 residue CPP derived from the bactenecin 7 protein (Pro15-Arg-Pro-Leu-Pro-Phe-Pro-Arg-Pro-Gly24-COOH). In fact, the membrane penetrating properties of this Pro-rich CPP are superior to Tat CPP [29]. A 12-residue derivative of this CPP, defined later as Bac7, is used in the current study.
A mucosal PrEP (mPrEP) strategy (i.e., where drug is administered and retained locally in mucosal tissues) could result in reductions in ARV doses administered and the resulting systemic exposure. In the current study, a mucosal PrEP strategy is proposed to achieve, sustain and retain effective mucosal ARV drug concentrations in colorectal tissues after local rather than systemic ARV exposure. The proposed delivery approach aims to sustain effective ARV concentrations by increasing ARV residence time in the LP after administration directly to the colorectal mucosa. In the current design, the PEG moiety of the CPP-drug-polymer nanocarrier conjugate (NC) enables mucosal retention while the Bac7 moiety enables mucosal penetration. The HIV-1 PR inhibitor amprenavir (APV, MW 505.6) was selected as a model ARV since it could be conjugated to the NC via the amino functionality of the benzenesulfonamide moiety allowing it to retain its anti-HIV activity similar to enamino oxindole derivatives functionalized at the same amino group [30]. In addition to structural analogs of APV, the conjugation approach can also be applied to any ARV possessing an aromatic amino functional group such as tenofovir or emtricitabine. In the current study an mPrEP strategy employing CPP-drug-polymer conjugate is described and evaluated in vitro and in vivo.
Materials and Methods
Materials
Agenerase® capsules were obtained from GlaxoSmithKline (Research Triangle Park, NC). The mPEGX –NHS derivatives (x= 2, 5, 10, and 30 kDa) were purchased from NOF America (White Plains, NY), FITC-PEG3.4kDa-COOH and maleimide-PEG3.4kDa-COOH from NANOCS (Burlington, MA), amino acids and Fluoresceine isothiocyanate (FITC) from AnaSpec Inc. (Fremont, CA), NovaSyn® TG Sieber resin from EMD Millipore (Billerica, MA) and 1-hydroxy-7-azabenzotriazole (HOAt) and 1-[Bis(dimethylamino)methylene]-1H-1,2,3-triazolo[4,5-b]pyridinium 3-oxid hexafluorophosphate (HATU) from GenScript (Piscataway, NJ). All other chemicals were purchased from Sigma-Aldrich (St. Louis, MO). Sephadex beads (LH-20 and LH-60) were obtained from Amersham Biosciences (Uppsala, Sweden). Dialysis membranes (MWCO, 1000 and 3000) and Microcon centrifugal filters (MWCO, 3000) were purchased from Cole-Parmer (Rancho Domingues, CA). Sensolyte 490 HIV-1 PR assay kit was purchased from Anaspec Inc. (Fremont, CA). The MT-2 cells were obtained from the NIH AIDS Research and Reference Reagent Program. Fetal bovine serum (FBS), phenol red-free RPMI Medium, penicillin/streptomycin 100x solution, tetramethylrhodamine dextran, diamidino-2-phenylindole dihydrochloride (DAPI) were purchased from Life Technologies Corp (Carlsbad, CA). Chambered coverglass (Lab-Tek™ II) was purchased from Thermo Scientific (Waltman, MA).
Electrospray ionization mass spectrometry (ESI-MS) was performed on a Finnigan MAT TSQ 7000 and a Waters ZQ-4000. Mass spectrometry using matrix-assisted-laser-desorption-ionization time-of-flight (MALDI-TOF-MS) was carried out on ABI-MDS SCIEX 4800. UV and fluorescence were measured using a Tecan GENios multifunction microplate reader (MTX Lab Systems, Vienna, VA). Confocal imaging of MT2 cells was performed on a Leica TSC SP5 confocal microscope (Leica Microsystems CMS GmbH, Germany). HPLC analysis was carried on a Waters system (Milford, MA) equipped with UV and fluorescence detectors. The following reverse-phase (RP) C18 HPLC columns were used: A - Waters (symmetry, 5 µm, 4.6 × 150 mm, Milford, MA) or B - Agilent Technologies (3.5 µm, 4.6 × 50 mm, Santa Clara, CA). Ultrahydrogel 250 (7.8 × 300 mm, 6 mm) was used for size exclusion chromatography (Waters Corp., Milford, MA).
Extraction of APV from Agenerase® capsules
The capsule shells were cut open with a sharp blade and contents containing APV and excipients, were mixed with distilled water resulting in crude APV as a white precipitate. The crude APV was purified on a silica column using an ethyl acetate/methanol gradient. The extracted APV was characterized using RP-HPLC (column A) and ESI-MS. Retention time (Rt) = 18 min; m/z was (calculated) 506.6 Da; observed, 506.74 Da for [M+H]+.
Preparation of APV-O-acetyl
APV (0.17 g, 0.34 mmol) was dissolved in N,N-dimethyl formamide (DMF, 3 mL) containing N,N-diisopropyl ethylamine (DIPEA, 2%). Acetic anhydride (0.125 mL, 1.32 mmol) was added drop wise into the solution. The reaction mixture was stirred at room temperature for 12 h. The crude product was purified on a silica column using a gradient of ethyl acetate/methanol. The pure product was obtained as off-white solid after evaporation on a rotary evaporator. The product was characterized using RP-HPLC (column B) and ESI-MS. Rt = 15 min; m/z values (calculated) were 570.2 Da and 1,117.5 Da, m/z values (observed) were 570.5 Da and 1117.4 Da for [M+Na]+ and [2M+Na]+ respectively.
PEGX-APV-O-acetyl and PEGx-APV-OH
The mPEGx-NHS (x = 2, 5, 10 or 30 kDa) polymers (0.01mmol) were reacted with APV-O-acetyl (0.03 mmol, 3 equiv) in DMF (4 mL) containing DIPEA (2%). The reaction mixtures were stirred at room temperature for 24 hr. The products were purified on Sephadex LH-20 (2 and 5 kDa conjugates) or Sephadex LH-60 column (10 and 30 kDa conjugates). The O-acetyl groups in PEGX-APV-O-acetyl derivatives were removed by treating with HCl (0.1 N) at room temperature for 6 hr. The HCl was then neutralized with sodium bicarbonate and the solutions were lyophilized to obtain crude conjugates as white flakes. The conjugates were purified by size exclusion chromatography (SEC) on Waters Ultrahydrogel 250 column using water as mobile phase (flow rate: 0.8 ml/min) and characterized using MALDI-TOF-MS. The reaction yields were ~50% for all PEG conjugates. The retention times were: for the 2 kDa: Rt = 24 min, m/z observed 2,505.6 Da; 5 kDa: Rt = 23 min, m/z observed 5,625.6 Da; 10 kDa: Rt = 20 min, m/z observed 10,700.1 Da; 30 kDa: Rt = 17 min, m/z observed 31,098.7 Da.
APV-PEG3.4kDa-FITC (APF)
An active ester of FITC-PEG3.4kDa-COOH (0.03 mmol) was formed using 1-Ethyl-3-(3'-dimethylaminopropyl)carbodiimide (EDCI, 4 equiv., 0.12 mmol) and 1-hydroxy-7-azabenzotriazole (HOAt, 3 equiv., 0.09 mmol) in DMF (3 ml). After 2 min of activation, APV (2 equiv., 0.06 mmol) was added to the solution and the reaction mixture was stirred in dark at room temperature for 16 h. The conjugate was purified by dialysis (MWCO 3,000 Da) against water (3 × 2 L for 24 h) and lyophilized to obtain APF as yellow fakes. APF was quantified using a FITC standard curve and characterized by MALDI-TOF-MS. The m/z (calculated) was 4,705.6 Da and m/z (observed) was 4,800.9 Da for [M+H]+.
Bac7 Cell Penetrating Peptide
Bac7 (N-Ac-Cys-Gly-Pro15-Arg-Pro-Leu-Pro-Phe-Pro-Arg-Pro-Gly24-COOH) is a modified Pro-rich CPP derived from bactenecin 7 protein (residue 15–24) as described previously. Bac7 was synthesized on NovaSyn® TG Sieber resin using a Nautilus 2400 automated peptide synthesizer. Fmoc chemistry for solid-phase peptide synthesis (SPPS) was used to assemble the resin-bound Bac7. The peptide was cleaved from the resin using trifluoroacetic acid (TFA), ethanedithiol, water, and triisopropylsilane (94/2.5/2.5/1, vol/vol). The product was analyzed using RP-HPLC (Agilent 3.5 µm, 4.6 × 50 mm column, Rt = 4 min) and characterized by MALDI-TOF-MS. The m/z (calculated) was 1,333.71 Da and m/z (observed) was 1,334.6 Da for [M+H]+.
APV-PEG3.4kDa-Bac7 (APB)
The Bac7 peptide (0.01 mmol) was reacted with maleimide-PEG3.4kDa-COOH (0.01 mmol, 1 equiv.) in DMF (0.5 mL). The reaction was monitored by measuring the reduction in free thiol groups using Ellman’s assay at 0, 0.5, 1.0, 1.5, 2, and 4 h [31]. The reaction was ~85% complete in 4 h. The product was purified by dialysis (MWCO = 3000 Da) against water (3 × 2 L for 24 h). The Bac7-PEG3.4kDa-COOH was characterized by MALDI-TOF-MS. The m/z (calculated) was 4,733.6 Da and m/z (observed) was 4,732.7 Da for [M+H]+. In the next step, Bac7-PEG3.4kDa-COOH (0.02 mmol) was reacted with APV (0.04 mmol, 2 equiv.) by a method similar to one described earlier. The product was purified by dialysis (MWCO, 3000 Da) and then lyophilized to obtain pure APB as white flakes. The conjugate was characterized by MALDI-TOF-MS. The m/z (calculated) was 5,219.9 Da and m/z was (observed) was 5,459.5 Da for [M+H]+.
Bac7-PEG3.4kDa-FITC (BPF)
The maleimide-PEG3.4kDa-FITC (0.01 mmol) was reacted with Bac7 (0.03 mmol, 3 equiv.) in dry DMF (0.5 mL). The reaction mixture was stirred in dark at room temperature. The product was purified by dialysis (MWCO, 3000 Da) and then lyophilized to obtain BPF as yellow flakes. The product was characterized by MALDI-TOF/TOF MS. The m/z was (calculated) 4,710.6 Da and m/z was (observed) 4,806.3 Da for [M+H]+.
Preparation of Stable Fluorescein Isothiocyanate Analog
Due to the reactive nature of FITC, especially toward lysine side chains presented in proteins, a stable analogue fluoresceine thiourea (FTU), was synthesized and used as a negative fluorophore control for uptake experiments throughout the in vitro and in vivo experiments. FTU was prepared by reacting FITC with ammonium hydroxide in DMF-water (1/1, vol/vol) mixture. After evaporating the solvents and triturating the residue with cold ether, the desired product was obtained in 90% yield and over 95% purity. FTU was not used on APF and BPF since they were proven to be stable during the experiments.
Stability of Amide Bonds in MT-2 CD4+ T-Cell Culture Medium Containing 10% Fetal Bovine Serum (FBS)
MT-2 cells were maintained in RPMI medium supplemented with FBS (10%) and penicillin/streptomycin at 50 units/ml in a CO2 incubator. APF and APB conjugates at 12- and 4-fold higher concentrations than their respective IC50 values (96 µM and 350 nM) were exposed to serum-containing medium and the MT2 cells at 5 × 10⁴ cells/ml under culture conditions for 5 days. The MT-2 cells were then removed by centrifugation. Each cell-free supernatant was filtered (Microcon, MWCO 3000 Da) to separate the cleaved APV from its conjugate. The filtrates were analyzed using MALDI-TOF MS.
Cytotoxicity of NCs
Cytotoxicities of the NCs were determined using a cell viability (MTT) assay [32]. MT-2 cells were plated in 96-well plates at 5 × 10³ cells/well in triplicate in medium containing APB (0–350 nM), APF (0–11,000 nM) or APV (0–280 nM). The plates were cultured for 5 days. MTT was added to each well and the plates were incubated at 37 °C for 3 hr and absorbance was read at 570 nm. Cell viability (%) is reported as the absorbance ratio of NC-treated cells to untreated cells. The assays were performed at least three times.
PR Inhibition Activity of PEGx-APV-OH (x = 2, 5, 10, and 30 Da) in buffer
The PR inhibition activities of the NCs were measured using Sensolyte 490 HIV-1 PR assay kit (Anaspec Inc.) based on fluorescence resonance energy transfer (FRET) [33]. In a 96-well microplate, the HIV-1 PR FRET substrate (50 µL) was pre-incubated with various concentrations (0, 0.5, 1.0, 2.0, 3.5 and 5.0 µM) of unmodified APV (10 µL) at 37 °C for 10 min, following the kit’s protocol. HIV-1 PR solution (40 µL) was then added to the wells (final volume 100 µL/well, final APV concentration at 0 – 5 µM). Fluorescence intensities were immediately measured on a Tecan microplate reader (λEx/λEm = 360 nm/465 nm) at 2 min intervals until the readout was constant (~40 min). Identical experiments were performed for PEGx-APV-OH NCs at an APV-equivalent concentration of 3.5 µM. APV-O-acetyl and PEG10kDa-APV-O-acetyl were used as negative controls.
Anti-HIV-1 Activity of APB and APF in MT-2 CD4+ T Cells
The anti-HIV-1 activity was quantitatively determined in vitro using a syncytium count assay based on inhibition of HIV-1-induced cell syncytium formation [34]. Serial dilutions of APV, APF and APB in serum-containing RPMI medium (100 µL/well) were prepared in 96-well tissue culture plates. MT-2 cells (5 × 10⁴ cells/well) with or without the X-4 HIV-1 strain IIIB at 0.03 multiplicity of infection (MOI) were added to the wells. Final concentrations were: APV, 0 – 560 nM; APF, 0 −22,000 nM, and APB, 0 – 700 nM. After incubating the plates for 5 days at 37 °C, the viral-induced syncytia in each well were counted under a microscope. Each experiment was performed at least three times.
Flow Cytometry
NC uptake was assessed using Caco-2 cells (American Type Culture Collection, ATCC). The cells were cultured in Dulbecco’s Modified Eagle Medium supplemented with FBS (10%), non-essential amino acids at 1 x concentration (100 x stock solution from Invitrogen) and penicillin/streptomycin at 50 units/ml (the DMEM medium) until confluence was reached. The cells were then incubated with DMEM medium (control), DMEM medium containing 10 µM APF, or DMEM medium containing 10 µM BPF for 2hr. The cells were then trypsinized and washed with Hank’s Balanced Salt Solution (HBSS) using centrifugation. The procedure was repeated without trypsinization in suspended MT-2 cells using serum-containing RPMI medium. NC uptake was quantified using flow cytometry (Gallios, Beckman Coulter). Fluorescence intensity was recorded for 5000 cell events for each NC. Each experiment was performed at least three times.
Confocal Microscopy
MT-2 cells were incubated for 4 hr in RPMI medium containing the fluid phase endocytosis marker, tetramethyl rhodamine dextran (Rho Dex, 10 kDa, 30 µg/mL), the nuclear marker diamidino-2-phenylindole (DAPI, 5 µg/mL) and 10 µM APF or BPF. The cells were then washed with PBS by centrifugation and were re-suspended in HBSS. The cells were transferred to a chambered coverglass pre-coated with poly-D-lysine hydrobromide and washed with PBS. A similar procedure was used for Caco-2 cells except that the cells were grown on chambered coverglass for three days after confluence was reached and a monolayer had formed. To compare fluorescence localization and intensity of the NCs within cells, imaging was performed using a Leica TSC SP5 confocal microscope (Leica Microsystems CMS GmbH, Germany). Z stack images were acquired in the XYZ mode with a 40 x objective. Cell surface fluorescence was not observed in the X-Y plane. Quantification of intracellular fluorescence was carried out using LAS AF Lite (Leica Software) on each confluent Caco-2 cell monolayer or un-zoomed Z-stack image of densely packed MT-2 cells. The Z-stack images were not subject to any editing and contained over 500 cells to ensure objectivity and statistical power.
APF and BPF penetration into mouse colorectal mucosa
Male CD-1 mice were fasted overnight. Three dosing solutions consisting of 30 µM APF, BPF or FTU (the stable form of the FITC-moiety in APF and BPF serving as a control) in HBSS were prepared and 200 µl was administered rectally using a 1 ml syringe. The syringe was kept in place to serve as a rectal plug to prevent leakage of the dosed solution. The syringe was removed after 2 hr. At 2, 24, 48, 72 and 120 hr after dosing, mice were euthanized using CO2, the colorectal segment was excised, washed and the mucosa scraped. The mucosal tissue from each mouse was placed into HBSS and homogenized by passing through a 20G needle 25 times followed by centrifugation at 4000 g for 30 min. The clear supernatant was collected for measurement of fluorescence. Mucosal tissue retention was represented as the amount of APF, BPF or FTU (fmol)/tissue weight (mg).
Statistical Analysis
Results are represented as the mean ± standard deviation (SD). Statistical analyses were performed using GraphPad Prism Software, version 4.0.1 (GraphPad Software, Inc., San Diego, CA). One-way analysis of variance (One-way ANOVA) followed by Tukey’s post hoc test was performed. Non-linear curve-fitting was performed by GraphPad Prism Software using the dose-response equation. Statistical significance was determined when p < 0.05.
RESULTS
Synthesis and Characterization Studies
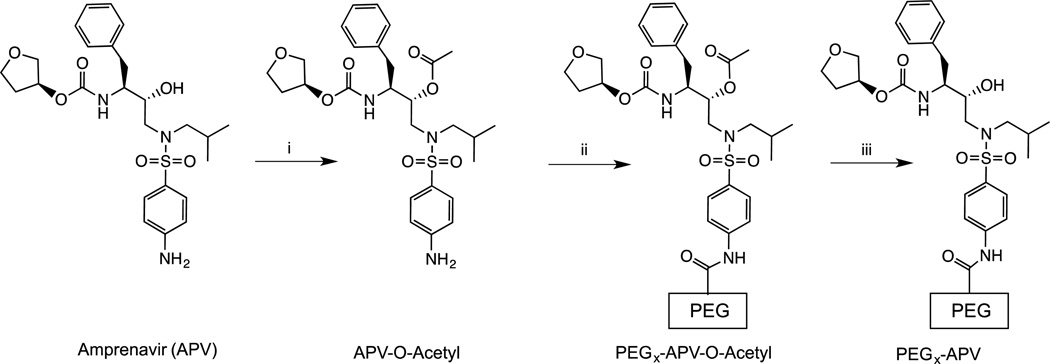
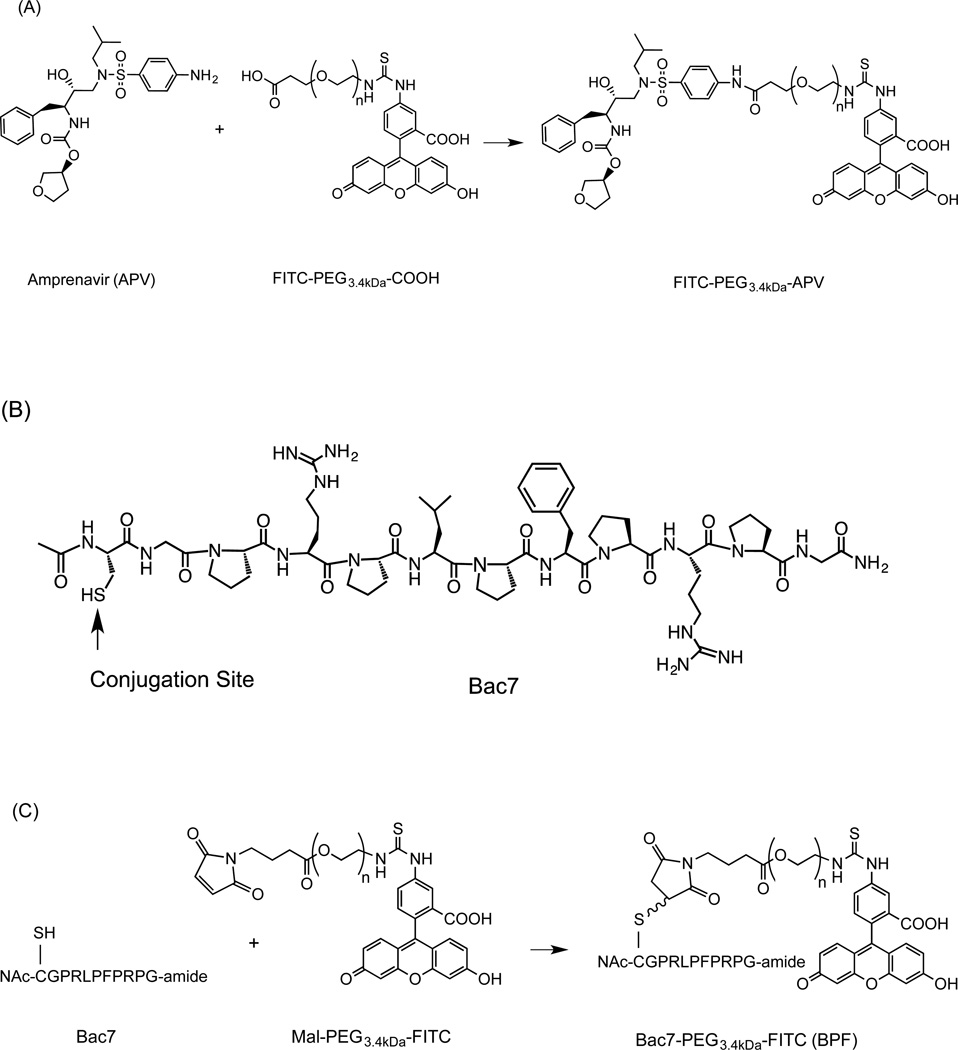
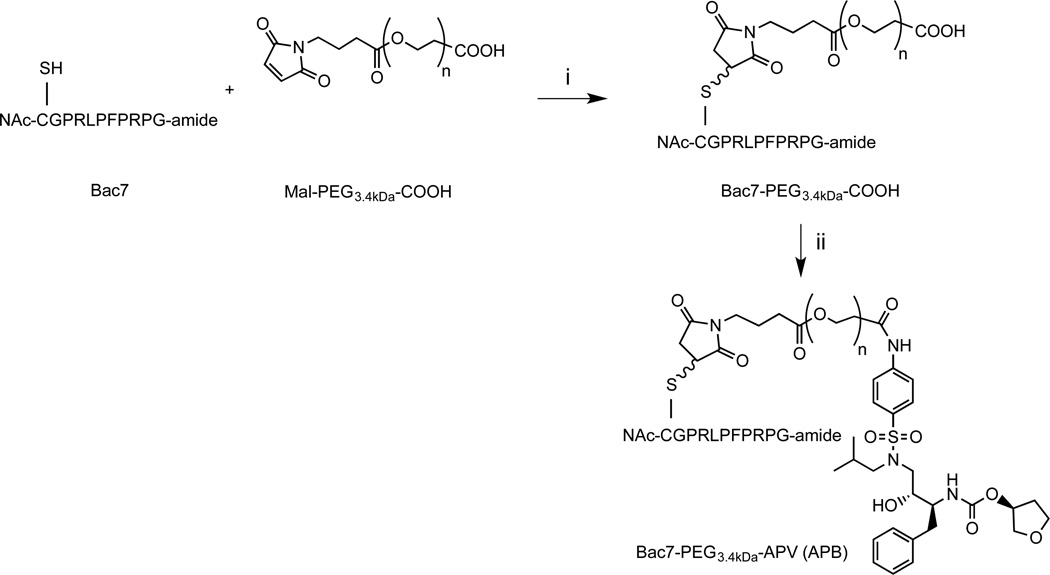
The free aliphatic hydroxyl moiety of APV was acetylated to obtain APV-O-acetyl. mPEGx-NHS polymers (x = 2, 5, 10, 30 kDa, Scheme 1) were conjugated to APV-O-acetyl. APF was prepared as depicted in Scheme 2A. The APV-PEG NC containing Bac7 was also prepared and characterized (Scheme 3). Bac7 was synthesized using Fmoc-based solid-phase peptide synthesis (SPPS) protocols (Scheme 2B). To obtain APV-PEG3.4kDa-Bac7 (APB) NC, the maleimide-PEG3.4kDa-COOH was coupled to the cysteine residue present on Bac7 via a stable thioether linkage. In the next step, Bac7-PEG3.4kDa-COOH was coupled to APV via an amide bond using a procedure similar to one described for the synthesis of FITC-PEG3.4kDa-APV. Bac7-PEG3.4kDa-FITC (BPF) was obtained by coupling maleimide-PEG-FITC to the N-Ac-cysteine residue of Bac7 peptide via a thioether linkage (Scheme 2C).
Scheme 1.
Synthesis of PEGx-APV-O-acetyl and PEGx-APV-OH nanocarrier conjugates. Reagents and conditions: (i) DMF, DIPEA, acetic anhydride, room temperature, 12 h; (ii) DMF, DIPEA, mPEGx-NHS (x = 2, 5, 10, 30 kDa), room temperature, 24 h; and (iii) 0.1 N HCl, neutralized with NaHCO3.
Scheme 2.
Synthesis of fluorescein-labeled APV-PEG (APF) and Bac7 CPP-PEG NCs (BPF): (A) APV-PEG3.4kDa-FITC; (B) Structure of Bac7 analog; and (C) Bac7 CPP-PEG3.4kDa-FITC. Reagents and conditions: (i) DMF containing EDCI and HOAt, room temperature, 16 h; and (ii) DMF, room temperature, 4 h. PEG-fluorescein is linked to APV via an amide bond and to Bac7 via a thioether bond.
Scheme 3.
Synthesis of APV-PEG3.4kDa-Bac7 CPP (APB). The cell penetrating peptide, Bac7, was linked to maleimide-PEG3.4kDa-COOH via a thioether bond. APV was linked to Bac7 CPP-PEG3.4kDa-COOH via an amide bond. Reagents and conditions: (i) DMF, room temperature, 4 h. (ii) DMF containing WSC and HOAt, room temperature, 16 h.
All NCs were obtained in high purity (≥90%, estimated using gel permeation chromatography). The NCs were characterized using MALDI-TOF mass spectrometry, and observed molecular weights were found to be in agreement with calculated values. The NCs exhibited significantly higher solubility in water than free APV.
Stability of Amide Linkage
The goal of the current study was to develop a non-releasable APV-PEG NC with high anti-HIV-1 activity. Initially, the stability of the amide bond linking APV to PEG was assessed. The APV-PEGx-OH (x = 2, 5, 10, and 30 kDa) NCs (1 µM) were incubated at 37 °C in PBS (pH 7.4) for 24 h, and the released APV was monitored using RP-HPLC. All APV-PEG NCs were found to be stable with less than 2% degradation in PBS over the time course of the study. The stability of the amide bonds in the APF and APB NCs was also assessed in the presence of MT-2 cells and serum at ~12- and 4-fold higher concentrations than their respective IC50 values (96 µM and 350 nM). The two NCs were incubated at 37°C for 5 days. The cells were then removed by centrifugation and cell-free supernatants were centrifuged using a Microcon filter (MWCO 3000) to separate the released APV from the intact NC. The filtrates were analyzed in triplicate (n=3) for APV using an anti-HIV-1 functional assay (i.e., inhibition of syncytium formation of HIV-1 infected MT-2 cells). Less than 0.08% free APV was found in the filtrates suggesting that a negligible amount of APV was released. No trace of free APV was found when the filtrate samples were subjected to MALDI TOF-MS. Thus, the amide bonds were stable during the period of exposure to MT-2 cells and serum in this study.
Cytotoxicity Studies
The cytotoxicities of APF and APB NCs were assessed using the MTT cell viability assay. MT-2 cells were incubated with various concentrations of APF, APB, and APV at 37 °C for 5 days, and the untreated MT-2 cells were used as controls. Viability in cells treated with APF, APB, and APV exhibited no statistical difference in comparison to untreated cells, at the concentrations tested (data not shown). No significant cytotoxicity was observed for APF up to 96 µM and for APB up to 350 nM, which is 12- and 4-fold higher than their respective IC50 values.
Anti-HIV-1 PR activity of APV-PEGx-OH NCs in buffer
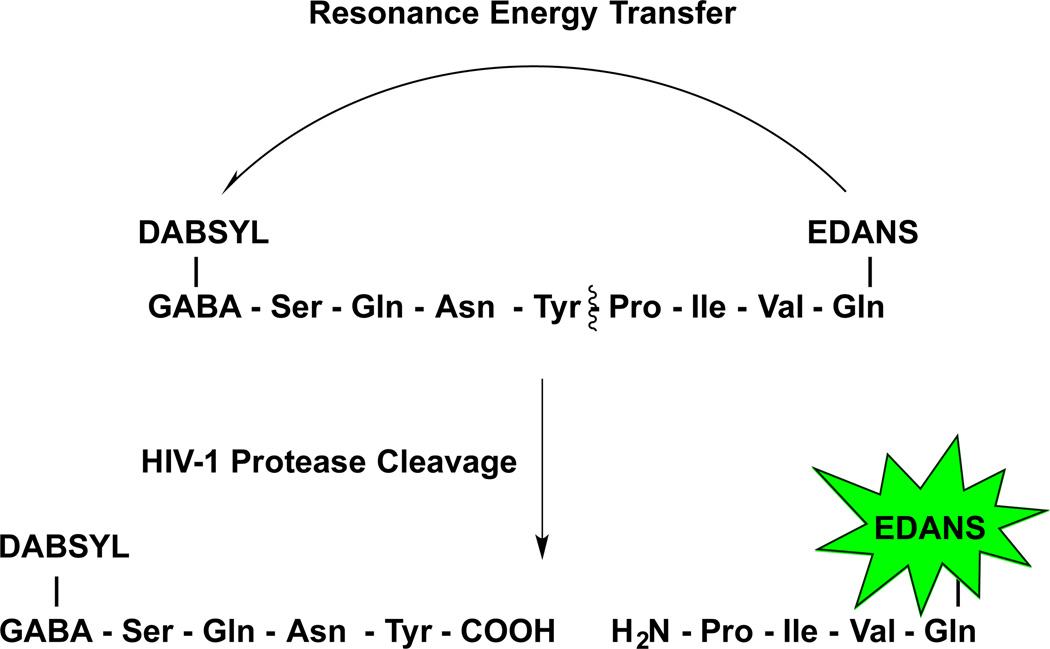
The anti-HIV-1 PR activity of APV-PEGx-OH NCs (x = 2, 5, 10, and 30 kDa) were measured in buffer using a FRET-based HIV-1 PR inhibition assay [33]. The method utilizes a quenched fluorogenic substrate, a HIV PR FRET peptide with the sequence: DABCYL-GABA-Ser-Gln-Asn-Tyr-Pro-Ile-Val-Gln-EDANS, where EDANS is the fluorophore and DABCYL is the quencher. In the absence of HIV-1 PR, the fluorescence of EDANS in the FRET peptide remains quenched, but when incubated with the recombinant HIV-1 PR at 37 °C, the peptide is cleaved leading to the recovery of fluorescence (λEx/λEm = 340nm/490 nm) (Scheme 4). However, in the presence of a PR inhibitor, like APV, the cleavage of the fluorogenic HIV-1 peptide substrate by HIV-1 PR is inhibited, leading to a decrease in fluorescence signal in a concentration-dependent manner.
Scheme 4.
FRET-based PR activity inhibition assay. Fluorescence of EDANS fluorophore is quenched by distance-dependent fluorescence resonance energy transfer (FRET) to the DABCYL quencher group, which results in an increase in fluorescence signal. In the presence of an inhibitor such as APV the cleavage of the fluorescent substrate by PR is inhibited in a dose-dependent manner, which is observed as a decrease in fluorescence intensity.
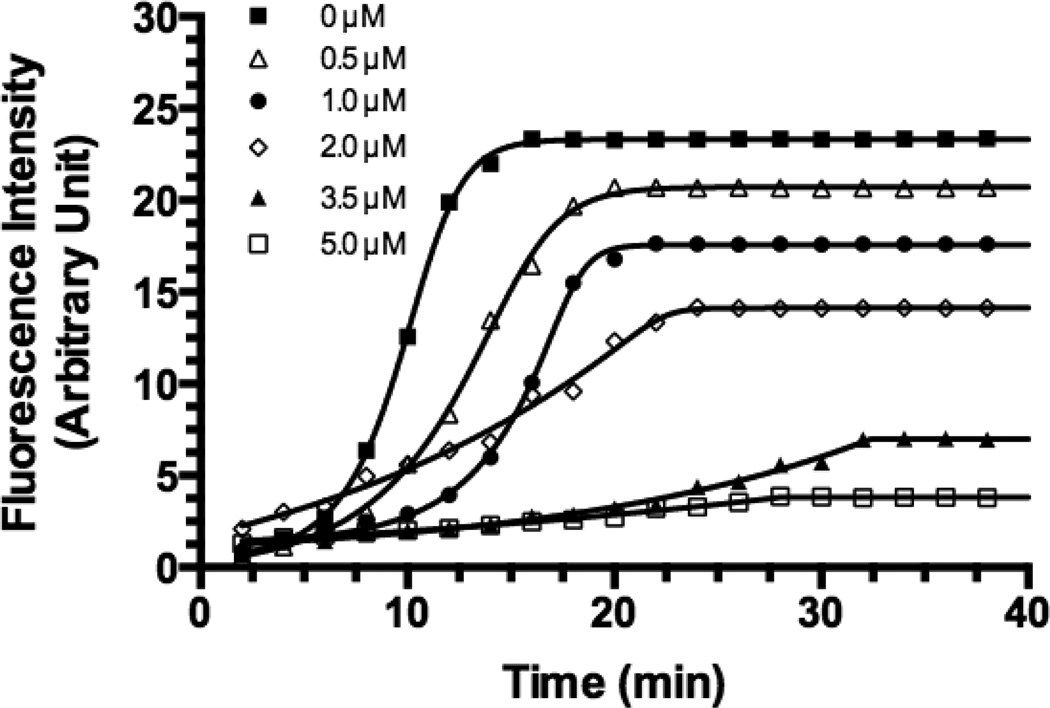
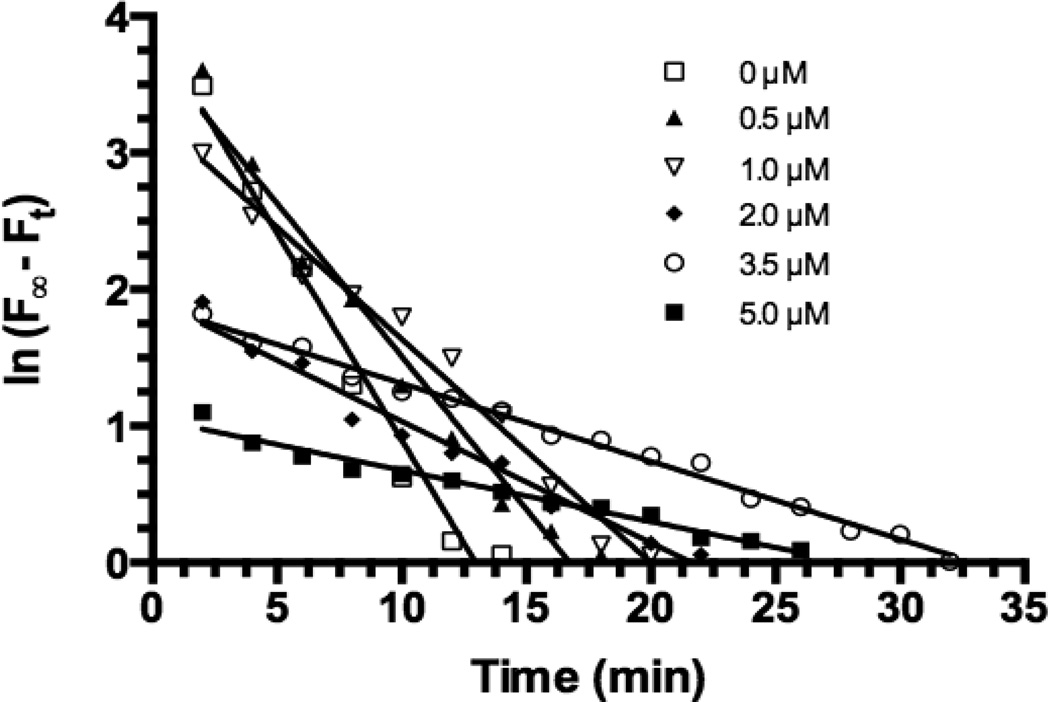
APV activity was determined at various concentrations (0 – 5 µM) and is shown in Figs. 1 & 2. 1 shows the time course of the fluorescence (F) from the FRET enzymatic reactions in the presence of various APV concentrations. Fig. 2 shows plots of ln (F∞ – Ft) against time, where F∞ is the maximum fluorescence intensity (0 µM of APV), Ft is fluorescence intensity at time t (min) and ln (F∞ – Ft) is the natural logarithm of F reduction at a given APV concentration and time. The plots of ln (F∞ – Ft) values against time yielded straight lines (linear regression R2 ≥0.9711 for all concentrations). The slope of each line represents the rate of F reduction (i.e., the rate constant, kobs, in min−1) of a FRET substrate cleavage reaction. Linear regression yielded kobs values (mean +/− s.d.) for 0 – 5 µM concentrations of APV as follows: −0.3027 (± 0.0234) for 0 µM, −0.2239 (± 0.0146) for 0.5 µM, −0.1638 (± 0.0080) for 1.0 µM, −0.0890 (± 0.0049) for 2.0 µM, −0.05704 (± 0.0014) for 3.5 µM and −0.03766 (± 0.0019) for 5.0 µM.
Figure 1. Cleavage kinetics of HIV-1 PR FRET peptide substrate (5.0µM) by recombinant HIV-1 PR (35.2 nM) at 37 °C in the assay buffer in the presence of different APV concentrations (0–5.0 µM).
All measurements were performed in triplicate and reported as mean ± SD (n = 3). The effect of APV 3.5 µM and 5.0 µM was not significantly different (p>0.05).
Figure 2. Plots of ln(F∞, -Ft) vs. time for APV (0–5 µM). The plots were prepared using the data obtained from Figure 1.
F is the maximum fluorescence intensity (0 µM of APV) and Ft is fluorescence intensity at time t (min). Linear regression analysis yielded straight lines (R2 >0.9711) and the slope of each line yields the rate constant (kobs, min−1). kobs values: −0.3027 (± 0.02341) for 0 µM, −0.2239 (± 0.01459) for 0.5 µM, −0.1638 (± 0.007995) for 1.0 µM, −0.0890 (± 0.004938) for 2.0 µM, −0.05704 (± 0.00144) for 3.5 µM, and −0.03766 (± 0.00191) for 5.0 µM.
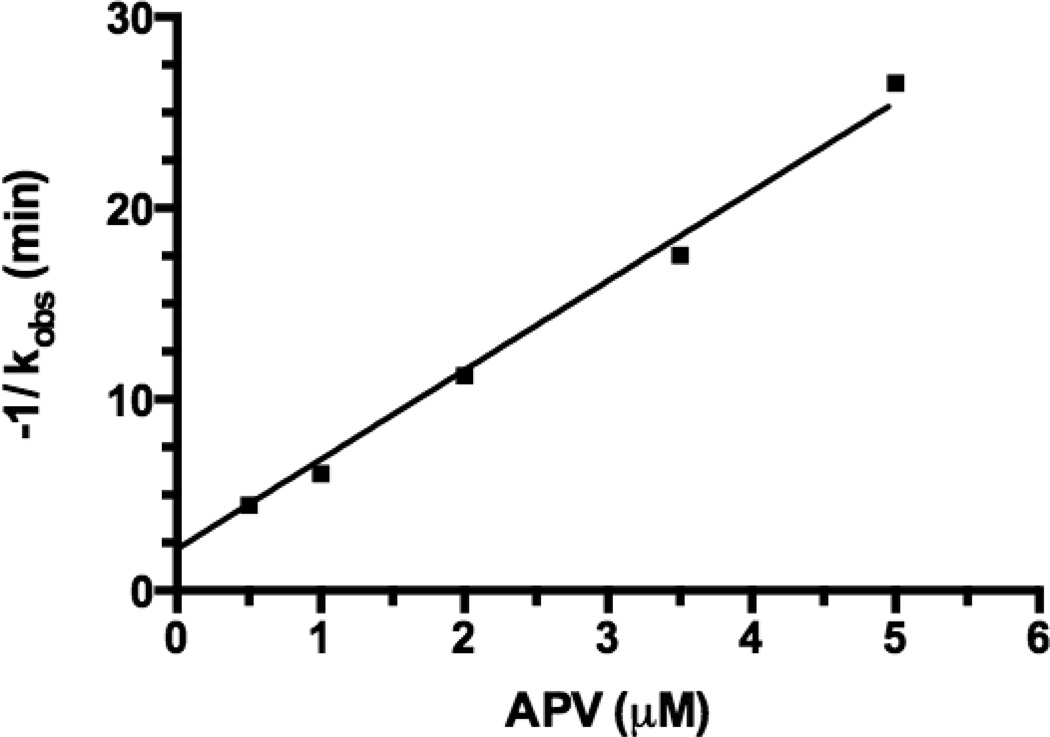
Since APV loses some activity after being linked to PEG, pilot experiments were carried out to determine a concentration that was optimal for comparing APV activity to PEGx-APV-OH NCs (x = 2, 5, 10, and 30 kDa) and the respective negative controls (APV-O-acetyl and PEG10kDa-APV-O-acetyl). The free -OH group on APV, which is necessary for anti-HIV activity, was blocked using acetylation for the two negative controls. The largest decrease in F (Fig. 1) was observed in the presence of 3.5 and 5 µ APV even though there was no significant difference between the two concentrations (p>0.05). Therefore, the comparison was made at 3.5 µM APV. HIV-1 PR inhibition activity is defined as the negative reciprocal of the rate constant [−(1/kobs)]. In Fig. 3, plots of [−(1/kobs)] derived from Fig. 2 versus APV concentrations are shown. APV activity increases linearly with increasing concentration. Regression analysis of the data indicates a straight line (R2 = 0.9858). Therefore, Fig. 3 was used as a standard curve to determine the apparent APV concentration (APVapp) for NCs. The APVapp value is derived for an APV NC at 3.5 µM by referring to a concentration of APV in Fig. 3 that has the same −(1/kobs) value as the APV conjugate.
Figure 3. Plot of negative reciprocal of observed rate constant (−1/kobs) vs. APV concentrations.
The −1/kobs value increased with APV concentration in a linear manner (R2 = 0.9858), which reflects the anti-HIV-1 PR activity of APV or an APV-PEG NC. This figure was used to derive the apparent APV concentration (APVapp) values for APV and each APV-PEG NC, all at 3.5 µM. The APVapp value was used as an indicator of anti-HIV-1 PR potency to compare APV with different APV-NCs (cf. Table 1).
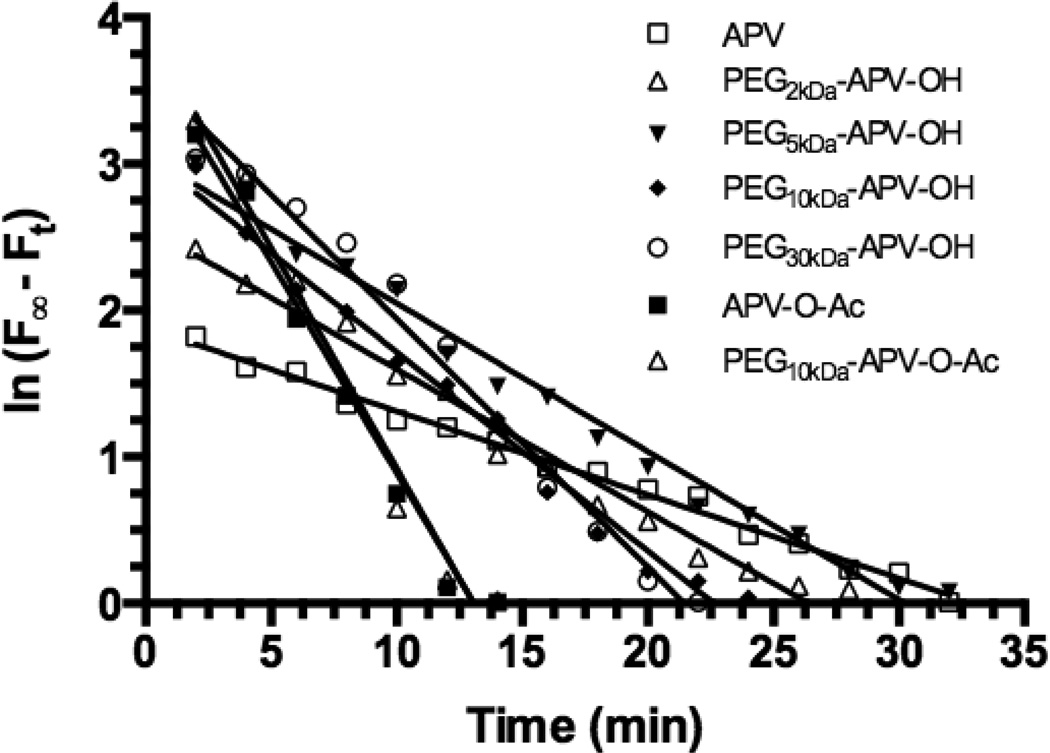
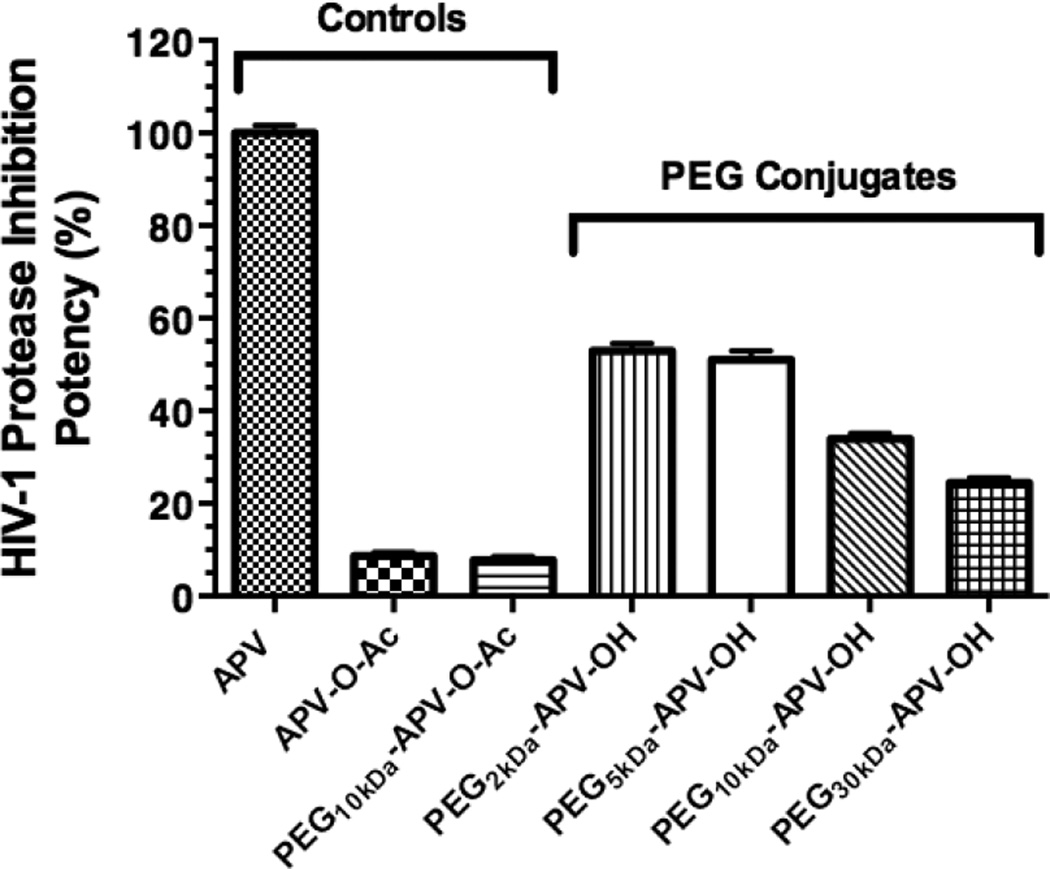
Fig. 4 shows the natural log of fluorescence reduction (ln(F∞ – Ft)) versus time (R2 values ≥ 0.9773) for 3.5 µM APV and 3.5 µM-equivalent concentrations of various PEG NCs, applying the same mathematical treatment to the experimental data as described previously. The kobs values were then converted to [−(1/kobs)] and the latter values were converted to their APVapp values using Fig. 3 (cf. Table 1). Fig. 5 shows the relative HIV-1 PR inhibition activity represented by the APVapp values relative to the activity of APV. The APV reference value is taken as being 100% potent. The figure shows that the PEGx-APV-OH NCs prepared using 2-and 5-kDa PEGs exhibited 53% and 51% of APV potency, whereas NCs prepared using 10- and 30-kDa PEGs exhibited 34 and 24% of APV potency, respectively. The two negative controls were nearly inactive (9% and 8% of free APV potency). Thus, NCs prepared using smaller-sized PEGs retained half of APV potency compared to the reference, whereas the larger-sized PEG NCs suffered a greater loss in potency. Therefore, for the initial evaluation of the PrEP strategy (i.e., mucosal retention) the PEG size selected for PEGx-APV-OH NCs was 2 – 5 kDa.
Figure 4. Plots of ln (F∞Ft) vs. time for APV, PEG-APV NCs and the two negative controls, all at 3.5 µM APV-equivalent concentrations.
Linear regression analysis yielded straight lines (R2 ≥0.9655) and the slope of each line yields the rate constant (kobs, min−1). The kobs values are: −0.05704 (± 0.001439) for APV, −0.09743 (± 0.004131) for PEG2kDa-APV-OH, −0.1011 (± 0.003616) for PEG5kDa-APV-OH, −0.1358 (± 0.005545) for PEG10kDa-APV-OH, −0.1695 (± 0.008027) for PEG30kDa-APV-OH, −0.2886 (± 0.01815) for APV-O-Ac, and −0.3013 (± 0.02051) for PEG10kDa-APV-O-Ac. The kobs values were converted to [−1/(kobs ± s.d.)] that were fitted into the linear regression equation derived from Fig. 3 to yield the apparent APV concentration (APVapp) values for APV and APV-PEG NCs. APVapp values (µM): 3.288 (± 0.095) for APV, 1.737 (± 0.093) for PEG2kDa-APV-OH, 1.678 (± 0.109) for PEG5kDa-APV-OH, 1.117 (± 0.064) for PEG10kDa-APV-OH, 0.804 (± 0.060) for PEG30kDa-APV-OH, 0.285 (± 0.047) for APV-O-Ac, and 0.254 (± 0.049) for PEG10kDa-APV-O-Ac.
Table 1.
HIV-1 PR inhibition activity of APV-PEG NCs
| Compounda | Mean Rate Constant* (kobs, min−1) |
APVapp(µM) | HIV-1 PR Inhibition Activity (%) |
|---|---|---|---|
| Free APV (positive control) | −0.057 | 3.30 | 100 |
| PEG2kDa-APV-OH | −0.097 | 1.73 | 53 |
| PEG5kDa-APV-OH | −0.101 | 1.68 | 51 |
| PEG10kDa-APV-OH | −0.136 | 1.12 | 34 |
| PEG30kDa-APV-OH | −0.170 | 0.80 | 24 |
| APV-O-acetyl (negative control) | −0.289 | 0.28 | 9 |
| PEG10kDa-APV-O-acetyl (negative control) | −0.301 | 0.25 | 8 |
All APV compounds tested in the PR inhibition assay contained 3.5 µM APV equivalents
The kobs in absence of any inhibitor is −0.303 min-1.
Figure 5. Effect of PEG size on the HIV-1 PR inhibition potency of APV-PEG NCs.
All NCs were tested at APV-equivalent concentration of 3.5 µM. The potencies expressed as the apparent APV concentrations (APVapp) derived from Fig. 3 and 4 were referenced to the potency of APV (the APV reference being 100% potent). One-way ANOVA analysis followed by Tukey multiple comparison test were performed. Except for the comparison between PEG2kDa-APV-OH and PEG5kDa-APV-OH and between the two negative controls (APV-O-Ac and PEG10kDa-APV-O-Ac) (p>0.05), all other pair-wise comparisons were highly statistically different (p<0.01). Specifically, each NC’s potency differed from that of either the positive control or either one of the two negative controls (p<0.01) and the potency of PEG2kDa-APV-OH/PEG5kDa-APV-OH differed from either that of PEG10kDa-APV-OH or that of PEG30kDa-APV-OH (p<0.01).
PEG conjugation ablated anti-HIV-1 activity in T-cells while further conjugation with Bac7 restored activity
As indicated in Fig. 5, PEGx-APV-OH (x = 2 – 5 kDa) NCs retained half of APV’s ability to inhibit HIV-1 PR when tested with the FRET-based assay in buffer. However, their activity in suppressing HIV-1 replication in MT-2 T-cells was very low, suggesting that the PEGx-APV-OH was unable to enter cells efficiently. To address the issue of low cell penetration, another NC, APV-PEG3.4kDa-Bac7 (APB) was synthesized by conjugating PEG3.4kDa-APV to Bac7, as described earlier (Scheme 3).
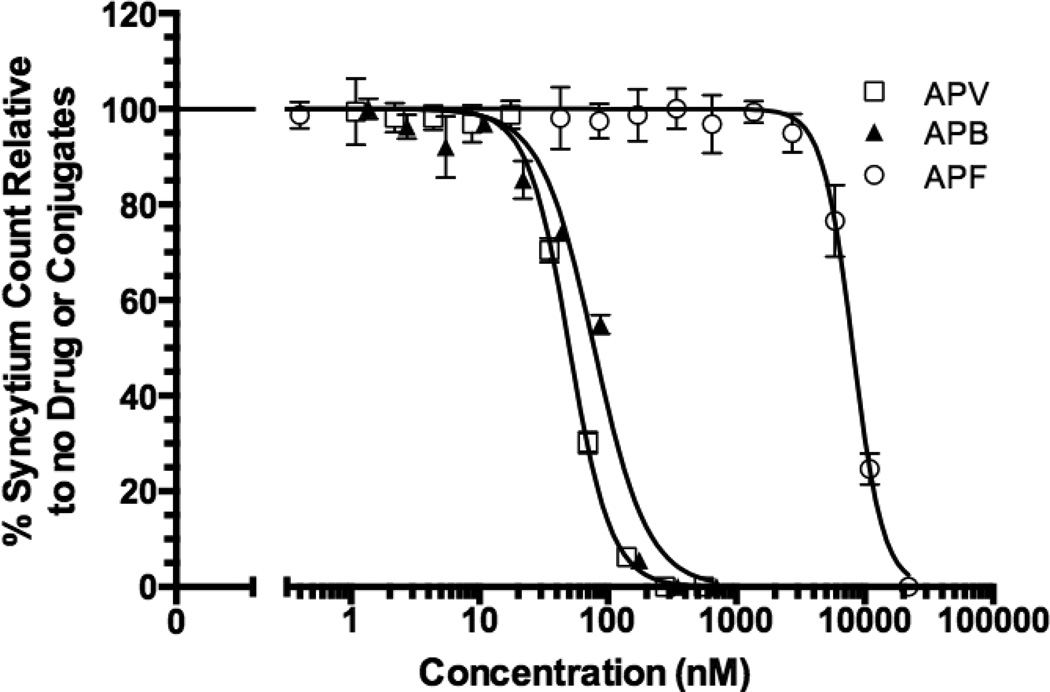
The anti-HIV-1 activity of APF and APB NCs were investigated in human CD4+ MT-2 T-cells infected with an HIV-1 X-4 strain, IIIB. Infection of the cells with enveloped HIV-1 virus leads to the formation of syncytia (cells fusing together to form large multinuclear cells). The anti-HIV-1 activities were assessed by scoring the reduction in syncytia formation in infected cells in the presence of the NCs. Other anti-HIV-1 assays such as reducing in viral p24 capsid protein production and cell viability were performed, but the well-to-well variability in the results was greater than the syncytium assay. Therefore, the syncytium assay was adopted for these studies. Statistical analysis was conducted after normalization of treatment groups to untreated wells (Fig. 6). The APF NC exhibited greater than a 160-fold decrease in activity (IC50 = 8064 nM) compared to APV (IC50 = 50.29 nM) suggesting that PEG3.4kDa-APV-OH was unable to access HIV-1 PR located in the cytosol. APV-PEG3.4kDa-Bac7 exhibited anti-HIV-1 activity (IC50 = 78.29 nM) that was similar to free APV (p>0.05). Incorporation of Bac7 in the NC, therefore, effectively overcame the lack of cell permeability observed with PEG3.4kDa-APV-OH. Since current results demonstrate that the amide bonds linking APV to PEG are stable under the conditions used in these studies, the observed anti-HIV-1 activity was due to intact APB.
Figure 6. Anti-HIV-1 activity of APV-PEG3.4kDa-Bac7 CPP (APB), APV-PEG3 4kDa-FITC (APF) and free APV.
The anti-HIV-1 activity was determined by the inhibition of syncytium formation in HIV-1 infected MT-2 T-cells and expressed as % of syncytium count of no treatment. Non-linear curve-fitting using the dose-response equation was used to determine the IC50 values. The R2 values of the curve fitting are 0.9672 for APV, 0.9067 for APF and 0.9511 for APB. APF activity (IC50 = 8064 nM) was significantly lower than APV (IC50 = 50.29 nM) (p<0.001). Further conjugation with Bac7 CPP (i.e., the APB NC, IC50 = 78.29 nM) almost completely restored APV activity with no significant difference in IC50 values (p>0.05). Data are reported as mean ± SD of three independent experiments.
Flow Cytometry and confocal microscopy
To study the intracellular fate of APB, a fluorescein-labeled analog, FITC-PEG3.4kDa-Bac7 (BPF) was synthesized by replacing APV with a surrogate fluorescent molecule, FITC. While APB contained 10.5% (w/w) APV, BPF contained 8.1% (w/w) FITC. Thus, both have the same PEG3.4kDa-Bac7 component that constitutes a comparable ~ 90% of total weight. (Scheme 2C). Flow cytometry and confocal microscopy were performed in human Caco-2 and MT-2 cells to compare the extent of uptake of APF and BPF into representative mucosal epithelial cells and target T cells, respectively.
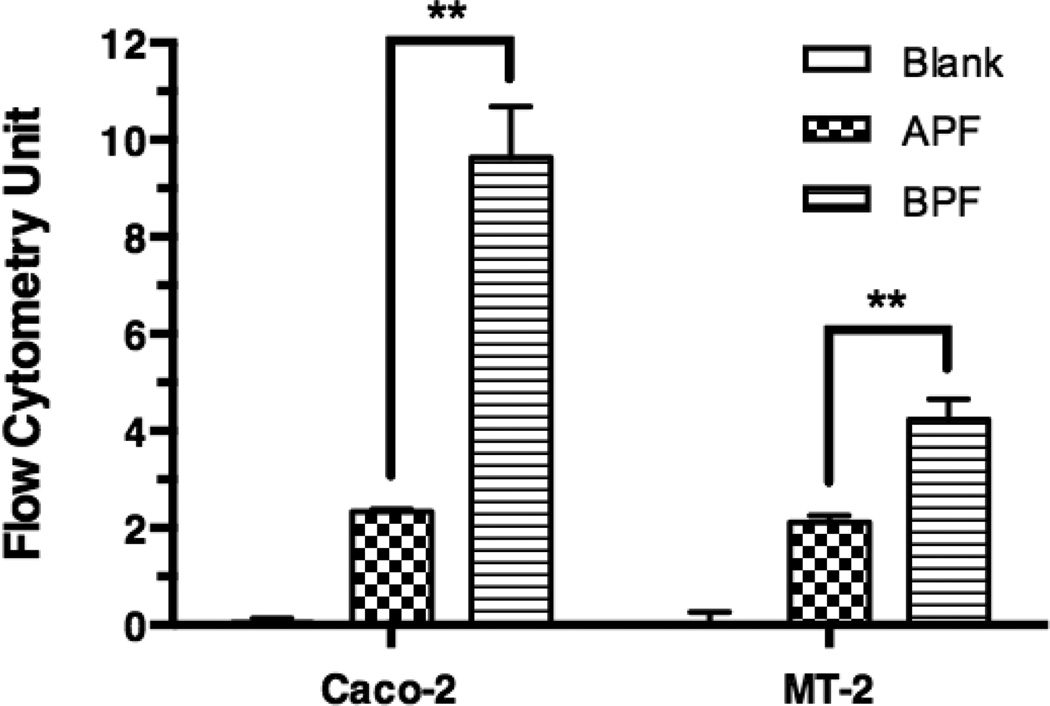
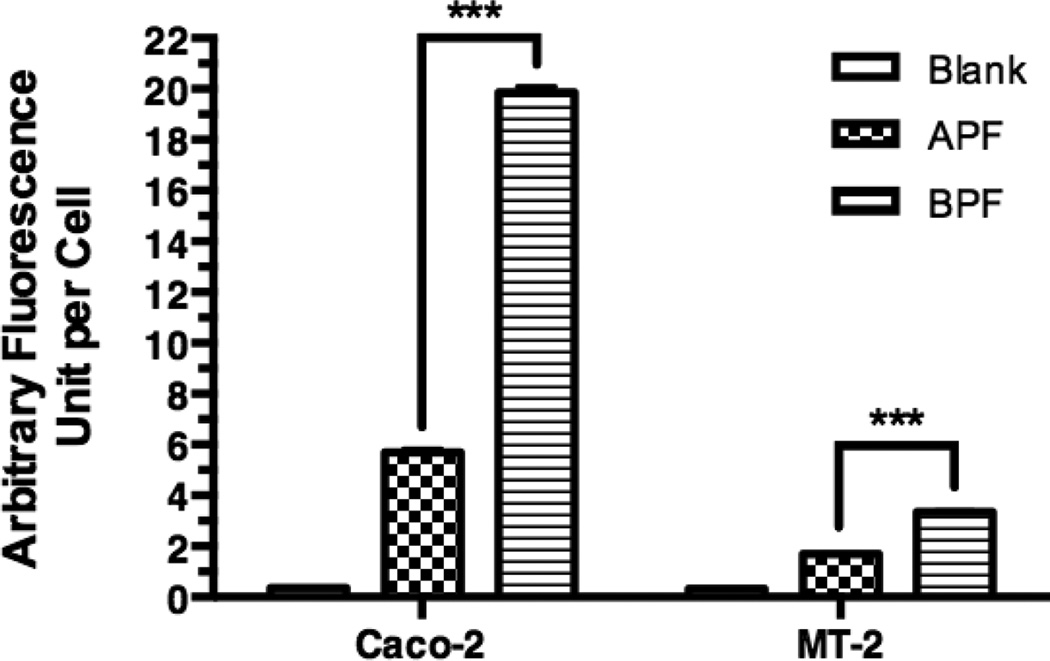
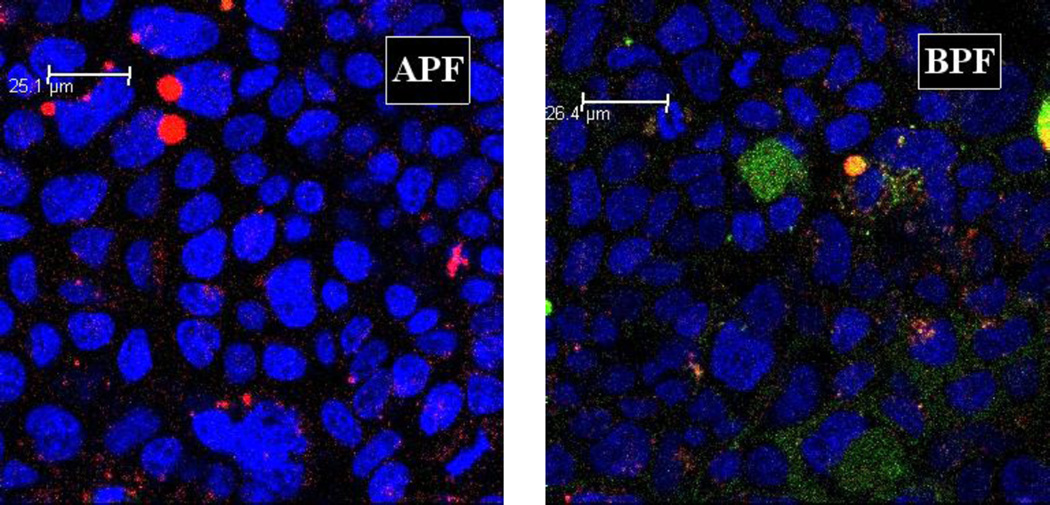
For flow cytometry, Caco-2 cells or MT-2 cells were incubated with the culture medium containing no NC (control), 10 µM APF or 10 µM BPF. Fig. 7 shows the total cell-associated BPF fluorescence intensity in Caco-2 cells was 4.1 fold higher than APF and 2.0 fold higher in MT-2 cells, which is consistent with the superior anti-HIV-1 activity of APB over APF in MT-2 cells. The intracellular uptake of the APF and BPF was also investigated using confocal microscopy (Fig. 8 and 9). Significantly less intracellular fluorescence was observed in MT-2 cells as compared to Caco-2 cells (image not shown) consistent with the flow cytometry data. The observed fluorescence was exclusively intracellular since no cell surface fluorescence was observed in the XY-plane. Fig. 8 shows that the intracellular fluorescence intensity of BPF in Caco-2 cells was 3.5-fold higher than APF and 2.0-fold higher in MT-2 cells, consistent with the flow cytometry and in vitro anti-HIV-1 activity results. Note that the absolute total cell-associated fluorescent intensities of APF and BPF were 3- and 6-fold higher in Caco-2 cells than in MT-2 cells, respectively, suggesting Caco-2 cells have higher uptake capacity than MT-2 cells. Because of the low absolute fluorescence levels of APF and BPF in MT-2 cells, clear ascertainment of punctate (vesicular) vs. diffuse (cytosolic/nuclear) localization was not possible. In Fig. 9, a 2.47x-zoomed, blue/green/red merged image of Caco-2 cells from a middle section of its Z-stack is shown. No punctate orange color resulting from co-localization of FITC and Rho-Dex (the fluid endocytosis marker) was observed. The undetectable BPF in intracellular endosomes/lysosomes (no orange color) and detectable BPF as the intracellular green fluorescence are mostly due to the cytosolic localization of the NC. Combined with the anti-HIV-1 activities of APF and APB in MT-2 cells, confocal microscopy suggests that APF did not efficiently enter the cells, while APB entered the cytosol efficiently without being trapped in endosomes. The results also suggest that the main mechanism responsible for Bac7-assisted cell entry of the PEG-APV NC is either direct translocation across the plasma membrane, or endocytosis followed by very efficient endosomal escape.
Figure 7. Total cell-associated fluorescence levels of NCs in Caco-2 and MT-2 cells as measured by flow cytometry.
Caco-2 cells and MT2 cells were incubated with medium (Blank), 10 µM of APF, or 10 µM BPF for 2 h and washed before flow cytometry. The total cell-associated fluorescence levels are mean ± s.d. of at least of two independent experiments. One-way ANOVA analysis followed by Tukey multiple comparison test were performed. The symbol “**” indicates that the fluorescence level of BPF in both cell types was significantly higher than that of APF (p < 0.01).
Figure 8. Intracellular levels of NCs in Caco-2 cells and MT-2 T-cells as measured by confocal microscopy.
Caco-2 cells and MT-2 cells were incubated with medium (Blank), 10 µM of APF, or 10 µM BPF for 4 h and washed before confocal microscopy. A 40 × objective was used for the acquisition of Z-stack of images in the XYZ mode for each treatment. Quantification of intracellular fluorescence levels used LAS AF Lite (Leica Software) on non-edited entire stacks of images (sections) that contained more than 500 cells per stack. Each value is the mean ± s.d. of fluorescence of an entire stack of 13 to 17 sections. One-way ANOVA analysis followed by Tukey multiple comparison test were performed. The symbol *** indicates that the fluorescence level of BPF in both cell types was significantly higher than that of APF (p < 0.0001).
Figure 9. Confocal microscopic images of Caco-2 cells incubated with APF (left) or BPF (right) at 2.47 × magnification.
Caco-2 cells three days after confluence were treated as described in Fig. 8. A middle section in a stack is shown. Each image was merged from three separate blue, green and red images of the same field. Two features are clear. The first is the sharp contrast between lack of green intracellular fluorescence in APF-treated cells (APF) and significant green intracellular fluorescence in BPF-treated cells (BPF). The second one is lack of co-localization of green and red fluorescence in the BPF image, indicating that most intracellular green fluorescence was located in the cytosol/nucleus compartment. Note in the APF image there are a few blobs of red fluorescence at the upper-left corner that are likely to be artifacts of cell debris.
NC penetration and retention in mouse colorectal mucosa
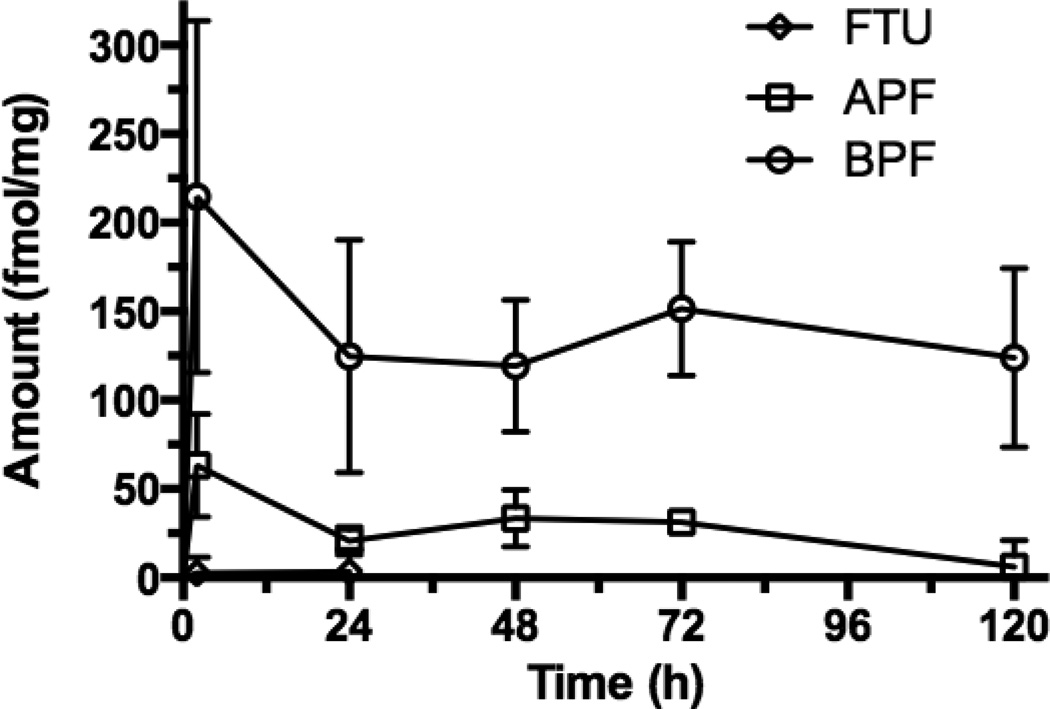
The FTU mucosal tissue concentration was negligible at 2 h and 1 d suggesting that no uptake occurred or possibly that systemic absorption was rapid and FTU was completely cleared from the tissue (Fig. 10). APF (i.e., the NC without the Bac7) concentrations were low during the entire study. BPF tissue concentrations were significantly higher and also persisted for the 5 days of the study. This time period exceeded the typical epithelial turnover time in mice (2–3 days) suggesting BPF transport and retention in the lamina propria of the colorectal mucosa. The average BPF tissue concentration on Day 5 was 124 fmol/mg, or 2.1% of the initial dose. On Day 5, the BPF tissue concentration was 21-fold higher than APF demonstrating the importance of Bac7 in promoting colorectal mucosal uptake.
Figure 10. Retention of PEG-conjugated and Bac7 CPP-conjugated BPF in mouse colorectal mucosa.
Mice treated with 200 µl enema containing 30 µM FTU, APF or BPF for 2h. Colorectal mucosa tissue was scrapped, homogenized, spun and the fluorescence of the supernatant was quantified, converted to fmole, normalized by mucosa tissue weight. Tissue retention was examined for up to 5 days, BPF is greater than APF at all time points (One way ANOVA p < 0.05, n = 4).
DISCUSSION
A drug delivery strategy incorporating CPP-ARV drug-polymer nanocarrier conjugates was designed and evaluated in the current study. The goal was to sustain ARV drug concentrations in the colorectal mucosa by increasing ARV residence time in the submucosa. Oral or parenteral PrEP dose forms are at various stages of development with Truvada representing the only PrEP drug product approved to date. While there are distinct advantages to maintaining constant plasma ARV drug concentrations, there are also significant limitations such as patient adherence to chronic dosage regimens and therapy-limiting side effects due to constant systemic ARV exposure. In order to address this, long acting/extended release (LA/ER) treatments for PrEP are being proposed and evaluated that will result in infrequent dosing with long dosing intervals making administration convenient for patients resulting in improved adherence. Two formulations, a LA/ER injectable Non-nucleoside Reverse Transcriptase Inhibitor (NNRTI) rilpivirine (LA-RPV) and an HIV Integrase Strand Transfer Inhibitor (InSTI), LA/ER injectable cabotegravir (LA-744), have been developed and are currently undergoing clinical testing [35–37]. Although these and similar technologies will address patient adherence issues, the clinical implications of chronic systemic ARV exposure remain unknown. Progress has been made in local/topical delivery of ARVs to the vaginal and colorectal mucosae [38, 39]. These topical products, also known as microbicides, deliver ARVs through the rectum or vagina and act in the lumen or in the respective mucosal tissues. However, given the nature of ARVs they are rapidly cleared from tissue and require frequent dosing. Intravaginal films and rings have demonstrated the ability to deliver ARVs vaginally for prolonged periods but require the chronic presence of the dose form in the vagina [40, 41]. In the current study, a colorectal mucosal approach is proposed that we refer to as mucosal PrEP (mPrEP) since the site of retention (i.e., depot) is not located in the rectal or vaginal lumen and the ARV does not enter the tissue from the systemic circulation.
In the current study, the concept of prolonging tissue ARV exposure by reducing ARV elimination rather than sustaining its release is evaluated. However, the approach can be applied to other nanocarriers such as nanoparticles that could deliver drug for prolonged periods. The HIV-1 PR inhibitor APV was selected as a model ARV since it could be conjugated to the NC via the amino functionality of the benzenesulfonamide moiety allowing it to retain anti-HIV activity [30]. APV inhibits the vast majority of clinical HIV mutants by binding to the more conservative protein (enzyme) backbone than the variable amino acid side-chains. Although APV is no longer a first line treatment for HIV infection, it serves well as a model ARV since the approach can also be applied to darunavir (DRV, Prezista), a widely used potent analog that has the same amino and hydroxyl functional groups, as well [42]. The set of APV derivatives studied includes controls such as APV-OAc (an O-acetylated compound with the hydroxyl function blocked preventing binding to HIV PR) and PEG10kDa-APV-OAc (a N-conjugated and O-acetylated analog to study the PEG-conjugation effect with a blocked hydroxyl function). Conjugation of PEG polymers to drugs has been extensively investigated with the objective of increasing drug retention in the body. In each of these cases; however, the conjugate is inactive and the drug must be released in order to exert its therapeutic effect [17]. In essence, the PEG polymer conjugate forms a blood circulating depot that slowly releases drug thus prolonging body exposure to the drug and dramatically reducing dosing frequency. The influence of PEG size on the anti-HIV-1 activity of APV was investigated first. The PEGx-APV-OH NCs were prepared using 2, 5, 10 and 30 kDa PEGs and anti-HIV-1 PR activity was measured in buffer using FRET-based PR inhibition assay. It was observed that APV retained about half of its original anti-HIV PR activity for PEGs up to 5 kDa in size. In another experiment, fluorescently labeled 3.4 kDa PEG APF NC exhibited a 160-fold reduction in anti-HIV-1 activity in human CD4+ MT-2 T-cells (IC50 = 8.064 µM) compared to free APV (IC50 = 50.29 nM), suggesting that poor cell penetration may be responsible as the PEG-conjugated APV needs to enter cells to exert its anti-HIV-1 activity. Therefore the PEG size suitable for the proposed mPrEP strategy was found to be relatively small (2 – 5 kDa) as opposed to the large size (~ 30 kDa) of PEG used for current FDA-approved, intravenously administered drugs based on the following rationale. First, the size is far above the ~ 0.4 kDa threshold below which acute PEG toxicity has been observed [43], but much smaller than the size (≥ 30 kDa) at which PEG ends up accumulating in lysosomes [44],[45], reminiscent of a “lysosomal storage disease” [46]. Second, PEG-conjugation has been reported to make a P-glycoprotein (P-gp)-substrate circumvent P-gp-mediated efflux [47], [48], [49], [50]. Third, NPs densely coated with lower molecular weight PEGs (2 – 5 kDa) have been reported to traverse the human cervicovaginal mucus barrier [51] since it appears to mimic the surface of viruses that can easily pass through human mucus linings. The surface of these viruses feature charge neutrality and lack a hydrophobic patch [52].
CPPs have been widely used to facilitate intracellular drug delivery and hundreds have been investigated to date [25, 53]. The most frequently studied class of CPPs is the Arg-rich category, of which Tat CPP is the prototype. However, Arg-rich CPPs tend to enter cells by endocytosis becoming trapped endosomes especially when they are conjugated to polymers such as PEG [54–56]. Few endosomal escape schemes have been developed [56] and some even require radical changes such as the introduction of primary amino groups in the polymer moiety. There are other CPPs, such as the Pro-rich CPPs, which includes Bac7, that apparently enter cells in an endocytosis-independent manner [28, 29]. It is noteworthy that in a side-by-side comparison with the Arg-rich prototypic Tat CPP, Bac7 was found in the cytosol while Tat CPP was trapped in endosomes [29]. Intracellular delivery to the cytosol/nucleus compartment is important for the proposed mPrEP strategy as most current ARV drugs target the intracellular compartment as opposed to the vesicular (endosome/lysosome/endoplasmic-reticulum) compartment that is topologically equivalent to the extracellular space.
BPF intracellular fluorescence intensity in Caco-2 cells, a human in vitro intestinal mucosal epithelial model, was significantly greater than APF, which lacked Bac7, and was diffuse as well indicating direct cellular entry of BPF (Fig. 7–9). This in direct contrast to a study that reported after conjugation to a 1.3 kDa linear PEG, PEG-TAT entered CHO-K1 cells by endocytosis, was trapped in endosomes and was unable to reach the cytosol [54]. It is remarkable that Bac7, a short 10 amino acid peptide, is able to deliver a polymeric cargo into the cytosol with almost the same efficiency as a 29-residue chimeric CPP that consisted of a 11-residue TAT CPP and a 18-residue membrane disrupting peptide [55]. In that study, the membrane-disrupting peptide was apparently used to facilitate endosomal escape.
Further supporting the observation of direct cell entry were the current HIV results. Bac7 covalently linked to PEG3.4kDa-APV (i.e., APB NC) showed anti-HIV-1 potency (IC50 = 78.29 nM) close to free APV (IC50 = 50.29 nM) in MT-2 T-cells, a model representative of HIV target T cells. These results also suggest very efficient cellular (cytosolic) entry of APB. Since APB differs from APF mainly by the presence of covalently attached Bac7, the promising outcomes with this NC suggest that Bac7 is able to completely negate the inability of PEG to penetrate the plasma cell membrane.
In colorectal mPrEP, the most important anatomic site is the lamina propria located beneath the epithelium in the submucosa. This is because the majority of HIV target CD4+ cells required for HIV transmission (e.g., T cells, dendritic cells and macrophages) are found in the LP. In addition, the establishment of infected founder cells and their expansion and subsequent spreading to systemic sites takes place in the LP [8]. Another reason for establishing persistent drug concentrations inn the LP rather than the epithelial cells is the relatively short turnover time of colonic epithelial cells in rodents (2–3 days) and humans (3–8 days) [57]. Once the cells slough off, the drug would have to be administered once again to re-establish effective anti-HIV local concentrations. On the other hand, if the NCs are retained in the LP, it would not be subjected to clearance by epithelial cell removal. As seen in Fig. 10, the BPF signal is significantly higher than APF and persists for the entire 5-day study. BPF residence significantly exceeded mouse epithelial turnover suggesting that the NC translocated across the epithelial cell layer and was retained in the LP. This is especially suitable for HIV drug delivery to the intestinal mucosa, which is the critical anatomic site for CD4+ T cell depletion, viral replication and persistence [58, 59]. Although not yet evaluated, this technology could be applied to particulate carriers such as NPs whereby they form a traditional sustained release drug delivery depot. Even though the diffusion of particulate carriers across intestinal mucus barriers is known to be size and charge dependent, the NC evaluated in the current study is relatively small and was able to traverse the mucus barrier [19, 20]. Interestingly, the PEG size utilized for the current NC was also found to be optimal for facilitating NP translocation across the mucus layer [51].
The current approach can be applied to structurally similar compounds of APV such as DRV. In addition, several other ARVs have amino groups that are compatible with the chemical derivatization process presented in this study. Examples include the active pharmaceutical ingredients (APIs) of Truvada, tenofovir and emtricitabine, which are widely used in HIV PreP. Although these APIs are completely structurally different from APV or DRV, their aromatic amino functional groups can be used to make peptide or carbamate linked conjugates as shown in patents describing prodrugs for TNF and FTC[60, 61]. The single or multivalent drug conjugation strategy will allow us to develop combination treatments using several ARVs for mPreP.
In summary, a colorectal mPrEP drug delivery strategy incorporating CPP-ARV-polymer NCs was designed and evaluated in the current study. The goal was to attain and prolong ARV concentrations in the colorectal mucosa by increasing ARV residence time in the submucosa after rectal administration. Current ARVs like APV are small molecule drugs that, after entering the submucosa, are quickly cleared from the tissue into the blood circulation. To overcome rapid drug clearance from the tissue, frequent administration is required. Truvada, the only currently FDA-approved product for PrEP, is given orally every day resulting in chronic systemic drug concentrations into order to maintain effective TDF and FTC concentrations at strategic sites. While Truvada is considered a major breakthrough in the field since it firmly establishes the concept of PrEP, improvements are needed to reduce dosing frequency to increase patient adherence and reduce systemic exposure in order to reduce the potential for therapy limiting side-effects. The current mPrEP strategy aimed to increase APV colorectal mucosal tissue residence time thereby effectively retaining ARVs locally in the tissues resulting in lower systemic exposure. APV was covalently conjugated to PEG to slow its removal from cells, which significantly reduced its uptake into cells. Further conjugation to Bac7 enabled cell uptake and a near complete restoration of anti-HIV activity. For this study the readily available ARV amprenavir was utilized as a model drug. However, the approach can be applied to the newer and much more potent close structural analog darunavir as well as tenofovir and emtricitabine. Applying the technology to vaginal delivery would require a modification of the approach to accommodate the thicker vaginal mucosa as well as the different luminal environment. While colorectal mPrEP proof-of-concept/feasibility was established in this study, several challenges remain including the development of suitable and patient friendly rectal dose forms to deliver the NCs to the colorectal mucosa.
Acknowledgments
Financial support from NIH MERIT R01 AI051214, R01 AI117776, T32 GM008339 and the Parke-Davis Endowed Chair in Pharmaceutics and Drug Delivery is gratefully acknowledged. Flow cytometry/Cell sorting CORE facility at Rutgers, The State University of New Jersey is acknowledged for performing flow cytometry and confocal microscopy. The human CD4+ MT-2 T-cells were obtained from Dr. Douglas Richman, courtesy the NIH AIDS research and reference program, division of AIDS, NIAID (NIH cat # 237). A fellowship from the American Foundation for Pharmaceutical Education to M. Palombo is also acknowledged.
All institutional and national guidelines for the care and use of laboratory animals were followed.
References
- 1.Sheet WAF. [Accessed July 28 2015];Fact sheet N°360. 2015 WHO, http://www.who.int/mediacentre/factsheets/fs360/en/. http://www.who.int/mediacentre/factsheets/fs360/en/
- 2.Mutua G, Sanders E, Mugo P, Anzala O, Haberer JE, Bangsberg D, et al. Safety and adherence to intermittent pre-exposure prophylaxis (PrEP) for HIV-1 in African men who have sex with men and female sex workers. PloS one. 2012;7(4) doi: 10.1371/journal.pone.0033103. [DOI] [PMC free article] [PubMed] [Google Scholar]
- 3.Karim QA, Karim SSA, Frohlich JA, Grobler AC, Baxter C, Mansoor LE, et al. Effectiveness and safety of tenofovir gel, an antiretroviral microbicide, for the prevention of HIV infection in women. Science. 2010;329(5996):1168–1174. doi: 10.1126/science.1193748. [DOI] [PMC free article] [PubMed] [Google Scholar]
- 4.Thigpen MC, Kebaabetswe PM, Paxton LA, Smith DK, Rose CE, Segolodi TM, et al. Antiretroviral preexposure prophylaxis for heterosexual HIV transmission in Botswana. The New England journal of medicine. 2012;367(5):423–434. doi: 10.1056/NEJMoa1110711. [DOI] [PubMed] [Google Scholar]
- 5.Baeten JM, Donnell D, Ndase P, Mugo NR, Campbell JD, Wangisi J, et al. Antiretroviral prophylaxis for HIV prevention in heterosexual men and women. The New England journal of medicine. 2012;367(5):399–410. doi: 10.1056/NEJMoa1108524. [DOI] [PMC free article] [PubMed] [Google Scholar]
- 6.Antoinette G, Nelson XZ, Ganapathi Usha, Szekely Zoltan, Flexner Charles W, Owen Andrew, Sinko Patrick J. Drug delivery strategies and systems for HIV/AIDS pre-exposure prophylaxis and treatment. Journal of Controlled Release. 2015;219:669–680. doi: 10.1016/j.jconrel.2015.08.042. [DOI] [PMC free article] [PubMed] [Google Scholar]
- 7.Nelson AG, Zhang X, Ganapathi U, Szekely Z, Flexner CW, Owen A, et al. Drug delivery strategies and systems for HIV/AIDS pre-exposure prophylaxis and treatment. Journal of Controlled Release. 2015;219:669–680. doi: 10.1016/j.jconrel.2015.08.042. doi: http://dx.doi.org/10.1016/j.jconrel.2015.08.042. [DOI] [PMC free article] [PubMed] [Google Scholar]
- 8.Haase AT. Targeting early infection to prevent HIV-1 mucosal transmission. Nature. 2010;464(7286):217–223. doi: 10.1038/nature08757. [DOI] [PubMed] [Google Scholar]
- 9.Veazey RS, Lackner AA. Getting to the guts of HIV pathogenesis. The Journal of experimental medicine. 2004;200(6):697–700. doi: 10.1084/jem.20041464. [DOI] [PMC free article] [PubMed] [Google Scholar]
- 10.Yukl S, Wong JK. Blood and guts and HIV: preferential HIV persistence in GI mucosa. The Journal of infectious diseases. 2008;197(5):640–642. doi: 10.1086/527325. [DOI] [PubMed] [Google Scholar]
- 11.Karim SS, Kashuba AD, Werner L, Karim QA. Drug concentrations after topical and oral antiretroviral pre-exposure prophylaxis: implications for HIV prevention in women. Lancet. 2011;378(9787):279–281. doi: 10.1016/S0140-6736(11)60878-7. [DOI] [PMC free article] [PubMed] [Google Scholar]
- 12.Patterson KB, Prince HA, Kraft E, Jenkins AJ, Shaheen NJ, Rooney JF, et al. Penetration of tenofovir and emtricitabine in mucosal tissues: implications for prevention of HIV-1 transmission. Science translational medicine. 2011;3(112):112re4. doi: 10.1126/scitranslmed.3003174. [DOI] [PMC free article] [PubMed] [Google Scholar]
- 13.Schwartz JL, Rountree W, Kashuba AD, Brache V, Creinin MD, Poindexter A, et al. A multi-compartment, single and multiple dose pharmacokinetic study of the vaginal candidate microbicide 1% tenofovir gel. PloS one. 2011;6(10):e25974. doi: 10.1371/journal.pone.0025974. [DOI] [PMC free article] [PubMed] [Google Scholar]
- 14.Ferguson LM, Rohan LC. The importance of the vaginal delivery route for antiretrovirals in HIV prevention. Therapeutic Delivery. 2011;2(12):1535–1550. doi: 10.4155/tde.11.126. [DOI] [PMC free article] [PubMed] [Google Scholar]
- 15.Hendrix CW, Chen BA, Guddera V, Hoesley C, Justman J, Nakabiito C, et al. MTN-001: Randomized Pharmacokinetic Cross-Over Study Comparing Tenofovir Vaginal Gel and Oral Tablets in Vaginal Tissue and Other Compartments. PLoS one. 2013;8(1) doi: 10.1371/journal.pone.0055013. [DOI] [PMC free article] [PubMed] [Google Scholar]
- 16.Hazra R, Balis FM, Tullio AN, DeCarlo E, Worrell CJ, Steinberg SM, et al. Single-Dose and Steady-State Pharmacokinetics of Tenofovir Disoproxil Fumarate in Human Immunodeficiency Virus-Infected Children. Antimicrobial Agents and Chemotherapy. 2004;48(1):124–129. doi: 10.1128/AAC.48.1.124-129.2004. [DOI] [PMC free article] [PubMed] [Google Scholar]
- 17.Kolate A, Baradia D, Patil S, Vhora I, Kore G, Misra A. PEG - A versatile conjugating ligand for drugs and drug delivery systems. Journal of Controlled Release. 2014;192:67–81. doi: 10.1016/j.jconrel.2014.06.046. [DOI] [PubMed] [Google Scholar]
- 18.Allen A. Structure of gastrointestinal mucus glycoproteins and the viscous and gel-forming properties of mucus. British Medical Bulletin. 1978;34(1):28–33. [PubMed] [Google Scholar]
- 19.Norris DA, Puri N, Sinko PJ. The effect of physical barriers and properties on the oral absorption of particulates. Advanced Drug Delivery Reviews. 1998;34(2–3):135–154. doi: 10.1016/s0169-409x(98)00037-4. [DOI] [PubMed] [Google Scholar]
- 20.Norris DA, Sinko PJ. Effect of size, surface charge, and hydrophobicity on the translocation of polystyrene microspheres through gastrointestinal mucin. Journal of Applied Polymer Science. 1997;63(11):1481–1492. [Google Scholar]
- 21.Ensign LM, Cone R, Hanes J. Oral drug delivery with polymeric nanoparticles: The gastrointestinal mucus barriers. Advanced Drug Delivery Reviews. 2012;64(6):557–570. doi: 10.1016/j.addr.2011.12.009. [DOI] [PMC free article] [PubMed] [Google Scholar]
- 22.Willits RK, Saltzman WM. Synthetic polymers alter the structure of cervical mucus. Biomaterials. 2001;22(5):445–452. doi: 10.1016/s0142-9612(00)00197-6. [DOI] [PubMed] [Google Scholar]
- 23.Silberberg A, Meyer FA. Structure and function of mucus. Advances in Experimental Medicine and Biology. 1982;144:53–74. doi: 10.1007/978-1-4615-9254-9_6. [DOI] [PubMed] [Google Scholar]
- 24.Silberberg A, Meyer FA. Structure and function of mucus. Mucus in Health and Disease II. New York: Plenum Press; 1982. [Google Scholar]
- 25.Ramsey JD, Flynn NH. Cell-penetrating peptides transport therapeutics into cells. Pharmacology and Therapeutics. 2015 doi: 10.1016/j.pharmthera.2015.07.003. [DOI] [PubMed] [Google Scholar]
- 26.Zhang X, Jin Y, Plummer MR, Pooyan S, Gunaseelan S, Sinko PJ. Endocytosis and membrane potential are required for HeLa cell uptake of R.I.-CKTat9, a retro-inverso tat cell penetrating peptide. Molecular Pharmaceutics. 2009;6(3):836–848. doi: 10.1021/mp800121f. [DOI] [PMC free article] [PubMed] [Google Scholar]
- 27.Brock R. The uptake of arginine-rich cell-penetrating peptides: Putting the puzzle together. Bioconjugate Chemistry. 2014;25(5):863–868. doi: 10.1021/bc500017t. [DOI] [PubMed] [Google Scholar]
- 28.Pujals S, Giralt E. Proline-rich, amphipathic cell-penetrating peptides. Advanced Drug Delivery Reviews. 2008;60(4–5):473–484. doi: 10.1016/j.addr.2007.09.012. [DOI] [PubMed] [Google Scholar]
- 29.Sadler K, Eom KD, Yang JL, Dimitrova Y, Tam JP. Translocating proline-rich peptides from the antimicrobial peptide bactenecin 7. BioChemistry. 2002;41(48):14150–14157. doi: 10.1021/bi026661l. [DOI] [PubMed] [Google Scholar]
- 30.Eissenstat M, Guerassina T, Gulnik S, Afonina E, Silva AM, Ludtke D, et al. Enamino-oxindole HIV protease inhibitors. Bioorganic and Medicinal Chemistry Letters. 2012;22(15):5078–5083. doi: 10.1016/j.bmcl.2012.05.120. [DOI] [PubMed] [Google Scholar]
- 31.Ellman GL. A colorimetric method for determining low concentrations of mercaptans. Arch Biochem Biophys. 1958;74(2):443–450. doi: 10.1016/0003-9861(58)90014-6. doi:D - CLML: 5834:27208:574 OTO - NLM. [DOI] [PubMed] [Google Scholar]
- 32.Mosmann T. Rapid colorimetric assay for cellular growth and survival: Application to proliferation and cytotoxicity assays. Journal of Immunological Methods. 1983;65(1–2):55–63. doi: 10.1016/0022-1759(83)90303-4. [DOI] [PubMed] [Google Scholar]
- 33.Matayoshi ED, Wang GT, Krafft GA, Erickson J. Novel fluorogenic substrates for assaying retroviral proteases by resonance energy transfer. Science. 1990;247(4945):954–958. doi: 10.1126/science.2106161. [DOI] [PubMed] [Google Scholar]
- 34.Nara PL, Hatch WC, Dunlop NM, Robey WG, Arthur LO, Gonda MA, et al. Simple, rapid, quantitative, syncytium-forming microassay for the detection of human immunodeficiency virus neutralizing antibody. AIDS Res Hum Retroviruses. 1987;3(3):283–302. doi: 10.1089/aid.1987.3.283. [DOI] [PubMed] [Google Scholar]
- 35.Spreen WR, Margolis DA, Pottage JC. Long-acting injectable antiretrovirals for HIV treatment and prevention. Current Opinion in HIV and AIDS. 2013;8(6):565–571. doi: 10.1097/COH.0000000000000002. [DOI] [PMC free article] [PubMed] [Google Scholar]
- 36.Flexner C, Saag M. The antiretroviral drug pipeline: Prospects and implications for future treatment research. Current Opinion in HIV and AIDS. 2013;8(6):572–578. doi: 10.1097/COH.0000000000000011. [DOI] [PubMed] [Google Scholar]
- 37.Dolgin E. Long-acting HIV drugs advanced to overcome adherence challenge. Nature medicine. 2014;20(4):323–324. doi: 10.1038/nm0414-323. [DOI] [PubMed] [Google Scholar]
- 38.Friend DR, Kiser PF. Assessment of topical microbicides to prevent HIV-1 transmission: Concepts, testing, lessons learned. Antiviral Research. 2013;99(3):391–400. doi: 10.1016/j.antiviral.2013.06.021. [DOI] [PubMed] [Google Scholar]
- 39.Garg AB, Nuttall J, Romano J. The future of HIV microbicides: Challenges and opportunities. Antiviral Chemistry and Chemotherapy. 2009;19(4):143–150. doi: 10.1177/095632020901900401. [DOI] [PubMed] [Google Scholar]
- 40.Smith JM, Srinivasan P, Teller RS, Lo Y, Dinh CT, Kiser PF, et al. Tenofovir Disoproxil Fumarate Intravaginal Ring Protects High Dose Depot Medroxyprogesterone Acetate Treated Macaques from Multiple SHIV Exposures. Journal of Acquired Immune Deficiency Syndromes. 2014 doi: 10.1097/QAI.0000000000000402. [DOI] [PMC free article] [PubMed] [Google Scholar]
- 41.Zhang W, Hu M, Shi Y, Gong T, Dezzutti CS, Moncla B, et al. Vaginal Microbicide Film Combinations of Two Reverse Transcriptase Inhibitors, EFdA and CSIC, for the Prevention of HIV-1 Sexual Transmission. Pharmaceutical Research. 2015;32(9):2960–2972. doi: 10.1007/s11095-015-1678-2. [DOI] [PMC free article] [PubMed] [Google Scholar]
- 42.Deeks Darunavir: A review of its use in the management of HIV-1 infection. Drugs. 2014;74(1):99–125. doi: 10.1007/s40265-013-0159-3. [DOI] [PubMed] [Google Scholar]
- 43.Herold DA, Keil K, Bruns DE. Oxidation of polyethylene glycols by alcohol dehydrogenase. Biochemical Pharmacology. 1989;38(1):73–76. doi: 10.1016/0006-2952(89)90151-2. [DOI] [PubMed] [Google Scholar]
- 44.Bendele A, Seely J, Richey C, Sennello G, Shopp G. Short communication: Renal tubular vacuolation in animals treated with polyethylene-glycol-conjugated proteins. Toxicological Sciences. 1998;42(2):152–157. doi: 10.1006/toxs.1997.2396. [DOI] [PubMed] [Google Scholar]
- 45.Cho WS, Cho M, Jeong J, Choi M, Cho HY, Han BS, et al. Acute toxicity and pharmacokinetics of 13 nm-sized PEG-coated gold nanoparticles. Toxicology and Applied Pharmacology. 2009;236(1):16–24. doi: 10.1016/j.taap.2008.12.023. [DOI] [PubMed] [Google Scholar]
- 46.Duncan R, Richardson SCW. Endocytosis and intracellular trafficking as gateways for nanomedicine delivery: Opportunities and challenges. Molecular Pharmaceutics. 2012;9(9):2380–2402. doi: 10.1021/mp300293n. [DOI] [PubMed] [Google Scholar]
- 47.Johnson BM, Charman WN, Porter CJH. An in vitro examination of the impact of polyethylene glycol 400, Pluronic P85, and vitamin E d-α-tocopheryl polyethylene glycol 1000 succinate on P-glycoprotein efflux and enterocyte-based metabolism in excised rat intestine. AAPS PharmSci. 2002;4(4) doi: 10.1208/ps040440. [DOI] [PMC free article] [PubMed] [Google Scholar]
- 48.Shen Q, Lin Y, Handa T, Doi M, Sugie M, Wakayama K, et al. Modulation of intestinal P-glycoprotein function by polyethylene glycols and their derivatives by in vitro transport and in situ absorption studies. International Journal of Pharmaceutics. 2006;313(1–2):49–56. doi: 10.1016/j.ijpharm.2006.01.020. [DOI] [PubMed] [Google Scholar]
- 49.Hugger ED, Audus KL, Borchardt RT. Effects of poly(ethylene glycol) on efflux transporter activity in Caco-2 cell monolayers. Journal of Pharmaceutical Sciences. 2002;91(9):1980–1990. doi: 10.1002/jps.10175. [DOI] [PubMed] [Google Scholar]
- 50.Choi JS, Jo BW. Enhanced paclitaxel bioavailability after oral administration of pegylated paclitaxel prodrug for oral delivery in rats. International Journal of Pharmaceutics. 2004;280(1–2):221–227. doi: 10.1016/j.ijpharm.2004.05.014. [DOI] [PubMed] [Google Scholar]
- 51.Wang YY, Lai SK, Suk JS, Pace A, Cone R, Hanes J. Addressing the PEG mucoadhesivity paradox to engineer nanoparticles that "slip" through the human mucus barrier. Angewandte Chemie - International Edition. 2008;47(50):9726–9729. doi: 10.1002/anie.200803526. [DOI] [PMC free article] [PubMed] [Google Scholar]
- 52.Olmsted SS, Padgett JL, Yudin AI, Whaley KJ, Moench TR, Cone RA. Diffusion of macromolecules and virus-like particles in human cervical mucus. Biophysical Journal. 2001;81(4):1930–1937. doi: 10.1016/S0006-3495(01)75844-4. [DOI] [PMC free article] [PubMed] [Google Scholar]
- 53.Milletti F. Cell-penetrating peptides: Classes, origin, and current landscape. Drug Discovery Today. 2012;17(15–16):850–860. doi: 10.1016/j.drudis.2012.03.002. [DOI] [PubMed] [Google Scholar]
- 54.Ziegler AE, Seelig J. Contributions of glycosaminoglycan binding and clustering to the biological uptake of the nonamphipathic cell-penetrating peptide WR 9. BioChemistry. 2011;50(21):4650–4664. doi: 10.1021/bi1019429. [DOI] [PubMed] [Google Scholar]
- 55.Salomone F, Cardarelli F, Di Luca M, Boccardi C, Nifosì R, Bardi G, et al. A novel chimeric cell-penetrating peptide with membrane-disruptive properties for efficient endosomal escape. Journal of Controlled Release. 2012;163(3):293–303. doi: 10.1016/j.jconrel.2012.09.019. [DOI] [PubMed] [Google Scholar]
- 56.El-Sayed A, Futaki S, Harashima H. Delivery of macromolecules using arginine-rich cell-penetrating peptides: Ways to overcome endosomal entrapment. AAPS Journal. 2009;11(1):13–22. doi: 10.1208/s12248-008-9071-2. [DOI] [PMC free article] [PubMed] [Google Scholar]
- 57.Lipkin M. Physiology of the Gastrointestinal Tract. New York: Raven Press; 1987. Proliferation and Differentiation of Normal and Diseased Gastrointestinal Cells. [Google Scholar]
- 58.Veazey RS, Lackner AA. Getting to the guts of HIV pathogenesis. Journal of Experimental medicine. 2004;200(6):697–700. doi: 10.1084/jem.20041464. [DOI] [PMC free article] [PubMed] [Google Scholar]
- 59.Yukl S, Wong JK. Blood and guts and HIV: Preferential HIV persistence in GI mucosa. Journal of Infectious Diseases. 2008;197(5):640–642. doi: 10.1086/527325. [DOI] [PubMed] [Google Scholar]
- 60.Zhang W, inventor. Preparation of L-nucleoside derivatives as antiviral agents. CN 1465574. China patent. 2004 Jan 7;
- 61.Mingyan Zhao SZ, inventor. Preparation of acyclic nucleotides as antiviral agents. 1966514 A 20070523. China patent CN. 2007


