Abstract
Interactions between membrane proteins and lipids are often crucial for structure and function yet difficult to define because of their dynamic and heterogeneous nature. Here, we use mass spectrometry to demonstrate that membrane protein oligomers ejected from nanodiscs in the gas phase retain large numbers of lipid interactions. The complex mass spectra that result from gas‐phase dissociation were assigned using a Bayesian deconvolution algorithm together with mass defect analysis, allowing us to count individual lipid molecules bound to membrane proteins. Comparison of the lipid distributions measured by mass spectrometry with molecular dynamics simulations reveals that the distributions correspond to distinct lipid shells that vary according to the type of protein–lipid interactions. Our results demonstrate that nanodiscs offer the potential for native mass spectrometry to probe interactions between membrane proteins and the wider lipid environment.
Keywords: lipid annulus, mass spectrometry, membrane proteins, nanodiscs, protein–lipid interactions
Membrane proteins are challenging to analyze because of their poor solubility, low expression levels, and unique localization in the lipid membrane. Although the membrane environment can be important to membrane protein structure and function, few methods exist for directly studying interactions between membrane proteins and the lipid bilayer.1 Recently, noncovalent or native mass spectrometry (MS) has made great strides in the characterization of membrane proteins with a small number of bound lipids.2 These studies generally relied on detergent micelles to solubilize membrane proteins along with added or co‐purified lipids. Gas‐phase activation released the detergent to present the membrane protein–lipid complexes for mass analysis.
Nanodiscs offer an attractive vehicle for MS because they provide a relatively monodisperse lipid bilayer environment, which is more natural than detergent micelles. Nanodiscs are self‐assembled lipoprotein complexes consisting of a lipid bilayer encircled by two amphipathic membrane scaffold proteins (MSP).3 MS of nanodiscs has previously been used with proteomics to study the membrane protein interactome4 and composition of heterogeneous nanodisc libraries;5 with HDX to study membrane protein topology, conformation, and interactions;6 and with native MS to study soluble protein‐glycolipid interactions7 and to count the number of lipid molecules in intact nanodisc complexes in the absence of encapsulated proteins.8 Native MS of membrane proteins in nanodiscs has previously shown that high‐energy dissociation releases intact membrane protein oligomers devoid of bound lipids.9 Here, we found that low‐energy dissociation of nanodiscs allows ejection of membrane protein assemblies with a large number of lipids bound in several defined subsets.
We studied two bacterial membrane protein complexes, trimeric ammonium transporter AmtB and tetrameric aquaporin AqpZ. Each was purified and assembled into nanodiscs containing either 1‐palmitoyl‐2‐oleoyl‐sn‐glycero‐3‐phosphocholine (POPC) or 1,2‐dimyristoyl‐sn‐glycero‐3‐phosphocholine (DMPC), which have the same head group but different chain lengths. A description of nanodisc preparation and mass spectrometry methods is provided in the Supporting Information. Briefly, POPC nanodiscs were formed using either MSP1D1(−) scaffold protein or MSP1E3D1(−), which form smaller (9.7 nm) and larger (12.8 nm) discs, respectively.3b DMPC nanodiscs were formed with MSP1D1(−). Nanodiscs with MSP1D1(−) showed a slightly higher Stokes diameter than expected, which may indicate dimerization of the small nanodiscs. However, close similarities in the spectra between smaller and larger nanodiscs indicate that this size discrepancy seems to have a negligible influence on their gas‐phase behavior. Membrane protein–nanodisc complexes were ionized using nanoelectrospray ionization and activated by collision‐induced dissociation (CID).
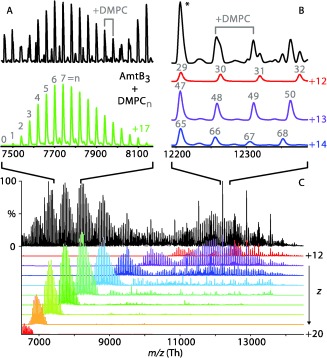
Mass spectra of CID products from nanodiscs are highly complex, often containing hundreds of peaks (Figure 1, black). To address this complexity, we utilized the high resolution afforded by an orbitrap mass spectrometer modified for high‐mass analysis.10 Although the orbitrap MS provided spectra of unprecedented quality and resolution, interpretation of the spectra is nevertheless complicated by overlapping peaks in m/z. We address this challenge using UniDec, a Bayesian deconvolution program.11 UniDec deconvolves each spectrum into a corresponding mass distribution, allowing separation and disambiguation of charge states (Figure 1). Peaks in the mass distribution are generally separated by the mass of a single lipid, indicating a range in the number of lipids per complex.
Figure 1.

Representative spectrum (black) of AmtB nanodiscs with DMPC and MSP1D1(−) at 130 V CID. Deconvolved charge states from +12 to +20 are shown in various colors (C). Zoomed regions with their predominant charge states show a series of distinct peaks separated by a single DMPC (A and B). The number of lipids bound to the AmtB trimer is annotated in gray. The resonant peak in B is annotated with an asterisk.
Deconvolution reveals several distinct features in the spectra that correspond to different dissociation products. For some products, the distribution in the number of bound lipids is narrow enough that individual charge states are well separated (Figure 1 A). Other dissociation products have a wide distribution of lipids, leading to overlap between neighboring masses and charge states. In this case, a resonance effect8b causes constructive overlap at defined peaks near integer multiples of the lipid mass, indicated by an asterisk in Figure 1 B.
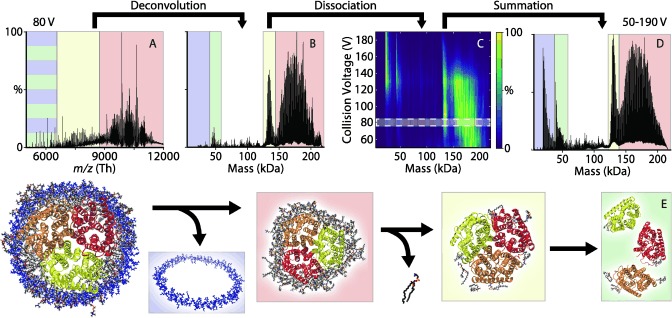
These features vary with increasing collisional activation. At lower energy, the predominant spectral feature is the complex pattern of peaks at higher m/z caused by a broad distribution in the number of lipids per assembly (Figure 2 and Figure S1, red, in the Supporting Information).8b Increasing collisional activation causes the loss of lipids and charge, leading to a shift in mass and m/z (Figures S2 and S3).8, 11 For AmtB, intermediate activation energies show a distinct charge‐state distribution and a roughly Gaussian distribution of bound lipids (Figure 2, yellow). At higher energies, simple charge‐state distributions appear at lower mass and m/z (Figure 2 and Figure S1, blue/green). Although there are differences in relative intensities of each feature and the CID voltages for transitions between them, the spectra are qualitatively similar across sample replicates and different types of nanodisc.
Figure 2.

Representative mass spectrum and deconvolution of AmtB nanodiscs with POPC and MSP1D1(−). A) Mass spectrum at 80 V CID deconvolves to yield B) the mass distribution. C) The mass distribution shifts to lower‐mass species with increasing collision energy. D) The average mass distribution over all CID states shows four distinct species, which are illustrated in (E): AmtB trimer with a broad mass distribution including tens of bound lipids (red), AmtB trimer with around nine bound lipids (yellow), AmtB monomer (green), and MSP (blue). These four states are similarly shaded in A, B, and D.
Low‐mass peaks are straightforward to assign to MSP scaffold (Figure 2 and Figure S1, blue) and membrane protein monomer (green) with a cadre of bound lipids based on their known masses.3b, 12 Small lipid clusters are also observed at low m/z but were not considered in the analysis.
However, high‐mass components are challenging to assign because the mass of potential protein components can be nearly equal to integer multiples of the lipid mass. For example, MSP1D1(−) has a mass of 22 044 Da, which is equal to 29.002 times the mass of POPC, 760.076 Da. The difference of 2 Da between MSP1D1(−) and POPC29 is not resolvable in these measurements, so it is not possible to unambiguously assign spectra with both POPC and MSP1D1(−) from the mass alone.
To help assign high‐mass components, we utilized a novel high‐mass analog of Kendrick mass defect analysis based on a repeating oligomeric unit.13 A mass defect is the difference between an exact mass and an integer multiple of a reference mass. Although it is commonly used in analysis of hydrocarbon mixtures,14 mass defect analysis has also proven useful in MS analysis of biomolecules.15 Conventional Kendrick analysis aims to probe sub‐Dalton differences in atomic composition. Here, the average mass of the lipid serves as the reference mass, 760.076 Da for POPC and 677.933 for DMPC. Because the reference mass is much larger, sub‐Dalton resolution is not necessary. We define the normalized mass defect as the remainder of the measured mass divided by the lipid mass, so it is a unitless parameter. For example, MSP1D1(−) has a mass of 22 044 Da and thus a mass defect of 0.002 for POPC and 0.516 for DMPC. Accuracy of the mass defects was determined based on MSP monomer values to be better than 0.01. A typical full width at half maximum for high‐mass peaks was around 100 Da, so we are easily able to resolve difference in mass defect below 0.1 (see Table S1). Further details are provided in the Supporting Information, and the analysis tools are available for download as part of UniDec (http://unidec.chem.ox.ac.uk).11 Because complexes with the same protein component but different number of lipids have the same mass defect, we can focus on assignment of the membrane protein and MSP components independent of the broad lipid distribution.
The identity of the high‐mass peaks was deduced from the mass defects of nanodiscs containing different MSP and lipid species by using two assumptions. First, we assumed the assignment was the same across the three types of nanodiscs. This is supported by the remarkable similarities in the spectral features and mass distributions. Second, we assumed that the only components in the system were the membrane protein, MSP, and lipid, which is supported by spectra where the complex has been completely dissociated and only these three species are observed.
Because MSP1D1(−) has a mass defect of nearly zero in POPC, the mass defect in these spectra reports exclusively on the number of membrane protein oligomer units. Here, the mass defects agree with the expected oligomeric states, trimer for AmtB and tetramer for AqpZ (Table S1 and Figure S4). Although it may be possible to construct larger oligomers with the same mass defect, limitations on the overall mass of the complex exclude this possibility.
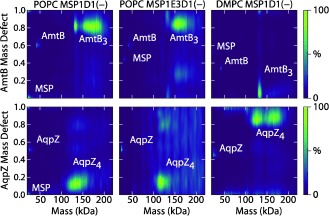
The absence of MSP in the high‐mass peaks was demonstrated by changing the mass of the scaffold protein. MSP1E3D1(−) has a mass defect of 0.443 in POPC and will change the mass defect by more than a standard deviation of the peak (see Table S1). Because there are no significant changes in the mass defect, as shown in Figure 3, we conclude that no MSP is present. This conclusion is supported by changing the lipid to DMPC, where the mass defects of all components are different but still in agreement with values predicted for membrane protein oligomers devoid of the two MSP belts. Thus, mass defect analysis indicates that the high‐mass peaks contain only lipid and membrane protein oligomers with no MSP.
Figure 3.

Mass defect analysis of membrane protein–nanodisc complexes. Representative plots are shown for a single sample averaged across all CID states for AmtB (top) and AqpZ (bottom) with POPC‐MSP1D1(−) (left), POPC‐MSP1E3D1(−) (middle), and DMPC‐MSP1D1(−) (right). The mass was rounded down to the nearest integer multiple of the lipid mass. Regions for MSP, membrane protein monomers, and membrane protein oligomers are annotated.
Combining mass defect analysis with different nanodisc components allows confident assignment of the predominant high‐mass peaks to the AmtB trimer or AqpZ tetramer with between 0 and 120 bound lipids (Figure S4), suggesting that removal of both MSP scaffolds occurs prior to resolution of the complex (Figures 2 E and Figure S1). Returning to Figure 1, the overlapped charge states at higher m/z show a large number of lipids while the distinct Gaussian distribution at intermediate m/z shows only a small number. Most importantly, the number of lipids bound to the membrane protein oligomer is relatively independent of the lipid chain length or nanodisc size, which indicates that the nanodisc itself does not introduce any significant distortions on membrane protein–lipid interactions.
To provide a molecular rationale for the lipid distributions observed by MS, we used molecular dynamics (MD) to simulate a POPC bilayer environment surrounding the membrane protein oligomers. Three subsets of lipids were investigated, the annular belt, the annular belt of lipids interacting via head groups, and the lipids interacting via ionic contacts with the protein. Minima in the distance distributions were used to establish appropriate cutoffs for counting each interaction as shown in Figure S5. For each type of interaction, we counted the lipids in each extracted simulation frame (Figure S6) and determined the distribution of lipid counts observed over the course of the simulation (Figure 4 and Figure S7). Additional details on MD methods are presented in the Supporting Information.
Figure 4.

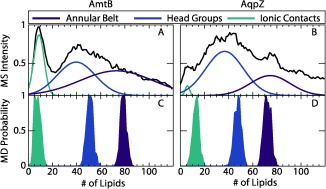
Lipid distribution from MS averaged across all three types of nanodiscs for A) AmtB and B) AqpZ compared with lipid distributions determined from MD (C and D, for AmtB and AqpZ, respectively) for the annular belt (purple), the head group shell (blue), and the ionic contacts (cyan). MS distributions were fit to three overlapping Gaussian distributions. MD distributions are a histogram of individual measurements for each frame, which are shown in Figure S6.
The number of lipids counted by molecular dynamics corresponds with lipid distributions observed in mass spectrometry. The average lipid distributions from MS were fit to three overlapping Gaussian distributions (Figure 4), which are compared with MD results in Table S2. These three distributions are generally within a standard deviation of the number of lipids predicted for the lipid annular belt, the head group shell, and the ionic contacts. A closer inspection of the collision voltage series reveals that the predicted number of lipids in the annular belt generally corresponds with the lipid distributions observed at low collision energy (Figure S7), and the predicted number of lipids in the head group shell agrees with the center of the lipid distribution at moderate collision energies. This suggests that moderate collision energy removes some weakly‐bound lipids in the annular belt, leaving only the lipids bound through more polar interactions via the head groups.
The distinct peaks observed at around nine lipids for AmtB (Figure 2, yellow) agrees with the number of ionic interactions predicted by molecular dynamics. This suggests a second dissociation pathway for AmtB whereby the majority of lipids in the annular belt are removed to leave the lipids interacting through ionic interactions. AqpZ shows a similar peak in some spectra, but this peak does not agree with the number of ionic contacts predicted by MD and is much weaker. The lack of a clear distribution corresponding to the ionic contacts for AqpZ may be because of the increased number of ionic contacts (Table S2) and the generally stronger interactions with the lipid bilayer (Figure S5), which may make oligomer dissociation more favorable than stripping of lipids.
Insight from MD allows us to propose a mechanism for dissociation of membrane protein–nanodisc complexes based on the relative strength of interaction with various lipid shells. Collisional activation needed to desolvate the complex causes the release of the MSP scaffolds and any bulk lipids, leaving an annular belt of lipids bound to the membrane protein oligomer. Based on known properties of intermolecular bonds in the gas phase,16 we expect that ionic contacts will generally be stronger than hydrogen bonds, dipole interactions, and nonpolar contacts, which are each, respectively weaker. Thus, at increased collision energies, weakly‐bound lipids continue to be ejected, leaving lipids interacting directly with the protein through their polar head groups. For AmtB, the membrane protein can continue to shed lipids until only the strong ionic contacts remain bound. Further activation dissociates the complex into membrane protein monomers with a small number of lipids still bound.
We have demonstrated how native MS with membrane protein‐nanodiscs can be used to measure the stoichiometry of large numbers of lipids in different shells around membrane proteins. The overall membrane protein‐nanodisc dissociation mechanism is similar for these two proteins, but there are notable differences between AmtB and AqpZ, especially in the appearance of the ionic contact lipid shell for AmtB. Thus, we expect the number of lipids and specific dissociation mechanisms to be dependent on the individual membrane protein, the lipid structure and charge, and the nature of gas‐phase activation. The combination of MS and MD provides a picture of the stoichiometry of lipid shells surrounding the membrane protein and enables biophysical and structural studies of the complex interface between membrane proteins and their lipid environment.
Supporting information
As a service to our authors and readers, this journal provides supporting information supplied by the authors. Such materials are peer reviewed and may be re‐organized for online delivery, but are not copy‐edited or typeset. Technical support issues arising from supporting information (other than missing files) should be addressed to the authors.
miscellaneous_information
Acknowledgements
The authors thank Matteo Degiacomi for helpful discussions and assistance with MD. The authors acknowledge the use of the University of Oxford Advanced Research Computing (ARC) facility in carrying out this work (http://dx.doi.org/10.5281/zenodo.22558). M.T.M. is funded by program grant G1000819 from the Medical Research Council. C.V.R. and J.G. are funded by European Research Council Investigator Award (IMPRESSS, grant number 268851).
References
- 1.
- 1a. Contreras F. X., Ernst A. M., Wieland F., Brugger B., Cold Spring Harbor Perspect. Biol. 2011, 3, a004705; [DOI] [PMC free article] [PubMed] [Google Scholar]
- 1b. Barrera N. P., Zhou M., Robinson C. V., Trends Cell Biol. 2013, 23, 1–8. [DOI] [PubMed] [Google Scholar]
- 2. Bechara C., Robinson C. V., J. Am. Chem. Soc. 2015, 137, 5240–5247. [DOI] [PubMed] [Google Scholar]
- 3.
- 3a. Bayburt T. H., Sligar S. G., FEBS Lett. 2010, 584, 1721–1727; [DOI] [PMC free article] [PubMed] [Google Scholar]
- 3b. Denisov I. G., Grinkova Y. V., Lazarides A. A., Sligar S. G., J. Am. Chem. Soc. 2004, 126, 3477–3487. [DOI] [PubMed] [Google Scholar]
- 4. Borch J., Roepstorff P., Moeller‐Jensen J., Mol. Cell. Proteomics 2011, 10, O110.006775; [DOI] [PMC free article] [PubMed] [Google Scholar]; Borch J., Roepstorff P., Moeller‐Jensen J., Mol. Cell. Proteomics 2011, 10, O110.006779. [DOI] [PMC free article] [PubMed] [Google Scholar]
- 5.
- 5a. Marty M. T., Wilcox K. C., Klein W. L., Sligar S. G., Anal. Bioanal. Chem. 2013, 405, 4009–4016; [DOI] [PMC free article] [PubMed] [Google Scholar]
- 5b. Roy J., Pondenis H., Fan T. M., Das A., Biochemistry 2015, 54, 6299–6302. [DOI] [PubMed] [Google Scholar]
- 6.
- 6a. Hebling C. M., Morgan C. R., Stafford D. W., Jorgenson J. W., Rand K. D., Engen J. R., Anal. Chem. 2010, 82, 5415–5419; [DOI] [PMC free article] [PubMed] [Google Scholar]
- 6b. Parker C. H., Morgan C. R., Rand K. D., Engen J. R., Jorgenson J. W., Stafford D. W., Biochemistry 2014, 53, 1511–1520. [DOI] [PMC free article] [PubMed] [Google Scholar]
- 7.
- 7a. Han L., Kitova E. N., Li J., Nikjah S., Lin H., Pluvinage B., Boraston A. B., Klassen J. S., Anal. Chem. 2015, 87, 4888–4896; [DOI] [PubMed] [Google Scholar]
- 7b. Leney A. C., Fan X., Kitova E. N., Klassen J. S., Anal. Chem. 2014, 86, 5271–5277. [DOI] [PubMed] [Google Scholar]
- 8.
- 8a. Marty M. T., Zhang H., Cui W. D., Blankenship R. E., Gross M. L., Sligar S. G., Anal. Chem. 2012, 84, 8957–8960; [DOI] [PMC free article] [PubMed] [Google Scholar]
- 8b. Marty M. T., Zhang H., Cui W. D., Gross M. L., Sligar S. G., J. Am. Soc. Mass Spectrom. 2014, 25, 269–277. [DOI] [PMC free article] [PubMed] [Google Scholar]
- 9. Hopper J. T. S., Yu Y. T.‐C., Li D., Raymond A., Bostock M., Liko I., Mikhailov V., Laganowsky A., Benesch J. L. P., Caffrey M., Nietlispach D., Robinson C. V., Nat. Methods 2013, 10, 1206–1208. [DOI] [PMC free article] [PubMed] [Google Scholar]
- 10.
- 10a. Rose R. J., Damoc E., Denisov E., Makarov A., Heck A. J. R., Nat. Methods 2012, 9, 1084–1086; [DOI] [PubMed] [Google Scholar]
- 10b. Dyachenko A., Wang G., Belov M., Makarov A., de Jong R. N., van den Bremer E. T. J., Parren P. W. H. I., Heck A. J. R., Anal. Chem. 2015, 87, 6095–6102. [DOI] [PubMed] [Google Scholar]
- 11. Marty M. T., Baldwin A. J., Marklund E. G., Hochberg G. K. A., Benesch J. L. P., Robinson C. V., Anal. Chem. 2015, 87, 4370–4376. [DOI] [PMC free article] [PubMed] [Google Scholar]
- 12. Laganowsky A., Reading E., Allison T. M., Ulmschneider M. B., Degiacomi M. T., Baldwin A. J., Robinson C. V., Nature 2014, 510, 172–175. [DOI] [PMC free article] [PubMed] [Google Scholar]
- 13. Kendrick E., Anal. Chem. 1963, 35, 2146–2154. [Google Scholar]
- 14. Hughey C. A., Hendrickson C. L., Rodgers R. P., Marshall A. G., Qian K., Anal. Chem. 2001, 73, 4676–4681. [DOI] [PubMed] [Google Scholar]
- 15.
- 15a. Sleno L., J. Mass Spectrom. 2012, 47, 226–236; [DOI] [PubMed] [Google Scholar]
- 15b. Lerno L. A., German J. B., Lebrilla C. B., Anal. Chem. 2010, 82, 4236–4245. [DOI] [PMC free article] [PubMed] [Google Scholar]
- 16. Daniel J. M., Friess S. D., Rajagopalan S., Wendt S., Zenobi R., Int. J. Mass Spectrom. 2002, 216, 1–27. [Google Scholar]
Associated Data
This section collects any data citations, data availability statements, or supplementary materials included in this article.
Supplementary Materials
As a service to our authors and readers, this journal provides supporting information supplied by the authors. Such materials are peer reviewed and may be re‐organized for online delivery, but are not copy‐edited or typeset. Technical support issues arising from supporting information (other than missing files) should be addressed to the authors.
miscellaneous_information


