

Abstract
Aim
This study investigates the colonization rate of Akkermansia muciniphila in the gastrointestinal tracts of people living in southern China and applies a modified method for the isolation and subtyping of A. muciniphila strains from faecal samples.
Methods and Results
Fresh faecal samples were collected and bacterial DNA was extracted from these samples for real‐time PCR analysis. Strains were separated using a culture‐dependent sPCR‐directed method and classified using an enterobacterial repetitive intergenic consensus (ERIC‐PCR) DNA fingerprinting method. The colonization rate for the sample population from southern China was 51·74%. We isolated 22 strains from human faeces. The results revealed that all strains were identifiable as A. muciniphila with 99–100% identity to the type‐strain ATCC BAA‐835. ERIC‐PCR resulted in grouping of the DNA fingerprints showed that 12 distinct clusters were distinguished with a delineation level of 100%.
Conclusions
Southern China has a high rate of A. muciniphila colonization and over 12 different subtype strains reside in faecal samples.
Significance and Impact of the Study
Akkermansia muciniphila has a beneficial role in human gastrointestinal tract. These studies provide a better understanding of A. muciniphila and details of its colonization in the human gastrointestinal tract.
Keywords: Akkermansia muciniphila, colonization rate, ERIC‐PCR, real‐time PCR, subtyping
Introduction
The gastrointestinal (GI) tract is colonized by a complex and diverse microbiota, which consists of approx. 1014 bacteria. The influence of numerous factors such as geographic location, age, dietary habits and metabolism on physiological variations in the microbiota have been well established (Finegold et al. 1974; Raoult 2012; Thaiss et al. 2014). Furthermore, changes in the composition of gut microbiota have been linked to several diseases, including obesity (Ley et al. 2006), eczema (Nylund et al. 2013), irritable bowel syndrome (IBS) (Pimentel et al. 2000), Crohn's disease (Kaakoush et al. 2012), necrotizing enterocolitis (Mai et al. 2011), and type‐2 diabetes (Qin et al. 2012). Akkermansia muciniphila, a mucin‐degrading bacteria, is a member of the Verrucomicrobia phylum (Derrien et al. 2004). Akkermansia muciniphila‐like organisms are universally distributed in the intestines and make up between 1 and 4% of the bacterial population in the colons of Europeans (Collado et al. 2007; Derrien et al. 2008). Diets, race and geographic location can modulate the overall dominant microbiota (De Filippo et al. 2010; Claesson et al. 2011; Yatsunenko et al. 2012). The Chinese diets, race and geographic location varies from Europe, which may be factors leading to the colonization rate and range varying significantly.
Present knowledge suggests that A. muciniphila is important in maintaining a healthy mucus layer in the human gut (Belzer and de Vos 2012). In previous researches, A. muciniphila has been proposed to be a contributor to the maintenance of gut health (Png et al. 2010; Swidsinski et al. 2011; Vigsnaes et al. 2012). In mouse studies, A. muciniphila played a causative role in lowering the body fat index, decreasing adipose tissue inflammation, improving glucose homeostasis, decreasing metabolic endotoxaemia, increasing the number of goblet cells, and increasing gut mucin integrity (Everard et al. 2013; Shin et al. 2014; Anhe et al. 2015). Tests in humans have shown A. muciniphila is more abundant in the normal glucose tolerance group than in the prediabetes group which suggests that it may be a marker of type‐2 diabetes (T2DM) (Zhang et al. 2013). Other research has shown that, in the process of degrading mucin, A. muciniphila produces acetate and propionate (Derrien et al. 2004). It is also linked to a protective or anti‐inflammatory role (Png et al. 2010). As a probiotic reckoned to have health‐promoting effects in humans, the activity of A. muciniphila at the surface of mucosa can help to maintain the mucus layer (Belzer and de Vos 2012).
Despite its important role in the human GI tract, only one strain – MucT (ATCC BAA‐835) – has been purified from human faeces, and that was isolated in 2004 (Derrien et al. 2004). Meta‐genomic data suggest that, in addition to A. muciniphila, at least eight additional species of the Akkermansia genus colonize the human intestine, and even simultaneous colonization by different species can occur (Van den Abbeele et al. 2011). Strains of differing subtypes have not yet been isolated and reported.
Culture‐dependent techniques, which are a beneficial way to elucidate the gut bacterial repertoire, can be used only for a limited range of bacteria in the human gut (Eckburg et al. 2005). Improving culture‐dependent methods for isolation of A. muciniphila isolation from faeces remains a key challenge in microbiology. Akkermansia muciniphila is hard to culture from faecal samples because it requires several days to reach a small colony size despite the richness of the nutrient agar plates. Previous attempts to isolate A. muciniphila from stool samples have been unsuccessful (Caputo et al. 2015).
Pulse‐field electrophoresis (PFGE) is considered the gold‐standard method in molecular typing for bacteria such as Salmonella, but it is time‐consuming and labour‐intensive (Winokur 2003). Many alternative typing methods are also available, such as PCR‐based random amplification of polymorphic DNA (RAPD), repetitive extragenic palindromic (REP) methods and ERIC‐PCR, which capture variation on a genomic scale, as well as methods for determining specific gene variations (Lim et al. 2005; Torpdahl et al. 2005). ERIC‐PCR, which offers high subtyping sensitivity, requires no specific technical expertise and makes use of common laboratory reagents, was chosen as the methodology for this study (Wattiau et al. 2011; Schumann and Pukall 2013). Subtyping bacteria of A. muciniphila lays a foundation for subsequent functional analysis and population distribution mapping. However, the detailed subtypes of A. muciniphila found in humans still remain unknown. This study is the first time ERIC‐PCR has been used to subtype A. muciniphila for further analysis.
In this study, real‐time PCR was used to explore the colonization rate in southern China. By using a novel medium‐selected sPCR‐directed method, some reference strains were isolated from the faecal samples. The ERIC‐PCR method was used for further classification.
Materials and methods
New culture‐dependent sPCR‐directed method
Preparation of reductive chocolate agar plates (RCP): 10 g peptone, 5 g NaCl, 15 g agar, 0·25 g Na2S·7H2O and 800 ml pure water were added to prepare a yeast infusion and the pH was adjusted to 7·2–7·4. The supplied pure water was added to a total volume of 1000 ml. The infusion was autoclaved at 125°C for 15 min. When the temperature had cooled to 70–58°C, we added 100 ml sterile defibrinated sheep blood and vancomycin to a final concentration of 5 μg ml−1. The mix was shaken well in an 80–85°C water bath for 15 min, then mixed thoroughly. About 15 ml liquid medium was poured into each plate. After the plates had cooled and the medium solidified, they were stored at 4°C until use.
High bacterial count faecal samples, as identified by real‐time PCR results (CT ≤ 30), were collected and the bacteria isolated for culturing. The liquid mucin medium and mucin agar plates were prepared, and the isolation methods described by Derrien et al. (2004) were followed. Each step was confirmed by PCR using AM1 and AM2 PCR primers. Bacteria were inoculated on mucin agar plates and culture purified on RCP until pure cultures were obtained.
Real‐time PCR for Akkermansia muciniphila
Fresh faecal samples from 172 healthy people were collected. Total DNA was extracted by using a QIAamp fast DNA Stool Mini Kit (Qiagen, Hiden, Germany), following the manufacturer's instructions. Two primers were used for the variable regions of the 16s rRNA gene sequence of A. muciniphila bacteria (Collado et al. 2007). The primers were:
AM1, 5′CAG CAC GTG AAG GTG GGG AC 3′
AM2, 5′CCT TGC GGT TGG CTT CAG AT 3′
A standard curve of MucT (ATCC BAA‐835T, CIP 107961T) was built using SYBR®Select Master Mix (Cat No. 44729, Life Technologies, Carlsbad, CA) following the manufacturer's protocol in an ABI Vii7 real‐time PCR System (Applied Biosystems, Carlsbad, CA). The procedure included pre‐denaturation of DNA samples at 95°C for 2 min (first stage) followed by the amplification of the denatured DNA samples with 40 cycles at 95°C for 15 s, at 60°C for 30 s, 72°C for 60 s and a final extension at 72°C for 5 min. The fluorescent product was detected in the last step of each cycle. To distinguish the target PCR product from nontarget product, melting curve analysis was performed after amplification using the default settings of the abi software (Applied Biosystems, Carlsbad, CA) from 60°C to 95°C.
General PCR
Two specific primers (AM1, AM2) and bacterial 16s RNA universal primers (1492R, 27F) were used for PCR. General PCR was performed using takarataq ™ ver. 2.0 (Takara, Dalian, China) according to the manufacturer's instructions. The procedures using primers AM1 and AM2 were done by pre‐denaturation of DNA samples at 94°C for 2 min (first stage) and amplification of the denatured DNA samples with 40 cycles at 94°C for 30 s, 60°C for 30 s, 72°C for 30s and a final extension at 72°C for 7 min. Universal primer (1492R: GGTTACCTTGTTACGACTT, 27F: AGAGTTTGATCCTGGCTCA) amplification was done by pre‐denaturation of DNA samples at 94°C for 2 min (first stage) and the amplification for 40 cycles at 94°C for 30 s, 50°C for 60 s, 72°C for 120 s, and a final extension at 72°C for 7 min.
ERIC‐PCR
Primers ERIC‐15′ATG TAA GCT CCT GGG GAT TCA C‐3′) and ERIC‐2 (5′‐AAG TAA GTG ACT GGG GTG AGC G3′) were used for ERIC‐PCR in the present study. Amplification was done by pre‐denaturation of DNA samples at 94°C for 2 min (first stage) and amplification of the denatured DNA samples with 40 cycles at 94°C for 60 s, 52°C for 60 s, 68°C for 8 min and a final extension at 65°C for 16 min.
Gel electrophoresis
After PCR amplification, 10 μl of each amplified product was mixed with 2 μl of 6× loading buffer, and the mixture was loaded onto a 1% agarose gel stained with ethidium bromide. After electrophoresis, photographs were taken under UV light to record the results.
Total bacteria counts
Ten faecal samples per group, taken randomly from five different age ranges, were selected. One gram of the samples was used and suspended in 9 ml of phosphate‐buffered saline (pH 7·0). The suspension was vortexed thoroughly, then serially diluted in PBS. The sample was incubated for 30 min with DAPI stain at a final concentration of 10 μg ml−1 before being filtered on prestained (Whatman Black) membrane filters (0·22 μm pore size; Nuclepore Corp, Maidstone, UK). Bacteria were counted immediately under 400× magnification with a Leica epifluorescence microscope equipped with a mercury lamp. Bacteria were counted in randomly selected areas until either 20 fields or a total of 400 bacteria were counted. Finally, we converted the numerical values into the total number of bacteria per gram using dilution multiples.
Extraction of genomic DNA
The bacteria were grown overnight in BHI broth at 37°C. DNA was extracted from 5 ml of cultures using the Ampure Microbial DNA Kit (Magen, Guangzhou China). DNA samples in IRB2 buffer were stored at −30°C.
Construction of dendrogram and phylogenetic tree
Scores of ‘0’ and ‘1’ were attributed to the absence or the presence of a band, respectively, for each DNA fingerprint harvested from ERIC‐PCR for further analysis. ntsys pc2.02 software (Exeter Software, East Setauket, NY) was used to calculate the un‐weighted pair group method arithmetic mean (UPGMA) and this was used to construct a dendrogram for cluster analysis of the 22 total strains. A phylogenetic tree was built with mega 5.1 (Tamura et al. 2011) using the maximum likelihood method.
Statistical analysis
Data were expressed as medians, with interquartile ranges in parentheses. The Mann–Whitney U‐test was used to determine the source of significant differences. P < 0·05 indicated statistical significance.
Results
Colonization rate of Akkermansia muciniphila in southern China
The detailed results of applying real‐time PCR to 172 human faecal samples from five age groups are shown in Table 1. The highest colonization rate among the different age groups was in those older than 60, at 69·23%. Total bacteria counts using the DAPI stain method were extrapolated to estimate A. muciniphila as a percentage of overall bacteria. All data are given in Fig. 1 and Table 1.
Table 1.
Colonization rate of Akkermansia muciniphila in southern China
| Age (years) | Female | Male | Average colonization rate (%) | Log (A. muciniphila cells) g−1 faeces | Proportion of total bacteria (×10−5) | Log (total bacteria) g−1 of faeces | ||
|---|---|---|---|---|---|---|---|---|
| Colonization rate (%) | Log (A. muciniphila cells) g−1 faeces | Colonization rate (%) | Log (A. muciniphila cells) g−1 faeces | |||||
| <1 | 5/10 (50·00) | 3·04 (2·64–5·6) | 8/20 (40·00) | 3·36 (2·96–4·72) | 13/30 (43·33) | 3·21 (2·89–4·72)a | 1 : 11·7 | 9·14 (8·47–10·92) |
| 1–10 | 6/12 (50·00) | 5·60 (3·18–7·01) | 10/20 (50·00) | 5·75 (3·97–7·03) | 16/32 (50) | 5·76 (3·72–7·02)b | 1 : 2·75 | 10·32 (9·46–10·91) |
| 10–30 | 4/12 (33·33) | 5·09 (4·77–5·78) | 7/18 (38·89) | 3·26 (3·12–4·99) | 11/30 (36·67) | 4·50 (3·18–5·73) | 1 : 724 | 10·64 (10·35–10·93) |
| 30–60 | 10/22 (45·45) | 3·68 (3·25–5·03) | 12/19 (63·16) | 3·42 (3·01–4·71) | 22/41 (53·66) | 3·58 (3·11–5·23) | 1 : 117 | 10·51 (10·16–10·76) |
| >60 | 11/15 (73·33) | 5·30 (4·36–6·81) | 16/24 (66·67) | 5·88 (3·3·45–7·46) | 27/39 (69·23) | 5·58 (3·68–7·23)c | 1 : 1·05 | 10·56 (9·722–10·96) |
| Total | 36/71 (50·70) | 4·89 (3·22–6·57) | 53/101 (52·48) | 4·25 (3·18–6·25) | 89/172 (51·74) | 4·50 (3·18–6·32) | 1 : 11·7 | 10·36 (9·67–10·79) |
Due to non‐normal distribution, microbial data were expressed as median, with interquartile ranges in parentheses.
Control group.
Significant differences between under 1 year faecal samples and 1–10 years samples (P < 0·05) according to the Mann–Whitney U‐test.
Significant differences between under 1 year faecal samples and older than 60 years samples (P < 0·01) according to the Mann–Whitney U‐test.
Figure 1.
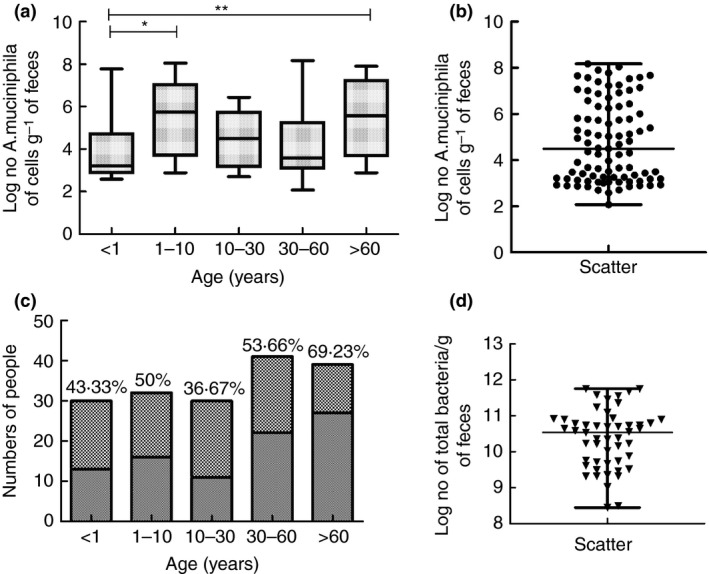
Colonization rate and quantity of Akkermansia muciniphila. Due to non‐normal distribution, microbial data are expressed as the median, with interquartile ranges in parentheses. (a) (log [no. of A. muciniphila cells] g−1 faeces) in five different age groups; (b) Scatter‐spot distribution of (log [no. A. muciniphila cells] g−1 faeces). (c) Number of positive and negative subjects and the colonization rate in the five different age groups; ( ) positive, (
 ) negative. (d) Scatter‐spot distribution of (log [no. of total bacteria] g−1 faeces). *Significant differences (P < 0·05) and **Significant differences (P < 0·01) were determined by a Mann–Whitney U‐test.
The colonization rate among male subjects was 53 out of 101 (52·48%) with actual levels ranging from 3·18 to 6·25 log (cells) g−1, while in female subjects 36 out of 71 (50·70%) were colonized with A. muciniphila at levels of from 3·22 to 6·58 log (cells) g−1. There was no difference between the two groups according to the Mann–Whitney U‐test (Table 1).
These data indicated that A. muciniphila bacteria had been present in the subjects’ early lives and had stably colonized the human gastric intestinal tracts of southern China, and for lifelong time periods. Comparative colonization rates for subjects in Europe and southern China are given in Table 2. European colonization data were referenced from Collado et al. (2007). This data showed that the European colonization rate (74·70%) is much higher than rate in the Chinese population (51·74%) (Table 2).
Table 2.
Colonization rates in Europe and southern China
| Age (years) | European (%) | South China (%) |
|---|---|---|
| <1 | 89/150 (59·33) | 13/30 (43·33) |
| 1–60 | 54/54 (100) | 49/103 (47·57) |
| >60 | 43/45 (95·56) | 27/39 (69·23) |
| Average | 186/249 (74·70) | 89/172 (51·74)a |
European colonization rate was adapted from data in the study by Collado et al. (2007).
Significant differences between Europe's colonization rate and the southern China colonization rate (P < 0·05) according to χ 2 test.
Isolate 22 strains of Akkermansia muciniphila from human faeces
Detailed information of isolation subjects and 16sRNA sequences blast results
Twenty‐two strains were isolated from human faeces. Among the subjects, three individuals had two different strains. According to age distribution, 59·1% (13/22) of the strains were isolated from subjects aged over 50. Only two strains were isolated from teenagers, with an isolation rate of about 9·1% (2/22). A further seven strains were isolated from the group aged 30–49 years. 16sRNA sequences blast results reveal that 100% (22/22) strains were similar to ATCC BAA‐835 (Table 3).
Table 3.
Detailed information of isolation hosts and 16sRNA sequences blast results
| No. | Code name | Sex | Age (years) | Strains (Accession) | 16sRNA sequence identity | Subtype |
|---|---|---|---|---|---|---|
| 1 | MucT | ATCC BAA‐835 | NR_074436.1 | 100 | E1 | |
| 2 | GP01 | Male | 8 | KT340078 | 99 | E1 |
| 3 | GP02 | Male | 90 | KT340079 | 99 | E8 |
| 4 | GP03 | Male | 63 | KT340080 | 99 | E5 |
| 5 | GP04 | Female | 30 | KT340081 | 100 | E5 |
| 6 | GP05‐1 | Female | 44 | KT340082 | 100 | E3 |
| 7 | GP05‐2 | KT340083 | 100 | E1 | ||
| 8 | GP06 | Male | 59 | KT340084 | 100 | E3 |
| 9 | GP07 | Female | 80 | KT340085 | 100 | E10 |
| 10 | GP11 | Female | 90 | KT340090 | 99 | E12 |
| 11 | GP12‐1 | Male | 19 | KT340091 | 99 | E11 |
| 12 | GP12‐2 | KT340092 | 99 | E8 | ||
| 13 | GP15 | Male | 84 | KT340094 | 99 | E8 |
| 14 | GP16 | Female | 51 | KT340095 | 100 | E1 |
| 15 | GP20 | Male | 73 | KT340096 | 100 | E1 |
| 16 | GP21‐1 | Male | 61 | KT340097 | 99 | E1 |
| 17 | GP21‐2 | KT340098 | 99 | E4 | ||
| 18 | GP22 | Female | 57 | KT340099 | 99 | E2 |
| 19 | GP23 | Female | 61 | KT340100 | 99 | E9 |
| 20 | GP24 | Male | 46 | KT340101 | 99 | E6 |
| 21 | GP25 | Female | 82 | KT340102 | 99 | E7 |
| 22 | GP29 | Male | 49 | KT340105 | 100 | E1 |
| 23 | GP30 | Male | 61 | KT340106 | 99 | E9 |
Species specific PCR and general PCR for Akkermansia muciniphila bacteria
In order to verify that the 22 strains were target strains, species specific PCR using AM1 and AM2 primers was used. To further define the 22 strains’ species, sequencing was conducted on the general PCR product of 16sRNA, using 27F and 1492R primers. All strain results were positive.
ERIC‐PCR of the 22 strains
Fingerprinting with ERIC primers generated 12 distinct bands between 50 and 3000 bp. These distinct bands were used for comparative analysis (Fig. 2 and Fig. S1). The growth curve of the first A. muciniphila strain GP01 in medium (BHI+ 0·2% hog gastric mucin medium) was measured. The doubling time was approx. 1·4 h in this medium (Fig. S2).
Figure 2.

Lane 1–23 correspond to NO.1–23 in Table 3. MW: marker lane, DL2000 DNA Marker. N, negative control lane.
Analysis of dendrogram and phylogenetic tree
Twelve different clusters from the 22 strains were distinguished with the delineation level at 100%. Subtype E1 was abundant in the 19 Chinese human faecal samples, and more than one A. muciniphila subtype may exist in a single sample (Fig. 2 and Fig. S2). Almost‐complete 16sRNA gene sequences of 22 strains were compiled and a phylogenetic tree showing the position of all 22 strains was created, using the maximum likelihood method, and is shown in Fig. S3. The relationships between A. muciniphila subtypes and human health are at present unknown and warrant further investigation.
Discussion
Akkermansia muciniphila colonization rates in southern China were found to be lower than in European populations (51·71 vs 74·70%). The highest colonization rates were among the elderly in southern China and in adults in Europe. There was no difference between male and female colonization rates in southern China. The influence of factors such as geographic location, age and dietary habits on physiological variations in the microbiota have been reported previously (Finegold et al. 1974; Raoult 2012; Thaiss et al. 2014). High‐level colonization of up to 39 and 84% of the human gut by the Verrucomicrobia phylum has been reported in two patients following broad‐spectrum antibiotic treatment, and all reads were assigned to A. muciniphila (Dubourg et al. 2013). Studying adult faecal microbiota in a North American cohort, Wu reported that enterotypes are associated with long‐term dietary habits (Wu et al. 2011). Diets with low fibre diversity can modulate the overall dominant microbiota, while diets rich in a diversity of plant fibres could promote the diversification of the overall microbiota by promoting diverse, dominant hydrolytic bacteria (De Filippo et al. 2010; Claesson et al. 2011; Yatsunenko et al. 2012). All of the above factors may lie behind this intercontinental diversity in the colonization rate.
Culture‐dependent approaches are traditional and essential means for microbial research. These approaches are based on the cultivation of natural isolates that can be screened for activities of interest, such as the action of enzymes, antimicrobial activity or resistance to antibiotics (Vester et al. 2015). However, only a small minority of micro‐organisms can be cultured from samples of the intestinal tract. Improving culture‐dependent approaches and obtaining new species thereby would greatly enhance the development of microbiology. In order to culture more A. muciniphila strains, our team developed the culture‐dependent sPCR‐directed method to isolate similar strains from different fresh faecal samples based on the method described by Muriel (Derrien et al. 2004). This method saves time in isolation of the bacteria and we successfully isolated 22 strains from Chinese human faecal samples. Studying the complexity of microbial communities in the gut is a challenge, and better isolation methods are required for more conclusive research into the gut microbiome. Improved cultivation should be combined with the new tools of metagenomics.
Faeces samples were selected on the basis of species specific PCR, and 22 strains were isolated from faecal samples. Different people had different subtypes, and three subjects presented multiple subtypes. Meta‐genomic data suggested that at least eight different species of the Akkermansia genus, apart from A. muciniphila, colonize the intestines of humans, and simultaneous colonization by different species can occur (van Passel et al. 2011; Belzer and de Vos 2012). Discrimination of A. muciniphila isolates below the species level is very important to understand the detailed composition of the gut microbiome and enable future function analysis. The molecular methods of ERIC‐PCR were able to further classify the subtypes present in these samples. This method displayed higher subtyping sensitivity, required no specific technical expertise and made use of common laboratory reagents (Wattiau et al. 2011; Schumann and Pukall 2013). By using ERIC‐PCR, some bacterial strains such as Escherichia coli and Salmonella typhosa can help us locate the source of outbreaks (Hashemi and Baghbani‐Arani 2015). Our team was the first to try using this method for A. muciniphila isolate subtyping. Finally, we identified 12 subtypes with a delineation level of 100% in Chinese subjects. These findings enable us to investigate further the functionality of these strains in the human GI tract.
These data suggest that southern China has a high colonization rate. More than 12 different subtype strains reside in faecal samples. More in‐depth investigations are necessary to explain further the relationship between the A. muciniphila subtypes and human health.
Conflict of Interest
There authors declare that no conflicts of interest exist.
Supporting information
Figure S1 Dendrogram of the composite data set based on ERIC‐PCR primers. The UPGMA algorithm was used to group the DNA fingerprints.
Figure S2 OD600 of Akkermansia muciniphila in medium was measured on a Nanodrop 2000 UV‐Vis spectrophotometer from 8 to 48 h. The doubling time was 1·4 h.
Figure S3 Phylogenetic tree showing the position of all 23 strains as determined by the maximum likelihood method.
Acknowledgements
We thank Dr. Muriel Derrien for her helpful discussion in A. muciniphila isolation. We thank Professor Ning Fu for her constructive proposal in writing this paper. We thank Dawei Liang for his suggestions in data processing. This research is supported partially by Guangzhou Kangze Medical Science and Technology Co. Limited, Guangzhou, Guangdong, China.
References
- Anhe, F.F. , Roy, D. , Pilon, G. , Dudonne, S. , Matamoros, S. , Varin, T.V. , Garofalo, C. , Moine, Q. et al (2015) A polyphenol‐rich cranberry extract protects from diet‐induced obesity, insulin resistance and intestinal inflammation in association with increased Akkermansia spp. population in the gut microbiota of mice. Gut 64, 872–883. [DOI] [PubMed] [Google Scholar]
- Belzer, C. and de Vos, W.M. (2012) Microbes inside–from diversity to function: the case of Akkermansia. ISME J 6, 1449–1458. [DOI] [PMC free article] [PubMed] [Google Scholar]
- Caputo, A. , Dubourg, G. , Croce, O. , Gupta, S. , Robert, C. , Papazian, L. , Rolain, J. and Raoult, D. (2015) Whole‐genome assembly of Akkermansia muciniphila sequenced directly from human stool. Biol Direct 10, 5. [DOI] [PMC free article] [PubMed] [Google Scholar]
- Claesson, M.J. , Cusack, S. , O'Sullivan, O. , Greene‐Diniz, R. , de Weerd, H. , Flannery, E. , Marchesi, J.R. , Falush, D. et al (2011) Composition, variability, and temporal stability of the intestinal microbiota of the elderly. Proc Natl Acad Sci USA 108, 4586–4591. [DOI] [PMC free article] [PubMed] [Google Scholar]
- Collado, M.C. , Derrien, M. , Isolauri, E. , de Vos, W.M. and Salminen, S. (2007) Intestinal integrity and Akkermansia muciniphila, a mucin‐degrading member of the intestinal microbiota present in infants, adults, and the elderly. Appl Environ Microbiol 73, 7767–7770. [DOI] [PMC free article] [PubMed] [Google Scholar]
- De Filippo, C. , Cavalieri, D. , Di Paola, M. , Ramazzotti, M. , Poullet, J.B. , Massart, S. , Collini, S. , Pieraccini, G. et al (2010) Impact of diet in shaping gut microbiota revealed by a comparative study in children from Europe and rural Africa. Proc Natl Acad Sci USA 107, 14691–14696. [DOI] [PMC free article] [PubMed] [Google Scholar]
- Derrien, M. , Vaughan, E.E. , Plugge, C.M. and de Vos, W.M. (2004) Akkermansia muciniphila gen. nov., sp. nov., a human intestinal mucin‐degrading bacterium. Int J Syst Evol Microbiol 54, 1469–1476. [DOI] [PubMed] [Google Scholar]
- Derrien, M. , Collado, M.C. , Ben‐Amor, K. , Salminen, S. and de Vos, W.M. (2008) The mucin degrader Akkermansia muciniphila is an abundant resident of the human intestinal tract. Appl Environ Microbiol 74, 1646–1648. [DOI] [PMC free article] [PubMed] [Google Scholar]
- Dubourg, G. , Lagier, J. , Armougom, F. , Robert, C. , Audoly, G. , Papazian, L. and Raoult, D. (2013) High‐level colonisation of the human gut by Verrucomicrobia following broad‐spectrum antibiotic treatment. Int J Antimicrob Agents 41, 149–155. [DOI] [PubMed] [Google Scholar]
- Eckburg, P.B. , Bik, E.M. , Bernstein, C.N. , Purdom, E. , Dethlefsen, L. , Sargent, M.Ô.G.S. , Nelson, K.E. and Relman, D.A. (2005) Diversity of the human intestinal microbial flora. Science 308, 1635–1638. [DOI] [PMC free article] [PubMed] [Google Scholar]
- Everard, A. , Belzer, C. , Geurts, L. , Ouwerkerk, J.P. , Druart, C. , Bindels, L.B. , Guiot, Y. , Derrien, M. et al (2013) Cross‐talk between Akkermansia muciniphila and intestinal epithelium controls diet‐induced obesity. Proc Natl Acad Sci USA 110, 9066–9071. [DOI] [PMC free article] [PubMed] [Google Scholar]
- Finegold, S.M. , Attebery, H.R. and Sutter, V.L. (1974) Effect of diet on human fecal flora: comparison of Japanese and American diets. Am J Clin Nutr 27, 1456–1469. [DOI] [PubMed] [Google Scholar]
- Hashemi, A. and Baghbani‐Arani, F. (2015) The effective differentiation of Salmonella isolates using four PCR‐based typing methods. J Appl Microbiol 118, 1530–1540. [DOI] [PubMed] [Google Scholar]
- Kaakoush, N.O. , Day, A.S. , Huinao, K.D. , Leach, S.T. , Lemberg, D.A. , Dowd, S.E. and Mitchell, H.M. (2012) Microbial dysbiosis in pediatric patients with Crohn's disease. J Clin Microbiol 50, 3258–3266. [DOI] [PMC free article] [PubMed] [Google Scholar]
- Ley, R.E. , Turnbaugh, P.J. and Klein, S. (2006) Human gut microbes associated with obesity. Nature 444, 1022. [DOI] [PubMed] [Google Scholar]
- Lim, H. , Lee, K.H. , Hong, C.H. , Bahk, G.J. and Choi, W.S. (2005) Comparison of four molecular typing methods for the differentiation of Salmonella spp. Int J Food Microbiol 105, 411–418. [DOI] [PubMed] [Google Scholar]
- Mai, V. , Young, C.M. , Ukhanova, M. , Wang, X. , Sun, Y. , Casella, G. , Theriaque, D. , Li, N. et al (2011) Fecal microbiota in premature infants prior to necrotizing enterocolitis. PLoS ONE 6, e20647. [DOI] [PMC free article] [PubMed] [Google Scholar]
- Nylund, L. , Satokari, R. , Nikkila, J. , Rajilic‐Stojanovic, M. , Kalliomaki, M. , Isolauri, E. , Salminen, S. and de Vos, W.M. (2013) Microarray analysis reveals marked intestinal microbiota aberrancy in infants having eczema compared to healthy children in at‐risk for atopic disease. BMC Microbiol 13, 12. [DOI] [PMC free article] [PubMed] [Google Scholar]
- van Passel, M.W. , Kant, R. , Zoetendal, E.G. , Plugge, C.M. , Derrien, M. , Malfatti, S.A. , Chain, P.S. , Woyke, T. et al (2011) The genome of Akkermansia muciniphila, a dedicated intestinal mucin degrader, and its use in exploring intestinal metagenomes. PLoS ONE 6, e16876. [DOI] [PMC free article] [PubMed] [Google Scholar]
- Pimentel, M. , Chow, E.J. and Lin, H.C. (2000) Eradication of small intestinal bacterial overgrowth reduces symptoms of irritable bowel syndrome. Am J Gastroenterol 95, 3503–3506. [DOI] [PubMed] [Google Scholar]
- Png, C.W. , Linden, S.K. , Gilshenan, K.S. , Zoetendal, E.G. , McSweeney, C.S. , Sly, L.I. , McGuckin, M.A. and Florin, T.H. (2010) Mucolytic bacteria with increased prevalence in IBD mucosa augment in vitro utilization of mucin by other bacteria. Am J Gastroenterol 105, 2420–2428. [DOI] [PubMed] [Google Scholar]
- Qin, J. , Li, Y. , Cai, Z. , Li, S. , Zhu, J. , Zhang, F. , Liang, S. , Zhang, W. et al (2012) A metagenome‐wide association study of gut microbiota in type 2 diabetes. Nature 490, 55–60. [DOI] [PubMed] [Google Scholar]
- Raoult, D. (2012) Human microbiota. [corrected]. Clin Microbiol Infect 18(Suppl 4), 1. [DOI] [PubMed] [Google Scholar]
- Schumann, P. and Pukall, R. (2013) The discriminatory power of ribotyping as automatable technique for differentiation of bacteria. Syst Appl Microbiol 36, 369–375. [DOI] [PubMed] [Google Scholar]
- Shin, N.R. , Lee, J.C. , Lee, H.Y. , Kim, M.S. , Whon, T.W. , Lee, M.S. and Bae, J.W. (2014) An increase in the Akkermansia spp. population induced by metformin treatment improves glucose homeostasis in diet‐induced obese mice. Gut 63, 727–735. [DOI] [PubMed] [Google Scholar]
- Swidsinski, A. , Dorffel, Y. , Loening‐Baucke, V. , Theissig, F. , Ruckert, J.C. , Ismail, M. , Rau, W.A. , Gaschler, D. et al (2011) Acute appendicitis is characterised by local invasion with Fusobacterium nucleatum/necrophorum . Gut 60, 34–40. [DOI] [PubMed] [Google Scholar]
- Tamura, K. , Peterson, D. , Peterson, N. , Stecher, G. , Nei, M. and Kumar, S. (2011) Mega5: molecular evolutionary genetics analysis using maximum likelihood, evolutionary distance, and maximum parsimony methods. Mol Biol Evol 28, 2731–2739. [DOI] [PMC free article] [PubMed] [Google Scholar]
- Thaiss, C.A. , Zeevi, D. , Levy, M. , Zilberman‐Schapira, G. , Suez, J. , Tengeler, A.C. , Abramson, L. , Katz, M.N. et al (2014) Transkingdom control of microbiota diurnal oscillations promotes metabolic homeostasis. Cell 159, 514–529. [DOI] [PubMed] [Google Scholar]
- Torpdahl, M. , Skov, M.N. , Sandvang, D. and Baggesen, D.L. (2005) Genotypic characterization of Salmonella by multilocus sequence typing, pulsed‐field gel electrophoresis and amplified fragment length polymorphism. J Microbiol Methods 63, 173–184. [DOI] [PubMed] [Google Scholar]
- Van den Abbeele, P. , Gerard, P. , Rabot, S. , Bruneau, A. , El, A.S. , Derrien, M. , Kleerebezem, M. , Zoetendal, E.G. et al (2011) Arabinoxylans and inulin differentially modulate the mucosal and luminal gut microbiota and mucin‐degradation in humanized rats. Environ Microbiol 13, 2667–2680. [DOI] [PubMed] [Google Scholar]
- Vester, J.K. , Glaring, M.A. and Stougaard, P. (2015) Improved cultivation and metagenomics as new tools for bioprospecting in cold environments. Extremophiles 19, 17–29. [DOI] [PMC free article] [PubMed] [Google Scholar]
- Vigsnaes, L.K. , Brynskov, J. , Steenholdt, C. , Wilcks, A. and Licht, T.R. (2012) Gram‐negative bacteria account for main differences between faecal microbiota from patients with ulcerative colitis and healthy controls. Benef Microbes 3, 287–297. [DOI] [PubMed] [Google Scholar]
- Wattiau, P. , Boland, C. and Bertrand, S. (2011) Methodologies for Salmonella enterica subsp. enterica subtyping: gold standards and alternatives. Appl Environ Microbiol 77, 7877–7885. [DOI] [PMC free article] [PubMed] [Google Scholar]
- Winokur, P.L. (2003) Molecular epidemiological techniques for Salmonella strain discrimination. Front Biosci 8, c14–c24. [DOI] [PubMed] [Google Scholar]
- Wu, G.D. , Chen, J. , Hoffmann, C. , Bittinger, K. , Chen, Y.Y. , Keilbaugh, S.A. , Bewtra, M. , Knights, D. et al (2011) Linking long‐term dietary patterns with gut microbial enterotypes. Science 334, 105–108. [DOI] [PMC free article] [PubMed] [Google Scholar]
- Yatsunenko, T. , Rey, F.E. , Manary, M.J. , Trehan, I. , Dominguez‐Bello, M.G. , Contreras, M. , Magris, M. , Hidalgo, G. et al (2012) Human gut microbiome viewed across age and geography. Nature 486, 222–227. [DOI] [PMC free article] [PubMed] [Google Scholar]
- Zhang, X. , Shen, D. , Fang, Z. , Jie, Z. , Qiu, X. , Zhang, C. , Chen, Y. and Ji, L. (2013) Human gut microbiota changes reveal the progression of glucose intolerance. PLoS ONE 8, e71108. [DOI] [PMC free article] [PubMed] [Google Scholar]
Associated Data
This section collects any data citations, data availability statements, or supplementary materials included in this article.
Supplementary Materials
Figure S1 Dendrogram of the composite data set based on ERIC‐PCR primers. The UPGMA algorithm was used to group the DNA fingerprints.
Figure S2 OD600 of Akkermansia muciniphila in medium was measured on a Nanodrop 2000 UV‐Vis spectrophotometer from 8 to 48 h. The doubling time was 1·4 h.
Figure S3 Phylogenetic tree showing the position of all 23 strains as determined by the maximum likelihood method.