

Abstract
Limited data are available on the fate of clothianidin under realistic agricultural production conditions. The present study is the first large‐scale assessment of clothianidin residues in soil and bee‐relevant matrices from corn and canola fields after multiple years of seed‐treatment use. The average soil concentration from 50 Midwest US corn fields with 2 yr to 11 yr of planting clothianidin‐treated seeds was 7.0 ng/g, similar to predicted concentrations from a single planting of Poncho 250‐treated corn seeds (6.3 ng/g). The water‐extractable (i.e., plant‐bioavailable) clothianidin residues in soil were only 10% of total residues. Clothianidin concentrations in soil reached a plateau concentration (amount applied equals amount dissipated) in fields with 4 or more application years. Concentrations in corn pollen from these fields were low (mean: 1.8 ng/g) with no correlation to total years of use or soil concentrations. For canola, soil concentrations from 27 Canadian fields with 2 yr to 4 yr of seed treatment use (mean = 5.7 ng/g) were not correlated with use history, and plant bioavailability was 6% of clothianidin soil residues. Average canola nectar concentrations were 0.6 ng/g and not correlated to use history or soil concentrations. Under typical cropping practices, therefore, clothianidin residues are not accumulating significantly in soil, plant bioavailability of residues in soil is limited, and exposure to pollinators will not increase over time in fields receiving multiple applications of clothianidin. Environ Toxicol Chem 2016;35:311–321. © 2015 The Authors. Published by Wiley Periodicals, Inc. on behalf of SETAC.
Keywords: Clothianidin, Neonicotinoid, Pollen, Fate and transport, Bioavailability, Adsorption
INTRODUCTION
Clothianidin, (E)‐1‐(2‐chloro‐1,3‐thiazol‐5‐ylmethyl)‐3‐methyl‐2‐nitroguanidine (CAS no. 210889‐92‐5), is a nitroguanidine neonicotinoid pesticide used in many crops to control various sucking and chewing insects. As a systemic insecticide, clothianidin can be used as a soil or foliar spray or as a seed treatment. The use of clothianidin as a seed treatment in corn and canola has gained wide acceptance in an effort to protect these crops against the major insect pests of concern to growers, such as the corn rootworm and European corn borer in corn and the flea beetle in canola 1.
Core regulatory studies required by the US Environmental Protection Agency (USEPA), Canadian Pesticide Management Regulatory Agency, and other global regulatory agencies indicate that clothianidin may degrade slowly in soil 2. The slow degradation of clothianidin in some regulatory studies has raised questions about the potential accumulation of clothianidin and other neonicotinoids in soil after use for multiple years 3, and little published data is currently available that has evaluated soil accumulation under typical agricultural conditions. The assumption of significant accumulation of neonicotinoids in soil has led to speculation that increased soil concentrations could lead to increased neonicotinoid residues in pollen and nectar of succeeding crops 4 and therefore increased exposure and risk to pollinators.
The assumptions of significant accumulation of neonicotinoids in soil are based on studies conducted under artificial conditions (laboratory tests) or under nonagricultural conditions (bare soil field tests). Laboratory studies are designed to focus on single environmental processes, such as photolysis, hydrolysis, or microbial degradation in soil or water 5. For example, aerobic soil metabolism studies are conducted under dark conditions and also suffer from decreasing microbial activity over the duration of the study 6. This is especially true for studies conducted for longer than 120 d, which was often the case for studies conducted prior to 2008. The decreasing microbial activity often leads to slower degradation and longer half‐life determinations. The soils from these studies are then extensively extracted with various organic solvents, heat, and pressure to remove as much of the residues from the soil as possible. The extraction procedures, however, will typically remove residues from the soil, which are not dissolved in the water phase of the soil and therefore are not easily available for uptake to plants. The regulatory field studies to measure dissipation 7 are also conservative in nature, being conducted under noncropped conditions, resulting in hot and dry soil conditions that may have a negative impact on microbial populations and therefore slow the microbial degradation of the pesticide.
A critical aspect of accurately predicting pesticide fate in soils is understanding that the processes of degradation and sorption occur concurrently. The process of sorption, often termed time‐dependent sorption, could be an increased binding of a chemical into interstitial pores or organic soil matrix over time 8. Time‐dependent sorption effectively limits microbial degradation and the bioavailability of sorbed residues, thereby reducing the portion of the total pesticide mass, which is in the soluble phase and available for either uptake into plants or for leaching 9, 10, 11, 12. For example, Negley et al. 9 reported time‐dependent sorption of clothianidin in 2 soils, as measured by the organic carbon partition coefficient, which increased from approximately 100 L/kg to 200 L/kg to a range of approximately 400 L/kg to 650 L/kg over a 99‐d period. Therefore, although measurable pesticide residues may remain in the soil the following growing season, they are likely strongly bound to the soil and largely not readily available for uptake by crops.
The objective of the present study was to conduct a large‐scale assessment of clothianidin residues in the United States and Canada and to quantify clothianidin residues in bee‐relevant crop matrices. The present study is the first large‐scale study to include paired measurements of clothianidin in pollen, nectar, and soil in production agricultural fields after multiple years of documented seed treatment use in both corn and canola. In addition to the organic solvent‐extractable total residues in soil from these sites, soils were also analyzed to determine the fraction of plant‐bioavailable clothianidin residues using a 0.01 M CaCl2 extraction method. This approach was designed to allow an assessment of residues that could be taken up from the soil and translocated to relevant plant matrices (corn pollen and canola nectar).
Results of the present study will be valuable for predicting future trends in clothianidin concentrations in pollen and nectar in 2 major bee‐relevant crops in the United States and Canada and in developing more accurate exposure assessments for pollinators. The present study will also shed new light on the fate and plant‐bioavailability of clothianidin residues in soil under realistic agricultural production conditions. In support of the soil accumulation aspects of the present North American study, we also describe a field accumulation study conducted at 3 locations in Europe, evaluating clothianidin residues in soil following annual applications for 7 yr in fields planted each year with winter wheat.
MATERIALS AND METHODS
US and Canada corn and canola assessment
The sites in the present study were located in 2 regions: corn‐producing areas in the Midwestern United States and canola‐producing areas in Western Canada. Data on the corn‐planted area were obtained through the US Department of Agriculture 13 and were used to guide site selection in each state. Clothianidin use information released by the US Geological Survey was also used in site selection in 2013 14. Canola‐harvested acreage data obtained from Statistics Canada 15 were used in determining the number of sites in Western Canada canola production areas. The identified growers and their willingness to participate was also a factor in site selection. The present study was conducted under USEPA good laboratory practices 16.
Corn sampling sites
In total, 50 sites were sampled, with 20 in 2012 and 30 in 2013. These 50 sites were located in Iowa (12 sites), Illinois (11 sites), Indiana (10 sites), Missouri (5 sites), Nebraska (5 sites), Minnesota (4 sites), and South Dakota (3 sites; Figure 1). The majority of soil at selected sites was classified as silty clay loam (22 of 50 sites), as well as other heavy texture classifications. Clay content ranged between 10% and 42%, sand content ranged from 4% to 66%, and silt content was 18% to 64%. Organic matter varied considerably, from 0.85% to 6.1%, and pH (in water) ranged from 4.8 to 8.1. Disturbed bulk density ranged from 0.95 g/cm3 to 1.27 g/cm3. Cation exchange capacity ranged between 9.8 milliequivalents and 31.9 milliequivalents per 100 grams. Moisture‐holding capacity (0.33 bar) ranged between 17.4% and 37.2% (Supplemental Data, Tables S1 and S2).
Figure 1.
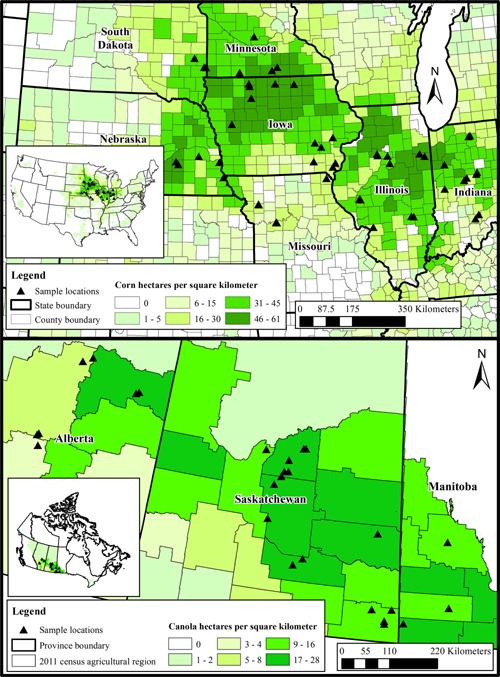
Cropping density and sampling site locations for corn field collection sites in the US (top) 13 and canola field collections in Canada (bottom) 15.
Each field was planted in corn treated with clothianidin at the time of sampling. The total number of years in which clothianidin‐treated seeds were used ranged between 2 yr and 11 yr, with 14 sites receiving clothianidin‐treated corn seeds every other year. The remaining sites have multiple patterns of use history due to corn rotations (Supplemental Data, Table S3). The average number of years was 4.7. Fourteen of the sites had been treated with thiamethoxam, a product that can be metabolized to clothianidin 17, primarily as soybean treatment. The range of years of thiamethoxam use was between 1 yr and 5 yr, with the greatest number of sites (6) having been treated with thiamethoxam for 2 yr; however, the years of thiamethoxam use was not considered in the statistical analysis of residue data.
Canola sampling sites
In total, 27 sites were identified in canola growing areas for inclusion in the present study. Five sites were sampled in 2012, 10 were sampled in 2013, and 12 were sampled in 2014. Sites were located in Saskatchewan (17 sites), Alberta (7 sites), and Manitoba (3 sites; Figure 1), Canada. The majority of soil in the canola fields was classified as loam (8 sites); clay, silty clay, or clay loam (14 sites); sandy clay loam (3 sites); and sandy loam (2 sites; Supplemental Data, Tables S4 and S5). Clay content ranged between 17% and 59%, sand content ranged from 15% to 58%, and silt content was 20% to 44%. Organic matter varied considerably, from 2% to 7.8%, and pH (in water) ranged from 5.9 to 8.0. Disturbed bulk density ranged from 0.88 g/cm3 to 1.24 g/cm3. Cation exchange capacity ranged between 15.7 milliequivalents and 39.8 milliequivalents per 100 grams. Moisture‐holding capacity (0.33 bar) ranged between 21.7% and 53%.
Each field was planted in canola treated with clothianidin, except for 2 sites that used thiamethoxam‐treated seeds in the sampling year of 2012 and 2013. Six of 12 sampling sites either did not plant canola or planted canola with thiamethoxam‐treated seeds at the time of sampling in 2014. This was the result of crop rotation practices and difficulties in finding farmers with a documented long history of clothianidin use and a willingness to participate. Each field had documented previous use history of clothianidin‐treated seeds (Supplemental Data, Table S6). Most sites had 2 yr to 3 yr of clothianidin‐treated seed use history prior to the sampling year, and 3 sites had a total of 4 yr of clothianidin‐treated seed use history prior to the sampling year. Only 4 of 27 sites had planted canola in 2 continuous years. The other sites had canola rotations; fields typically were rotated with wheat, but also with barley or flax, or they were left fallow between rotations. According to cooperating producers, planting canola with clothianidin‐ or thiamethoxam‐treated seeds every year was not a common agricultural practice in Western Canada.
Sample collection site establishment
Within each field site, 2 subplots (subplots 1 and 2) measuring approximately 15.2 m in width by 30.4 m in length were marked, and GPS coordinates of subplot corners were collected. Each subplot was then divided into 8 separate sampling squares, which measured approximately 7.6 m by 7.6 m. Subplots were located no closer than 30 m from each other and were located no closer than 30 m to the edge of the field.
Soil sampling and processing
Surface soil samples were collected manually from 0 cm to 30 cm using a 2.54‐cm or 5.0‐cm diameter hand auger. Soil‐characterization samples were collected from randomly selected sampling squares within Subplot 1 and composited to create an approximately 1‐kg soil characterization sample at each site. Characterization samples were stored at ambient temperature and shipped overnight to AGVISE Laboratories in Northwood, North Dakota, USA, for physical characterization according to good laboratory practice standards for the following properties: soil texture (% sand, silt, and clay); disturbed bulk density; moisture holding capacity; organic matter content; pH (H2O and CaCl2 methods); cation exchange capacity including major cations (Ca2+, Mg2+, Na+, and K+); and hydrogen (Supplemental Data, Tables S1–S4).
For clothianidin residue measurements, surface soil samples (0–30 cm) were collected manually using the same type of hand auger from each of the 8 sampling squares within each of the 2 subplots and composited for 2 samples per site. Soil samples were collected from the center of the row between plants to avoid collecting treated seeds. Soil samples from each subplot in corn fields were combined into labeled, plastic bags; placed in a cooler on wet ice; and shipped overnight to the sample processing facility. Soil samples from each subplot in canola fields were combined into labeled, plastic bags; placed in a freezer on a trailer with portable power generator; and then transferred by freezer trucks to the sample processing facility. Soil samples were homogenized with a hammer mill with dry ice, and 50‐g aliquots were shipped on dry ice to the analytical facility. The samples were kept frozen during processing and until they were extracted for analysis. In all cases, the hand auger equipment was scrubbed thoroughly and cleaned with water and rinsed with isopropyl alcohol between subplots.
Corn pollen sampling
Pollen sampling was not successful in 2012 because of severe and widespread drought conditions in the corn‐growing region of the Midwestern United States 18. However, corn pollen samples were collected successfully from all 30 sites in 2013. Corn tassels were cut from plants located adjacent to the soil sampling location within each subplot and were placed within doubled pollen sampling paper bags (Canvasback #T514; Seedburo Equipment), segregated by subplot. On the day of collection, pollen was removed from the tassels by shaking them for approximately 30 s into a second set of clean, doubled paper bags. In some instances, it was necessary to retain the corn tassels overnight and repeat the process of shaking the tassels the following morning to give more time for the pollen to dehisce from the anthers and provide an adequate sample volume. Pollen samples were collected from the bag with a Rocker 400 vacuum pump (United Chemical Technologies). The vacuum pump was equipped with tubing and a filtered pipette tip for sample collection. Pollen was vacuumed from the bag into the sample tip. After an appropriate number of sample tips were filled with pollen, the tips were cut and the pollen was emptied into amber glass 40‐mL vials. Pollen samples from each subplot were placed into separate vials, generating 1 pollen sample from each subplot per site. After collecting, samples were placed in a cooler on ice and stored chilled. Corn‐pollen samples were shipped under chilled temperature conditions on wet ice overnight to the analytical facility for residue analysis. The samples were kept frozen after they were received at the analytical facility until they were extracted and analyzed.
Canola nectar sampling
Attempts to collect canola pollen by hand were challenged by contamination by flower debris; therefore, sampling was limited to the more bee‐relevant canola nectar. Nectar samples were collected at a canola flowering stage of 30% to 70% in 2012 and 2013. Sufficient numbers of flowers around each soil core were collected and transported to a sample processing station at the edge of the field. At the processing station, the flower petals were extracted carefully from the flower for easier access to the nectar droplet located at the base of the sepals. The nectar droplet was collected from the anther base with a precision‐bore glass micro‐capillary tube using capillary action. The nectar was then transferred from the capillary tube and placed in a labeled, plastic 2‐mL centrifuge vial. Typically, 0.5 mL of nectar was collected from each of the 2 subplots, for a total of 2 samples per site. After collection, samples were frozen immediately and shipped in freezer trucks to the analytical facility for residue analysis. Sugar content (as sucrose equivalent) in canola floral nectar samples was measured using handheld refractometers, Model 45‐81 (range concentration 0–50 ° BRIX (Bx) units) and Model 45‐82 (range concentration 45–80 °Bx, Bellingham+Stanley). The average sugar content for all canola nectar samples was 37 °Bx with greater than 90% of the samples having sugar content from 12 °Bx to 63.5 °Bx. These measures indicate good nectar sample collection.
Analytical methods
For corn pollen and canola nectar, analytical methods were developed to determine the residues of clothianidin and its metabolites, N‐(2‐chlorothiazol‐5‐ylmethyl)‐N′‐nitroguanidine (TZNG; desmethyl clothianidin; CAS #135018‐15‐4) and N‐(2‐chlorothiazol‐5‐ylmethyl)‐N′‐methylurea (TZMU; clothianidin urea; CAS #634192‐72‐6).
Corn pollen
A 0.100‐g corn pollen sample was weighed into a 50‐mL polypropylene plastic centrifuge tube. A 10.0‐mL aliquot of HPLC‐grade water was added and shaken for 1 min; a further10.0 mL pesticide‐grade acetonitrile was added and shaken 1 min; 1.0 g NaCl and 2.0 g MgSO4 (anhydrous) was added and shaken again for 1 min. The sample was centrifuged at 4000 rpm for 5 min. A 9.0‐mL aliquot of the acetonitrile layer was pipetted into a new 50‐mL centrifuge tube containing 0.5 g of MgSO4 (anhydrous) and 5.0 mL of n‐hexane. The sample was shaken for 1 min then centrifuged at 2000 rpm for 5 min. The hexane layer was removed and discarded along with oily residues sometimes found in pollen. An 8.0‐mL aliquot of acetonitrile layer was pipetted into a 10‐mL glass conical glass tube, and the extract was brought to dryness using a gentle stream of nitrogen and a water bath at 70 °C. The residue was redissolved the residues in 1.0 mL of methanol/water (40:60, v/v) acidified with 0.05% formic acid, spiked with isotopically‐labeled internal standards, filtered through a Whatman 0.2 μm nylon membrane syringe filter, and analyzed by liquid chromatography–tandem mass spectrometry (LC/MS‐MS). The limit of detection (LOD) and the limit of quantitation (LOQ) for each analyte in corn pollen were 0.25 ng/g and 1 ng/g, respectively.
Canola nectar
In the canola nectar samples, 0.100 g of canola nectar was weighed into a 2‐mL glass autosampler vial, dissolved in 1 mL of methanol/water (40:60, v/v), and acidified with 0.05% formic acid. The samples were spiked with isotopically‐labeled internal standards filtered through a Whatman 0.2‐μm nylon membrane syringe if particles were present, and then analyzed by LC/MS‐MS. The LOD and the LOQ for each analyte in canola nectar were 0.2 ng/g and 1 ng/g, respectively.
All pollen and nectar samples were analyzed by LC/MS‐MS using an Applied Bioscience, API4000 triple quadruple mass spectrometer (Applied Biosystems) coupled with Agilent 1200 HPLC (Agilent Technologies). High purity analytical standards were used for calibration, and all samples were spiked with isotopically labeled internal standards (d3‐clothianidin, 13C, 5N‐TZNG, and d3‐TZMU) prior to analysis to compensate for matrix effects. Detailed chromatography and mass spectrometry parameters are provided in the Supplemental Data.
Soil
For soil samples, clothianidin was the only analyte tested. For total extractable residue measurements, 20.0 g of soil was weighed into a 50‐mL polypropylene centrifuge tube, extracted with methanol and water (40:60, v/v), and acidified with 0.05% formic acid. The sample was shaken on an orbital shaker for 1 hr and then centrifuged. Extraction was repeated again with a fresh portion of solvent. The supernatants were combined and then spiked with isotopically labeled internal standard (d3‐clothianidin) to compensate for matrix effects during analysis. An aliquot of the sample supernatant was filtered through a Whatman 0.2‐μm nylon membrane syringe filter or Whatman 0.7‐μm glass fiber membrane syringe filter directly into an autosampler vial.
For plant‐bioavailable fraction measurements, a 20‐g soil sample was weighed into a 50‐mL polypropylene centrifuge tube and extracted with 25.0 mL of 0.01 M CaCl2. The sample was shaken on an orbital shaker for 24 hr on low speed and then centrifuged. An aliquot of the sample supernatant was filtered through a Whatman 0.2 μm nylon pipette filter disk directly into an autosampler vial, then spiked with isotopically labeled internal standard (d3‐clothianidin) to compensate for matrix effects.
All soil extracts were analyzed for clothianidin using an ultra performance liquid chromatograph with an exact‐mass quadrupole time of flight mass spectrometer using a Waters Model XEVO G2 QTOF mass spectrometer operating in negative electron spray ionization mode coupled with Waters H‐Class UPLC system (Water). The LOD was 1.3 ng/g for total residue and 0.3 ng/g for plant‐bioavailable fraction. The LOQ was 5 ng/g for both methods. Details of chromatographic and mass spectrometry parameters are provided in the Supplemental Data.
Concurrent recovery and field recovery
Clothianidin laboratory fortification samples were analyzed concurrently with each sample set to demonstrate method performance. Laboratory fortification samples were prepared using untreated control surrogate samples for nectar and pollen, and control soil samples were used for soil laboratory fortification samples. Each sample set included at least 1 untreated control and 2 fortification samples. Fortifications ranged from 1 ng/g to 10 ng/g for nectar and pollen samples and 5 ng/g to 50 ng/g for soil samples. Fortification recovery results for corn pollen were 88 ± 10%, 82 ± 5.2%, and 85 ± 11% (n = 6) for clothianidin, TZNG, and TZMU, respectively. Fortification recovery results for canola nectar were 101 ± 12%, 94 ± 12%, and 104 ± 17% (n = 6) for clothianidin, TZNG, and TZMU, respectively. Recovery of clothianidin from fortified soil samples averaged 86 ± 6.9% (n = 34) for the total extraction method and 91 ± 8.1% (n = 16) for the plant‐bioavailable method.
To determine the sample stability during transportation and storage, field recovery samples were prepared with 2 spiked levels for each matrix. Nectar and pollen field recovery were spiked with clothianidin, TZNG, and TZMU, and soil field recovery samples were spiked with clothianidin. To prepare the field recovery samples, we used control soil, as well as commercially available organic pollen and artificial nectar (which were prepared by diluting commercially available honey). A set of 21 samples for both nectar and pollen field recovery samples included 3 untreated control and 18 samples fortified with clothianidin and TZNG and TZMU at 2 levels: 2 ng/g and 10 ng/g. A set of soil field recovery samples included 3 untreated control and 6 samples fortified with clothianidin at 2 levels: 5 ng/g and 50 ng/g. These spikes were shipped to the field and then were shipped or stored together with the residue samples. The storage periods of these field recovery samples were longer than the residue sample storage periods. Recovery of clothianidin from soil sites averaged 96 ± 3% (n = 6) at canola sites and 91 ± 5% (n = 12) at corn sites; recovery of clothianidin, TZNG, and TZMU from corn pollen averaged 96 ± 8%, 102 ± 17%, and 91 ± 7% (n = 9), respectively; and recovery of clothianidin, TZNG, and TZMU from canola nectar averaged 91 ± 9%, 100 ± 5%, and 88 ± 3% (n = 6), respectively. The results showed that clothianidin was stable in soil, nectar, and pollen samples, and TZNG and TZMU were stable in nectar and pollen samples.
European soil accumulation experiment
A 7‐yr experiment was conducted at 3 sites in Europe from 2000 to 2007, in which clothianidin was applied at the same rate each year as a wheat seed treatment 19. One trial (a treated and control plot) was established in southern France (St. Etienne du Gres; silt loam, pH 8.55, 0.88% organic carbon [OC]), one in Germany (Hoefchen; silt loam, pH 6.92, 0.94% OC), and one in and Great Britain (Wellesbourne; sandy loam, pH 6.96, 0.76% OC). The plots ranged in size from approximately 300 m2 to 500 m2. The study was conducted according to good laboratory practices with the exception of weather data collection (air temperature, rainfall, and solar radiation), which was continuously recorded at each site throughout the study.
The same seed dressing formulation was used in all 3 trials: TI‐435 600 FS, which was a flowable concentrate containing 600 g/L clothianidin. A target seed dressing rate of 250 mL of product per hectare was used. Winter wheat was planted each year in Germany and Great Britain. Durham wheat was planted each year in France. A seeding rate of 180 kg seeds/ha was used in all trials. Seeding and therefore applying clothianidin occurred in October or November with harvest in July or August of the following year. Soil cultivation and the agronomic and maintenance activities on the trial plots were conducted according to the usual local agricultural practice, including harrowing to approximately 5 cm depth and plowing to approximately 25 cm to 30 cm depth once per year.
Samples of the treated seeds were collected just before application to determine application rates. One sample was analyzed for seeds except for year 3, when duplicate samples were analyzed. At each site, after the seed bed was prepared but prior to seeding, soil cores of 4.8 cm to 5.0 cm diameter were collected with a Wacker Hammer to a depth of 50 cm to determine the initial soil concentration (in 2000) or the concentration remaining from the previous application (all other years). Ten cores were collected randomly from the control plot; 24 cores were collected from the treated plot (4 cores from 6 subplots), and cores were divided into 10‐cm sections.
In all trials, 6 soil samples were also collected during the vegetation period in spring (∼180 d after seeding) using a 25 (L) cm × 25 (W) cm × 30 (D) cm steel frame where 10‐cm segments were collected with a spade. Samples were frozen within 24 h of sampling. For each sampling interval, control and treated samples from each soil layer from a subplot were individually homogenized using a Hammer mill prior to collecting an aliquot for analysis. Each soil sample was analyzed in duplicate.
Seeds and soil samples were extracted with microwave extraction using a water/acetonitrile mixture analyzed by high performance liquid chromatography using MS/MS detection in the multiple reaction monitoring mode using a method developed and validated by Sommer 20 and Nuesslein 21 (see Supplemental Data). Extracts were analyzed for the active ingredient, clothianidin, and 2 metabolites: N‐methyl‐N′‐nitro‐guanidine (MNG; CAS #4245‐76‐5) and TZNG. Quantitation was carried out using high purity calibration standards and isotopically‐labelled internal standards. The LOQ in soil was 5 ng/g and the LOD was validated with fortified samples as 2 ng/g for all 3 analytes. The LOQ was for 1.0 μg/g for seed samples. Residues levels in soil samples from control plots were all less than the LOD, and control seeds were all less than the LOQ. Mean recoveries (± relative standard deviation) from fortified soil samples at 5 ng/g, 50 ng/g, and 100 ng/g averaged 97 ± 6.1%, 97 ± 12%, and 95 ± 5.6% for clothianidin, MNG, and TZNG, respectively.
Statistical analysis methods
Residue data were evaluated statistically to assess the representativeness of the sampling program. This included descriptive statistics, including minimum, maximum, mean, frequency of detection, 95% upper confidence limit on the mean, and percentiles of clothianidin residues in soil, as well as correlation analysis between soil residues and environmental variables.
Data were evaluated using commercial statistical software, as well as freeware developed by the USEPA for the purpose of computing upper confidence limits for environmental datasets. SigmaPlot Ver 12.5 22 was used to develop probability plots and conduct regression analyses. Upper confidence bounds on the mean, key percentiles, variability, and sample size calculations were performed using USEPA's ProUCL 5.0 software 23.
Prior to calculating statistics, the mean soil residue distribution was evaluated using probability plots, which are within the family of univariate plotting techniques that provide a means of visually assessing the distribution of the values of a dataset in a variety of ways. The probability plots can be used for direct comparison with the dataset's quantiles; comparison with some theoretical distribution (e.g., normal, lognormal, or gamma) in a probability plot; or comparison with the distribution of some other observed dataset in a quantile–quantile plot. In addition to their value in detecting various distributional anomalies (e.g., inflection points indicating a mixture of underlying chemical populations, extreme values in the upper and/or lower tails of a distribution, which may indicate suspected outliers), these visual analyses are a valuable accompaniment to formalized statistical tests that provide a calculated probability (p value) of fit (e.g., tests of goodness‐of‐fit to theoretical distributions or outlier analyses).
The upper confidence limit on the mean of the soil data was calculated using ProUCL 5.0 23. Instead of a single estimate of the mean, a confidence interval generates a lower and upper limit for the mean at a specified confidence level. The estimate indicates how much uncertainty there is in the estimate of the true mean. Several considerations are required to estimate upper confidence limits. First, the underlying data distribution must be determined. In addition, if multiple populations are identified in the data (e.g., using probability plots), a statistician must determine the potential impact on the upper confidence limit. Finally, outliers distort all statistics, including upper confidence limits; therefore, outliers should be identified using probability plots, for example, prior to calculating statistics. ProUCL can apply as many as 15 different methods to the same dataset to arrive at a upper confidence limit on the mean. The calculation method should be based on the underlying distribution of the data (e.g., normal, lognormal, or gamma).
Upper‐bound statistics—including upper tolerance limits, upper prediction limits, and upper percentiles—were also calculated in ProUCL 5.0 23. Upper tolerance limits provide an interval within which at least a certain proportion of the population lies (e.g., 95% coverage) with a specified probability (95% confidence) that the stated interval does indeed contain that proportion of the population 23, 24. A 95/95 upper tolerance limit indicates that 95% of the population is contained within the limit with 95% confidence. Upper prediction limits represent a value such that the next 1 or more (k) samples will be less than the upper prediction limit at a specified level of confidence (e.g., 95% or 99%).
RESULTS AND DISCUSSION
Potential for clothianidin accumulation in agricultural soils with multiple applications
Corn production sites. Clothianidin concentrations in soil (mean of 2 subplots) were greater than the LOQ (5 ng/g) in 35 of 50 corn sites, exceeded the LOD (1.3 ng/g) in 14 additional sites, and were not detected at 1 site. The average concentration across the 50 sites was 7.0 ± 4.2 ng/g, with a 90th percentile concentration of 13.5 ng/g (Table 1; Supplemental Data, Table S7). The 95% upper prediction limit was 15.9 ng/g, indicating that if an additional sample were to be collected, there is a 95% probability that the mean residue for that site would be less than or equal to 15.9 ng/g. Results from the present study are similar to a recent study by de Perre et al. 25 of corn fields where clothianidin‐treated seeds were planted in 2 yr of 3 yr, with soil sampling occurring throughout the year. The de Perre et al. study 25 showed average clothianidin concentrations in surface soils (top 2 cm) that ranged from approximately 2 ng/g to 6 ng/g at a seed treatment rate of 0.25 mg/seed and 2 ng/g to 11.2 ng/g at a seed treatment rate of 0.5 mg/seed.
Table 1.
Summary of residues observed in soil, pollen, and nectar at corn and canola sites a
| Matrix | Analyte | No. of samples | Minimum (ng/g) | Maximum (ng/g) | Median (ng/g) | 90th percentile (ng/g) | Average ± SD (ng/g) |
|---|---|---|---|---|---|---|---|
| Corn | |||||||
| Soil | CLT | 50 | ND | 20.3 | 6.4 | 13.5 | 7.0 ± 4.2 |
| Pollen | CLT | 30 | ND | 5.7 | 1.2 | 5.4 | 1.8 ± 1.7 |
| TZNG b | 30 | ND | 0.42 | – | – | – | |
| TZMU c | 30 | ND | 0.92 | – | – | – | |
| Canola | |||||||
| Soil | CLT | 27 | 1.8 | 21.4 | 4.4 | 10.2 | 5.7 ± 4.0 |
| Nectar | CLT | 10 | 0.1 | 2.4 | 0.33 | 1.7 | 0.58 ± 0.64 |
| TZNG | 10 | ND | – | – | – | – | |
| TZMU | 10 | ND | – | – | – | – |
The value of 0.5 × limit of detection (LOD) was used to calculate the average for a particular site if 1 of the duplicate samples was less than the LOD at that site.
Compound was only detected in 3 out of 30 samples, and all the detections were less than limit of quantitation; therefore no median, average, and 90th percentile were calculated.
Compound was only detected in 8 out of 30 samples, and all the detections were less than limit of quantitation; therefore, no median, average, and 90th percentile were calculated.
ND = concentration below limit of detection; CLT = clothianidin; TZNG = N‐(2‐chlorothiazol‐5‐ylmethyl)‐N′‐nitroguanidine; TZMU = N‐(2‐chlorothiazol‐5‐ylmethyl)‐N′‐methylurea; SD = standard deviation.
The results of the present study are also supported by a recent report by Schaafsma et al. 26. Neonics were measured in soils collected from the seeding zone from 25 production corn fields in Southwestern Ontario. These fields had been planted with treated seeds for up to 7 yr. The concentration of clothianidin residues were similar to those observed in the present study and ranged from nondetect to 20.4 ng/g, with an average of 4.0 ± 1.1 (2013 sampling) and 5.6 ± 0.9 ng/g (2014 sampling); no significant accumulation was observed. Schaafsma et al. 26 also reported an estimated dissipation half‐life in the field conditions of between 0.5 yr to 0.7 yr.
Linear regression analysis was conducted to determine if there was a statistically significant relationship between total clothianidin residues in soil and potential explanatory variables. Soil residues were not significantly correlated (all correlations assessed at α = 0.05) with measured soil parameters, including bulk density, percentage of sand, percentage of silt, percentage of clay, or moisture content. In addition, soil residues were not significantly correlated with locations (latitude), tillage practices, and soil chemistry parameters, including cation exchange capacity and pH. However, there was a weak but statistically significant correlation of soil residues with the soil organic matter content (r 2 = 0.157, p = 0.004), which accounts for 16% of the observed clothianidin variability. The total number of historical applications at a site only explained up to 25% of the variability in soil residues (r 2 = 0.250, p = 0.0003), whereas the total number of historical applications at a site in the most recent 5 yr prior to sampling explained up to 40% of the variability in soil residues (r 2 = 0.399, p ≤ 0.0001). The relationship of clothianidin residue and number of historical applications was generally the strongest for sites that were treated for 1 yr to 5 yr. For sites treated for 5 yr or more, there was no visible increase in mean residues in soil, indicating no accumulation after 4 yr or 5 yr of clothianidin use or a plateauing of concentrations (Figure 2A). The plateauing of soil concentrations occurs when the degradation rate is sufficient to degrade the amount of chemical being applied annually. The most critical aspect in interpreting soil accumulation is that a linear increase in concentration is not likely the correct evaluation of the data and will greatly overestimate potential accumulation, as done for imidacloprid 4. The appropriate interpretation of soil accumulation data should include an evaluation of degradation kinetics and should also consider if the study was conducted for a sufficient amount of time to fully evaluate the potential plateauing timing and magnitude.
Figure 2.
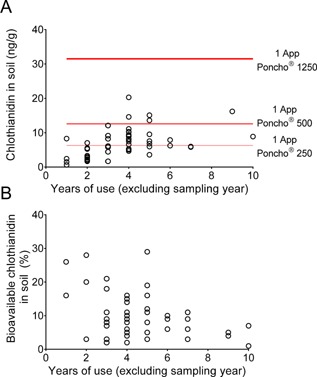
(A) Comparison of clothianidin concentration in soil with years of clothianidin use for corn sites. Red lines indicate theoretical concentration from a single application of clothianidin‐treated seeds for 3 formulations. (B) Comparison of bioavailable fraction expressed as percentage of total clothianidin residues in soil with years of clothianidin use for corn sites.
To further examine results with respect to plateauing trends of concentrations with years of use, results were compared with theoretical soil concentrations expected from a single seed treatment application. Assuming a typical seeding density of 84 000 seeds/ha, a soil depth of 30 cm, a soil bulk density of 1.1 g/cm3 (average from the 50 corn sites), and a single application of Poncho 250 (0.25 mg clothianidin per seed), the resulting theoretical soil concentration is approximately 6.3 ng/g. The average soil concentration for the 50 corn sites in the present study was 7.0 ng/g, and therefore similar to the predicted concentration from a single application of clothianidin at the lowest application rate for corn (Figure 2A). Considering that the average concentration was calculated from sites with multiple years of applications, and with many applications at significantly higher rates (i.e., 0.5 mg/seed or 1.25 mg/seed), the measured soil concentrations suggested that a significant portion of the clothianidin was degrading. Of the 50 sites, 45 had soil concentrations below the theoretical concentration of 12.6 ng/g expected from a single planting of Poncho 500 corn seed (0.5 mg clothianidin per seed), and all sites had soil concentrations below the theoretical concentration of 31.5 ng/g for a single planting of Poncho 1250 (1.25 mg clothianidin per seed). For the sites that had the longest clothianidin use histories, such as site 37 (10 yr) and site 45 (11 yr), the clothianidin soil residues were only 16.2 ng/g and 8.9 ng/g (Figure 2A; Supplemental Data, Table S3), respectively. Even considering that these were typically Poncho 250 treatments, these low residues show that concentrations do not continue to increase over long periods of use.
The experimentally defined plant‐bioavailable concentration (0.01 M CaCl2 extractable) of clothianidin was determined in all replicate soil samples where total residues exceeded the LOQ of 5 ng/g (n = 61). Of these 61 samples, all but 7 exceeded the LOD of 0.3 ng/g, with an average plant‐bioavailable concentration of 1.0 ng/g, and a 90th percentile concentration of 2.1 ng/g. The average plant‐bioavailable fraction (plant bioavailable residue/total residue) expressed as a percentage was 10% (Supplemental Data, Table S8). The plant‐bioavailable fraction showed no correlation with the years of clothianidin use (Figure 2B). A visual examination of the data suggests that plant‐bioavailability of residues is generally decreasing with years of use, and is likely due to time‐dependent sorption. Still, the number of fields with large numbers of years of use is too limited to make a firm conclusion.
Canola production sites
Clothianidin was detected in the soil at concentrations above the LOQ (5 ng/g) at 11 of 27 canola sites and above the LOD (1.3 ng/g) at the remaining 16 sites. The average concentration in soil was 5.7 ng/g, and the 90th percentile concentration was 10.2 ng/g (Table 1; Supplemental Data, Table S9). The 95% upper prediction limit was 12.1 ppb, indicating that if an additional sample were to be collected, there is a 95% probability that the mean residue for that site would be less than or equal to 12.1 ppb. The measured residues can be compared with theoretical soil residues of 1 application of Prosper, a clothianidin‐treated seed (theoretical is based on a typical canola seeding density of 5.6 kg/ha, a soil depth of 30.5 cm, and a soil bulk density of 1.1 g/cm3; average of 27 canola sites). The average soil concentration from the canola sites was 5.7 ng/g, whereas a single application of Prosper (400 g clothianidin per 100 kg seed) gives a theoretical concentration of 6.7 ng/g. Four of the 27 sites had soil concentrations higher than the theoretical concentration of 6.7 ng/g expected from a single planting of Prosper canola seed, including a site with the highest residue of 21.4 ng/g which showed as a potential outlier with Q‐test (Figure 3A).
Figure 3.
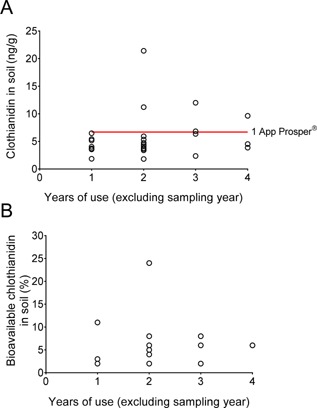
(A) Comparison of clothianidin concentration in soil with years of clothianidin use for canola sites. Red lines indicate theoretical concentration from a single application of clothianidin‐treated seeds. (B) Comparison of plant‐bioavailable fraction of total clothianidin in soil with years of clothianidin use for canola sites.
Linear regression analysis as discussed for the corn production sites was also conducted for the canola production sites to determine if there was a statistically significant relationship between total clothianidin residues in soil and potential explanatory variables, but none of the soil physical properties and soil chemistry parameters were significantly correlated with clothianidin residues in soil. Remaining environmental factors, including latitude, long‐term precipitation, soil moisture content, and clothianidin use history, were not significantly correlated with clothianidin residues in soil. As mentioned, more extensive use of rotation in canola production limited the number of fields with multiple years of consecutive clothianidin use that were available for sampling. This fact therefore limits the ability to observe trends.
The plant‐bioavailable fraction was analyzed in 23 replicate samples from canola field having total clothianidin concentrations greater than the LOQ. Of these 23 samples, the concentration of residues was greater than the LOD (0.3 ng/g) in all but 6, with an average concentration of 0.6 ng/g, and the 90th percentile concentration being 1.3 ng/g (Supplemental Data, Table S10). The average plant‐bioavailable concentration was 6% of the total extractable concentration, with a range of 2% to 11% with 1 exception with a value of 24% (total residue of 6.6 ng/g and plant‐bioavailable 1.6 ng/g [<LOQ]). An examination of plant‐bioavailable fraction with years of use displayed no discernable trend with time (Figure 3B).
European soil accumulation experiment: Winter wheat production
Results of the 7‐yr experiment 19 indicated that clothianidin residues remained primarily in the top 30 cm of the soil column (Supplemental Data, Table S11) with only a few detections in the deeper soil layers, and that significant dissipation was observed after each year of use. For example, in the 3 trials conducted at 150 g a.i./ha, residues declined over the first year from 26 ng/g, 30 ng/g, and 32 ng/g to 2.5 ng/g, 6.8 ng/g, and 2.5 ng/g just prior to the next application, respectively. An analysis of temporal trends in concentrations of clothianidin in the top 30 cm indicates that dissipation occurs during the first 120 d or so after application at each site from September to November every year, and then concentrations continue to decline during the year (Figure 4). Concentrations of the metabolites TZNG and MNG were below the LOQ for all samples in all trials. Degradation appeared to be the primary dissipation pathway in soil, because leaching was minimal. This pattern of dissipation plus annual applications resulted in only a modest increase in clothianidin residues over time, and a plateau concentration was reached after 3 yr to 5 yr. The plateau concentrations were between 40 ng/g to 50 ng/g for the 3 sites (Figure 4), whereas the theoretical concentration for an application rate of 150 g/ha was 45 ng/g (assuming a soil depth of 30 cm; bulk density of 1.1 g/cm3). The results of this highly controlled experiment support the findings of plateauing behavior observed in the corn‐field sampling. The limited number of years of application in canola fields (≤4) and complexity of the crop rotations with canola does not allow for the same evaluation, but a similar behavior is expected.
Figure 4.
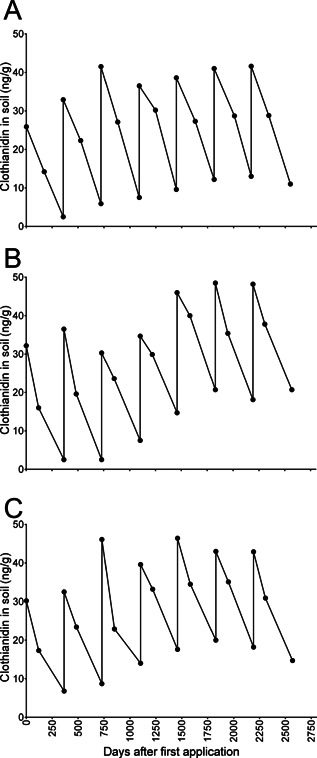
Soil concentrations of clothianidin (ng/g) in the top 30 cm for each of 3 field trials throughout the 7‐yr experiment: field sites located in (A) Germany, (B) France, (C) United Kingdom.
Potential to increase clothianidin uptake with multiple applications
In corn pollen, clothianidin was observed greater than the LOQ (1 ng/g) in 18 of 30 sites where pollen samples were obtained successfully. The remaining sites exceeded the LOD (0.25 ng/g), with 1 nondetect. The average clothianidin residue in corn pollen (0.5 × LOD used for the nondetect) was 1.8 ng/g, with a 90th percentile concentration of 5.4 ng/g. Interestingly, TZNG was detected at only three 3 sites, and the concentrations were less than the LOQ. Moreover, TZMU was detected at 8 sites at concentrations greater than LOD but less than LOQ (Table 1; Supplemental Data, Table S12). No correlation was observed between pollen concentration and years of use, indicating residues from prior years do not influence pollen concentrations in subsequent years (Figure 5A). In addition, there was no indication that clothianidin concentrations in pollen were higher than fields with higher concentrations of clothianidin in soil (Figure 5B). Generally, pollen residues appear to be influenced by the amount of clothianidin on the treated seed from the current year's crop; for example, 3 of the 4 highest pollen concentrations were observed from sites where corn was treated with Poncho 1250 (Sites 21, 22, 23; Supplemental Data, Table S3).
Figure 5.
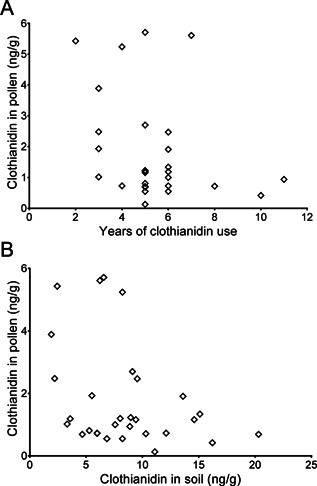
(A) Comparison of clothianidin concentration in corn pollen with years of clothianidin use, and (B) comparison of clothianidin concentrations in soil and corn pollen from the same field sites.
For canola nectar, clothianidin concentrations were greater than the LOQ (1 ng/g) in only 4 of 15 canola sites and were less than the LOD of 0.2 ng/g in 3 samples. The average concentration was 0.6 ng/g, with a 90th percentile concentration of 1.7 ng/g (Table 1; Supplemental Data, Table S13). Clothianidin metabolites, TZNG, and TZMU were not detected (< 0.2 ng/g) in any of the canola nectar samples. Clothianidin residues in canola nectar showed no correlation with the years of use of clothianidin or with clothianidin concentration in soil (Figure 6). Therefore, nectar residues are likely influenced only by the application that occurred in the sampling year.
Figure 6.
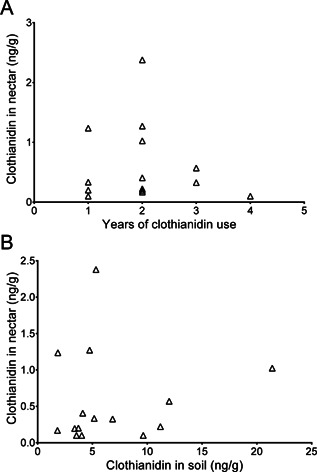
(A) Comparison of clothianidin concentration in canola nectar with years of clothianidin use, and (B) comparison of clothianidin concentration in soil and canola nectar from the same field sites.
Residues of neonicotinoids in pollen and nectar of succeeding crops have been evaluated primarily for imidacloprid. Imidacloprid was not detected (< 1.5 ng/g) in pollen from untreated sunflowers planted into soil containing 2 ng to 18 ng imidacloprid per gram of soil 27, which supports the results seen in the clothianidin trials reported in the present study. Similarly, Bonmatin et al. 28 reported low levels (< 1 ng/g) of imidacloprid in sunflower pollen from a field treated in the previous year but did not report soil concentrations, thereby limiting the ability to compare results.
CONCLUSIONS
The present large‐scale study provides an improved understanding of clothianidin fate and bioavailability in soils after multiple years of seed‐treatment use across a wide range of soil characteristics and in 2 major crops. Examination of soil concentrations from 50 fields with up to 11 yr of use of clothianidin indicates that total residues are at much lower concentrations than would be predicted by the highly conservative regulatory studies. Soil concentrations tend to increase slowly over the first 4 yr or 5 yr of use, but then do not show any continued increase. These results can be described by the plateauing behavior observed in a wheat‐cropped field plot study with 7 yr continuous seed‐treatment use. A more limited temporal dataset for canola did not exhibit any discernable trend with years of use. These results indicate that although clothianidin residues remain in the soil the following year, substantial dissipation is occurring during the growing season.
The present study also examined the extent to which clothianidin residues in soil were taken up by plants and into the pollinator‐bee relevant matrices of corn pollen and canola nectar. The concentrations in pollen and nectar showed no increase in clothianidin when compared with the years of clothianidin use in these fields or the concentration of clothianidin in the soil. Rather, pollen and nectar were influenced only by the application received in the sampling year. These results are consistent with the low amount of plant‐bioavailable residue in the soil, which in turn is consistent with the time‐dependent sorption behavior of clothianidin, where residues become more tightly bound in the soil matrix over time. This observed time‐dependent sorption behavior in soils may influence other important transport processes governing clothianidin fate, such as leaching or dissolved‐phase runoff. Therefore, although some residues remain in soils in subsequent years after application, it appears they are largely unavailable for plant uptake. Under typical cropping practices, clothianidin residues did not accumulate significantly, plant bioavailability of residues in soil is limited, and exposure to pollinators is not expected to increase over time even if a field has received multiple applications of clothianidin.
Supplemental Data
The Supplemental Data are available on the Wiley Online Library at DOI: 10.1002/etc.3281.
Data availability
All residue data and information on soil types and pesticide use history used in the manuscript and shown in the figures are provided in the Supplemental Data. Locations of sampling sites are shown in Figure 1; however, exact GIS coordinates for soil sampling locations are not publicly available due to privacy agreements with the producers participating in the present study.
Supporting information
This article includes online‐only Supplemental Data.
Supporting Information.
Acknowledgment
The authors greatly thank all the people involved in the field sampling, sample processing, analytical analyses, and statistical analyses. The authors are employed by companies that produce and sell clothianidin and products containing clothianidin. The present study was funded by Bayer CropScience and Valent USA.
REFERENCES
- 1. Hurley T, Mitchell PD. 2014. The value of neonicotinoids in North American agriculture: Value of insect pest management to U.S. and Canadian corn, soybean and canola farmers. AgInformatics, St. Paul, MN. [Cited 2015 February]. Available from: http://www.growing matters.org
- 2. Rexrode M, Barrett M, Ellis J, Gabe P, Vaughan A, Felkel J, Melendez J. 2003. EFED risk assessment for the seed treatment of clothianidin 600FS on corn and canola. US Environmental Protection Agency, Washington, DC.
- 3. Goulson D. 2013. An overview of the environmental risks posed by neonicotinoid insecticides. J Appl Ecol 50:977–987. [Google Scholar]
- 4. Jones A, Harrington P, Turnbull G. 2014. Neonicotinoid concentrations in arable soils after seed treatment applications in preceding years. Pest Manag Sci 70:1780–1784. [DOI] [PubMed] [Google Scholar]
- 5.US Environmental Protection Agency. 2012. Final test guidelines; OCSPP 850 series; Notice of availability. Fed Reg 77:38282–38285. [Google Scholar]
- 6.US Environmental Protection Agency. 2008. Fate, transport and transformation test guidelines: OPPTS 835.4100—Aerobic soil metabolism; OPPTS 835.4200—Anaerobic soil metabolism. EPA 712‐C‐08‐016, EPA 712‐C‐08‐017. Prevention, Pesticides, and Toxic Substances, Washington, DC.
- 7.US Environmental Protection Agency. 2008. Fate, transport and transformation test guidelines: OPPTS 835.6100—Terrestrial field dissipation. EPA 712‐C‐08‐020. Prevention, Pesticides, and Toxic Substances, Washington, DC.
- 8. Chen W, Laabs V, Kookana RS, Koskinen WC. 2014. Coupled sorption and degradation kinetics and non‐first order behavior In Chen W, Sabljic A, Cryer SA, Kookana RS, eds, Non‐first Order Degradation and Time‐Dependent Sorption of Organic Chemicals in Soil. ACS Symposium Series, Vol. 1174 American Chemical Society, Washington, DC, pp 5–37. [Google Scholar]
- 9. Negley T, Allen R, Tang J, Dyer D, Gehl K. 2014. The significance of time‐dependent sorption on leaching potential—A comparison of measured field results and modeled estimates In Chen W, Sabljic A, Cryer SA, Kookana RS, eds, Non‐first Order Degradation and Time‐Dependent Sorption of Organic Chemicals in Soil. ACS Symposium Series, Vol. 1174 American Chemical Society, Washington, DC, pp 337–356. [Google Scholar]
- 10. Mamy L, Barriuso E. 2007. Desorption and time‐dependent sorption of herbicides in soils. Eur J Soil Sci 58:174–187. [Google Scholar]
- 11. Van Beinum W, Beulke S, Fryer C, Brown C. 2006. Lysimeter experiment to investigate the potential influence of diffusion‐limited sorption on pesticide availability for leaching. J Agric Food Chem 54:9152–9159. [DOI] [PubMed] [Google Scholar]
- 12. Villaverde J, Van Beinum W, Beulke S, Brown CD. 2009. The kinetics of sorption by retarded diffusion into soil aggregate pores. Environ Sci Technol 43:8227–8232. [DOI] [PubMed] [Google Scholar]
- 13.US Department of Agriculture. 2012. National agricultural statistics service cropland data layer. Published county level planting estimates for corn. USDA–NASS, Washington, DC [Cited 2015 February]. Available from: http://nassgeodata.gmu.edu/CropScape/
- 14. Thelin GP, Stone WW. 2013. Estimation of annual agricultural pesticide use for counties of the conterminous United States, 1992–2009: US Geological Survey Scientific Investigations Report 2013–5009, Reston, VA, USA, pp 1–54.
- 15.Statistics Canada, CANSIM. 2011. Census of Agriculture, hay and field crops: Canola hectares in 2011—Table 004‐0213 [Cited 2015 February]. Available from: http://www5.statcan.gc.ca/cansim/pick‐choisir?lang=eng&p2=33&id=0040213
- 16.US Environmental Protection Agency. 1983. Federal Insecticide, Fungicide, and Rodenticide Act (FIFRA): Good Laboratory Practice Standards. Final Rule. Fed Reg 40 CFR Part 160.
- 17. Nauen R, Ebbinhaus‐Kintscher U, Salgado VL, Kaussmann M. 2003. Thiamethoxam is a neonicotinoid precursor converted to clothianidin in insects and plants. Pestic Biochem Phys 76:55–69. [Google Scholar]
- 18.National Oceanic and Atmospheric Administration, National Centers for Environmental Information. 2012. State of the climate: Drought for June 2012. [Cited 2015 October 8]. Available from: http://www.ncdc.noaa.gov/sotc/drought/201206
- 19. Heinemann O, Telscher M. 2009. Determination of the residues of TI‐435 in/on soil, winter wheat and durum wheat after seed treatment of TI 435 (600 FS) in Germany, Southern France and Great Britain. AG Report RA 2147/00. Bayer CropScience, Monheim, Germany.
- 20. Sommer H. 2003. Method 00540/M001 for the determination of resides of TI‐435, TZNG and MNG in soil by HPLC‐MS/MS. Bayer CropScience AG Report, MR‐106/02, Monheim, Germany, pp 1–43.
- 21. Nuesslein F. 2002. Residue analytical method 00552 for the determination of TI435 in plant materials by LC‐MS/MS. AG Report, MR 036/99. Bayer CropScience, Monheim, Germany.
- 22.Systat Software. ( 2011). SigmaPlot for Windows, Ver 12 or 12.5. San Jose, CA, USA.
- 23.US Environmental Protection Agency. 2013. ProUCL Version 5.0.00 Technical Guide EPA/600/R‐07/041 [Cited 2015 October 12] Available from: http://www2.epa.gov/sites/production/files/2015‐03/documents/proucl_v5.0_tech.pdf
- 24.US Environmental Protection Agency. 2006. Data quality assessment: Statistical methods for practitioners. EPA/240/B‐06/003 [Cited 2015 October 12] Available from: http://www2.epa.gov/sites/production/files/2015‐08/documents/g9s‐final.pdf
- 25. de Perre C, Murphy TM, Lydy MJ. 2015. Fate and effects of clothianidin in fields using conservation practices. Environ Toxicol Chem 34:258–265. [DOI] [PubMed] [Google Scholar]
- 26. Schaafsma A, Limay‐Rios V, Xue Y, Smith J, Baute T. 2016. Field scale examination of neonicotinoid insecticide persistence in soil as a result of seed treatment use in commercial maize (corn) fields in southwestern Ontario. Environ Toxicol Chem 35:295–302 (this issue). [DOI] [PubMed] [Google Scholar]
- 27. Schmuck R, Schoning R, Stork A, Schramel O. 2001. Risk posed to honeybees (Apis mellifera L. Hymenoptera) by an imidacloprid seed dressing of sunflowers. Pest Manag Sci 57:225–238. [DOI] [PubMed] [Google Scholar]
- 28. Bonmatin JM, Moineau I, Charvet R, Colin ME, Fleche C, Bengsch ER. 2005. Behavior of imidacloprid in fields. Toxicity for honey bees In Lichtfouse E, Schwarzbauer J, Robert D, eds, Environmental Chemistry: Green Chemistry and Pollutants in Ecosystems. Springer‐Verlag GmbH, Berlin, Germany, pp 483–494. [Google Scholar]
Associated Data
This section collects any data citations, data availability statements, or supplementary materials included in this article.
Supplementary Materials
This article includes online‐only Supplemental Data.
Supporting Information.
Data Availability Statement
All residue data and information on soil types and pesticide use history used in the manuscript and shown in the figures are provided in the Supplemental Data. Locations of sampling sites are shown in Figure 1; however, exact GIS coordinates for soil sampling locations are not publicly available due to privacy agreements with the producers participating in the present study.