

Abstract
Light and chloroplast function is known to affect the plant immune response; however, the underlying mechanism remains elusive. We previously demonstrated that two light signaling factors, FAR‐RED ELONGATED HYPOCOTYL 3 (FHY3) and FAR‐RED IMPAIRED RESPONSE 1 (FAR1), regulate chlorophyll biosynthesis and seedling growth via controlling HEMB1 expression in Arabidopsis thaliana. In this study, we reveal that FHY3 and FAR1 are involved in modulating plant immunity. We showed that the fhy3 far1 double null mutant displayed high levels of reactive oxygen species and salicylic acid (SA) and increased resistance to Pseudomonas syringae pathogen infection. Microarray analysis revealed that a large proportion of pathogen‐related genes, particularly genes encoding nucleotide‐binding and leucine‐rich repeat domain resistant proteins, are highly induced in fhy3 far1. Genetic studies indicated that the defects of fhy3 far1 can be largely rescued by reducing SA signaling or blocking SA accumulation, and by overexpression of HEMB1, which encodes a 5‐aminolevulinic acid dehydratase in the chlorophyll biosynthetic pathway. Furthermore, we found that transgenic plants with reduced expression of HEMB1 exhibit a phenotype similar to fhy3 far1. Taken together, this study demonstrates an important role of FHY3 and FAR1 in regulating plant immunity, through integrating chlorophyll biosynthesis and the SA signaling pathway.
Keywords: Arabidopsis, chlorophyll biosynthesis, FAR1, FHY3, light signaling, plant immunity, salicylic acid
Edited by: Hongwei Guo, Peking University, China
INTRODUCTION
Plants have evolved elaborate regulatory mechanisms to cope with adverse abiotic and biotic stresses at the cost of plant growth and development (Bray et al. 2000; Jones and Dangl 2006). In response to biotic stresses, plant cells undergo massive transcriptional reprogramming to activate immune response and resistance pathways. However, constitutive activation of plant immunity impairs growth and fitness. Therefore, in the absence of environmental challenges or when the stress is relieved, the plant immune response must be kept under tight genetic control (Tian et al. 2003).
Recognition of a pathogen effector by a host resistance (R) protein can lead to effector‐trigged immunity (ETI), which is characterized by the hypersensitive response (Jones and Dangl 2006). In plants, a suite of R proteins, mainly nucleotide‐binding (NB) and leucine‐rich repeat (LRR) domain‐containing proteins, are the major intracellular receptors that sense pathogen‐derived molecules (Caplan et al. 2008; Eitas and Dangl 2010; Heidrick et al. 2012). Activation of NB‐LRR R proteins leads to the production of salicylic acid (SA), a plant defense hormone that plays a central role in defense signaling; the upregulation of expression of pathogenesis‐related (PR) genes; and the induction of systemic acquired resistance (SAR) (Hammond‐Kosack and Jones 1996; Shah 2003; Vlot et al. 2009). Thus, overexpression of R genes often triggers an autoimmune response (Oldroyd and Staskawicz 1998; Stokes et al. 2002). Two pathways function downstream of the NB‐LRR R proteins. ENHANCED DISEASE SUSCEPTIBILITY 1 (EDS1) and its sequence‐related interacting partner PHYTOALEXIN DEFICIENT 4 (PAD4) act in basal resistance and ETI initiated by the Toll‐like/interleukin 1 receptor (TIR) type NB‐LRR R proteins (Vlot et al. 2009). EDS1 and PAD4 also amplify SA signaling via a positive feedback loop (Feys et al. 2001). NONSPECIFIC DISEASE RESISTANCE 1 (NDR1) regulates another subset of R proteins, coiled‐coil (CC) type NB‐LRR proteins (Century et al. 1997). Upon pathogen challenge, SA biosynthesis is strongly induced via the activity of SALICYLIC‐ACID‐INDUCTION DEFICIENT 2 (SID2), which encodes chloroplast‐localized isochorismate synthase I (ICS1) (Wildermuth et al. 2001). The Arabidopsis sid2 mutant is defective in pathogen‐induced SA synthesis and is severely compromised in disease resistance (Wildermuth et al. 2001). Increased SA levels induce redox changes and result in the reduction of NON‐EXPRESSOR OF PATHOGENESIS‐RELATED GENES 1 (NPR1) to a monomeric form that accumulates in the nucleus to activate defense‐responsive gene expression, resulting in plant immunity (Fu and Dong 2013).
Increasing evidence suggests that light has a profound influence on plant immunity, and full activation of the defense response to pathogens is often dependent on photoreceptors (Karpinski et al. 2003; Hua 2013). For instance, the Arabidopsis phytochrome B (phyB) mutant is susceptible to the fungal pathogen Fusarium oxysporum, and the Oryza sativa (rice) phyA phyB phyC triple mutant is susceptible to the blast fungus Magnaporthe grisea (Kazan and Manners 2011; Xie et al. 2011). Furthermore, phyA, phyB, and cryptochrome 1 (cry1) photoreceptors are required for SA‐regulated gene expression and SAR (Genoud et al. 2002; Wu and Yang 2010). Despite this recent progress, the molecular linkage between light signaling and plant immunity remains poorly understood.
In plants, tetrapyrroles and their derivatives play essential roles in a wide range of biological processes, including photosynthesis, respiration, and signal transduction (Mochizuki et al. 2010; Tanaka et al. 2011). The tetrapyrrole biosynthesis pathway consists of two main branches, i.e., the chlorophyll and heme branches. Previous studies reported that inhibition of several enzymes in the tetrapyrrole biosynthetic pathway induces cell death and/or SAR (Tanaka and Tanaka 2007). For example, transgenic tobacco (Nicotiana tabacum) with reduced activity of either uroporphyrinogen decarboxylase (UROD) or coproporphyrinogen oxidase (CPO) and Arabidopsis plants expressing an antisense protoporphyrinogen oxidase gene displayed necrotic leaf lesions, constitutive expression of PR genes, high levels of SA accumulation, and increased resistance to pathogens (Mock et al. 1990; Molina et al. 1999). In addition, the maize (Zea mays) les22 mutant with partial deficiency in UROD, the Arabidopsis CPO‐deficient mutant lesion initiation 2, and transgenic tobacco plants with reduced ferrochelatase expression displayed lesion‐mimic or necrotic phenotypes (Hu et al. 1998; Ishikawa et al. 2001; Papenbroack et al. 2001). However, the underlying mechanism by which tetrapyrrole biosynthesis contributes to the defense response is largely unknown.
In a previous study, we reported that two homologous transcription factors essential for phyA signaling, FAR‐RED ELONGATED HYPOCOTYL 3 (FHY3) and FAR‐RED IMPAIRED RESPONSE 1 (FAR1), directly bind to the promoter region of HEMB1 (which encodes a 5‐aminolevulinic acid dehydratase, ALAD) and activate its expression, and thus regulate chlorophyll biosynthesis and seedling growth (Tang et al. 2012). In this study, we found that both the fhy3 far1 double null mutant and transgenic plants in which HEMB1 was suppressed by artificial microRNA (amiRNA) display an autoimmune response, including accumulation of SA, strong induction of PR genes, and increased resistance to pathogen infection. We showed that overexpression of HEMB1 largely rescues the fhy3 far1 phenotype. Our findings suggest that FHY3 and FAR1 negatively regulate SA signaling and plant immunity by regulating HEMB1 expression, thus providing a possible molecular linkage between light signaling and plant immunity.
RESULTS
The adult fhy3 far1 double mutants undergo premature cell death
When generating the fhy3 far1 double mutant in a previous study (Lin et al. 2007), we noticed that its homozygotes grew slowly and had a stunted stature in the adult stage under long‐day conditions (16 h light/ 8 h dark), and that this phenotype became even more severe under short‐day conditions (8 h light/ 16 h dark) (Figure 1A). However, the fhy3‐4 and far1‐2 single parent mutant plants did not differ much from the No‐0 (Nossen) wild type, suggesting that FHY3 and FAR1 play redundant roles in controlling adult plant growth. Most remarkably, fhy3 far1 leaves developed necrotic lesions, resembling those formed during the hypersensitive response after pathogen entry (Figure 1A).
Figure 1.

Phenotypic analysis of the fhy3 far1 double mutant in the adult stage. (A) Morphology of the No‐0 wild type (WT), fhy3‐4, far1‐2 and fhy3far1 plants grown on soil under long‐day (LD, 16 h light/8 h dark) and short‐day (SD, 8 h light/16 h dark) conditions. The photographs were taken when the plants were 4 (LD) and 5 (SD) weeks old. Right panels are magnified photographs of fhy3 far1. Bars, 1 cm. (B) and (C) Trypan blue (B) and 3,3′‐diaminobenzidine (DAB) (C) staining of No‐0 WT, fhy3‐4, far1‐2, and fhy3far1 leaves taken from plants grown under LD conditions for 4 weeks. Bars indicate 2 mm in the upper panels and 50 μm in the lower panels.
When stained with trypan blue (which indicates dead cells), the leaves of fhy3 far1 were stained blue, whereas those of fhy3 and far1 plants were barely stained, as were those of the wild type (Figure 1B). 3,3′‐diaminobenzidine (DAB) staining showed that high levels of hydrogen peroxide (H2O2) were accumulated in the leaves of fhy3 far1, but not in those of the fhy3 or far1 plants (Figure 1C). These data suggest that loss of both FHY3 and FAR1 leads to constitutive activation of cell death and accumulation of reactive oxygen species (ROS).
FHY3 and FAR1 globally repress defense‐responsive genes
To determine how FHY3 and FAR1 regulate plant growth and cell death, we conducted a microarray analysis using 28‐d‐old long‐day‐grown fhy3 far1 double mutant and No‐0 wild‐type plants. Using a q‐value of <0.05 and a fold change of >2 as a cutoff, a total of 2,891 genes were found to be upregulated and 3,074 genes downregulated in fhy3 far1 compared with the wild‐type plants (Dataset S1). A gene ontology (GO) functional classification of the differentially expressed genes was performed using GOEAST software (Zheng and Wang 2008). GO analysis of biological processes showed that the upregulated genes in fhy3 far1 are largely involved in the response to biotic and abiotic stresses, and metabolic processes. Notably, genes involved in the plant's responses to chitin, fungi, bacteria, other organisms, and ROS and those regulated by SA‐mediated signaling and involved in the defense response were significantly overrepresented in fhy3 far1 compared with the wild‐type genome (Figure 2A). These genes include those encoding transcription factors of the WRKY, MYB, NAC, and ethylene‐responsive families, receptor‐like kinases, cytochrome P450 family members, and mitogen‐activated protein kinase signaling components (Dataset S1). For example, WRKY11, WRKY18, WRKY40, and WRKY60 have been documented as modulating resistance to pathogens (Journot‐Catalino et al. 2006; Xu et al. 2006; Pandey et al. 2010). ACCELERATED CELL DEATH 6, a transmembrane protein with cytosolic ankyrin repeats, is involved in regulating both growth and defense traits (Todesco et al. 2010). On the other hand, the downregulated genes are largely involved in regulating cellular, developmental, and biosynthetic processes, consistent with the dwarf phenotype of fhy3 far1. We then analyzed how many of the genes involved in the response to pathogen infection were among the differentially regulated genes (Bartsch et al. 2006). We found that 813 out of 1,757 (46.3%) pathogen‐induced genes were represented in the upregulated group, while 731 of 2492 (29.3%) pathogen‐repressed genes were downregulated in fhy3 far1 (Figure 2B). Of the 813 genes, 701 (86.2%) are induced by Pseudomonas syringae pv tomato (P.s.t.) DC3000 AvrRps4 infection in an EDS1‐dependent manner (Bartsch et al. 2006). Among the upregulated genes, 145 are believed to respond to SA (total 217 genes) (Blanco et al. 2009).
Figure 2.

Expression analysis of genes regulated by FHY3 and FAR1. (A) Enrichment of selected categories of gene ontology (GO) biological processes in genes up‐regulated in fhy3 far1 compared to the wild‐type genome. The P‐value of enrichment is calculated as the hypergeometric probability of obtaining so many probes/probesets/genes for a GO term, under the null hypothesis that the probes/probesets/genes were randomly selected from the microarray/genome. (B) Venn diagrams showing the overlap of differentially regulated genes in fhy3 far1 with previously reported pathogen‐regulated genes (Bartsch et al. 2006). (C) Expression of PRs and PDF1.2 in the No‐0 wild type (WT), fhy3‐4, far1‐2, and fhy3 far1 as determined by quantitative RT PCR (qRT‐PCR). Plants were grown for 4 weeks under LD conditions. Relative expression was normalized to the level of UBQ1. Bars indicate the standard deviation (SD) of three biological replicates.
Interestingly, a total of 64 R genes, including 47 TIR‐NB‐LRR and 17 CC‐NB‐LRR (Meyers et al. 2003), were found to be induced in fhy3 far1 (Table 1). Four of these, i.e., PRS6, SNC1, RPP5, and At5G45000, were randomly selected and confirmed to be induced in fhy3 far by quantitative reverse transcription‐polymerase chain reaction (qRT‐PCR). As shown in Figure S1, the expression of these R genes was greatly increased in the fhy3 far1 double mutant compared with the wild type, but increased to a lesser extent in the parent single mutants. Similarly, the transcript levels of PR genes, including PR1, PR4, and PR5, were greatly upregulated in fhy3 far1, but not in the fhy3 and far1 single mutants (Figure 2C). However, the level of PDF1.2, a molecular marker of the jasmonic acid‐mediated defense pathway, was not affected by these mutations (Figure 2C). Together, these results indicate that FHY3 and FAR1 are involved in the defense response, likely through regulating the NB‐LRR‐mediated SA signaling pathway.
Table 1.
List of R genes upregulated in the fhy3 far1 mutant
| Probe code | Gene name | Fold change | P‐value |
|---|---|---|---|
| TIR‐NB‐LRR genes | |||
| A_84_P185874 | RMG1 | 47.823 | 9.48E‐05 |
| A_84_P19706 | AT5G45000 | 32.31325 | 0.027859 |
| A_84_P229729 | AT2G20142 | 24.19823 | 2.58E‐04 |
| A_84_P11332 | AT1G17615 | 18.351322 | 6.55E‐03 |
| A_84_P13393 | AT1G66090 | 16.29933 | 9.07E‐04 |
| A_84_P15928 | AT5G46520 | 12.0586 | 0.001391 |
| A_84_P11078 | AT4G16920 | 11.30811 | 1.89E‐04 |
| A_84_P849144 | AT5G41750 | 9.761409 | 3.72E‐05 |
| A_84_P10768 | AT3G04220 | 8.293957 | 1.65E‐04 |
| A_84_P19688 | AT5G40060 | 6.82695 | 2.23E‐03 |
| A_84_P14031 | AT5G44920 | 6.689585 | 5.57E‐04 |
| A_84_P18998 | AT1G72900 | 6.625833 | 4.78E‐04 |
| A_84_P20045 | AT1G57630 | 6.105525 | 0.043992 |
| A_84_P13792 | AT4G09430 | 6.090731 | 0.007396 |
| A_84_P844198 | RPP5 | 5.780693 | 1.89E‐04 |
| A_84_P157715 | TIR | 5.220458 | 0.023633 |
| A_84_P850884 | RPP1 | 4.930057 | 1.27E‐04 |
| A_84_P257040 | RPP4 | 4.846021 | 4.87E‐04 |
| A_84_P799368 | AT3G44400 | 4.798215 | 2.29E‐04 |
| A_84_P20437 | AT4G19530 | 4.333743 | 0.001867 |
| A_84_P18191 | AT2G16870 | 3.607882 | 0.0053 |
| A_84_P13978 | AT5G22690 | 3.481065 | 4.59E‐05 |
| A_84_P22532 | AT5G41740 | 3.411526 | 6.07E‐04 |
| A_84_P754645 | AT1G31540 | 3.34389 | 0.003635 |
| A_84_P12023 | AT4G16930 | 3.212421 | 4.56E‐04 |
| A_84_P10132 | AT4G16900 | 3.197131 | 0.013832 |
| A_84_P859782 | AT1G72890 | 3.183353 | 0.002871 |
| A_84_P11714 | AT3G04210 | 3.175821 | 0.013123 |
| A_84_P851315 | AT1G63750 | 3.15323 | 0.005253 |
| A_84_P23431 | AT5G18370 | 3.043914 | 0.001417 |
| A_84_P23371 | SNC1 | 2.972829 | 5.55E‐04 |
| A_84_P833327 | AT1G69550 | 2.911294 | 0.005158 |
| A_84_P844467 | AT3G44670 | 2.895682 | 1.66E‐04 |
| A_84_P831991 | AT2G14080 | 2.809864 | 0.001404 |
| A_84_P22782 | AT1G72950 | 2.77039 | 0.002835 |
| A_84_P840641 | AT1G17600 | 2.701304 | 0.011694 |
| A_84_P13092 | AT5G46450 | 2.482496 | 1.24E‐04 |
| A_84_P825937 | AT4G16960 | 2.4293 | 0.001445 |
| A_84_P14037 | RPS6 | 2.413073 | 0.010444 |
| A_84_P11793 | AT3G44630 | 2.401762 | 1.28E‐05 |
| A_84_P18910 | AT1G27180 | 2.372493 | 9.91E‐04 |
| A_84_P22659 | AT1G56540 | 2.27858 | 7.37E‐04 |
| A_84_P819483 | AT1G72920 | 2.276629 | 0.003455 |
| A_84_P17819 | AT5G46270 | 2.1798034 | 3.10E‐05 |
| A_84_P18775 | AT5G48780 | 2.140335 | 0.002571 |
| A_84_P16726 | AT4G36140 | 2.067147 | 3.89E‐04 |
| A_84_P134545 | CHS1 | 2.0247023 | 1.64E‐02 |
| CC‐NB‐LRR genes | |||
| A_84_P15324 | ADR1 | 26.407757 | 2.42E‐04 |
| A_84_P762972 | AT4G14610 | 12.564014 | 8.57E‐04 |
| A_84_P750611 | AT1G50180 | 8.214066 | 2.80E‐04 |
| A_84_P233429 | AT1G58390 | 7.246682 | 2.86E‐05 |
| A_84_P19551 | ADR1‐L1 | 6.4361086 | 2.04E‐03 |
| A_84_P22827 | RFL1 | 5.951576 | 2.11E‐03 |
| A_84_P839521 | CW9 | 5.437317 | 1.76E‐03 |
| A_84_P22445 | ADR1‐L2 | 3.9967146 | 2.65E‐03 |
| A_84_P17213 | AT1G58410 | 3.792377 | 3.48E‐02 |
| A_84_P17424 | AT3G14470 | 3.2127194 | 8.76E‐05 |
| A_84_P23167 | ZAR1 | 2.755153 | 1.30E‐02 |
| A_84_P15917 | AT5G43730 | 2.742159 | 0.030905 |
| A_84_P21612 | AT5G48620 | 2.4769285 | 0.0072576 |
| A_84_P19791 | AT5G66910 | 2.432915 | 0.012265 |
| A_84_P832596 | AT5G66900 | 2.207749 | 0.002275 |
| A_84_P18728 | AT5G35450 | 2.1631396 | 6.41E‐04 |
| A_84_P173341 | AT1G12290 | 2.113111 | 0.001391 |
FHY3 and FAR1 negatively regulate SA accumulation and disease resistance
We next examined how the SA synthesis and signaling pathway were affected by FHY3 and FAR1. Our qRT‐PCR analysis of genes involved in the SA pathway showed that the expression levels of EDS1, PAD4, SID2, and EDS5 were increased by more than fivefold in the fhy3 far1 mutant, while the transcripts of NPR1 and NDR1 were moderately upregulated. The expression of these genes was also slightly increased in the far1 single mutant (Figure 3A).
Figure 3.

FHY3 and FAR1 together negatively regulate salicylic acid (SA) signaling and its biosynthesis (A) Expression analysis of genes involved in the SA biosynthesis and signaling pathway in the No‐0 wild type (WT), fhy3‐4, far1‐2 and fhy3 far1 mutants. Plants were grown for 4 weeks under long day (LD) conditions. Lane 1, No‐0 wild type; lane 2, fhy3‐4; lane 3, far1‐2; and lane 4, fhy3 far1. Relative expression was normalized to the level of UBQ1. Bars indicate the standard deviation (SD) of three biological replicates. (B) and (C) Free SA (B) and total SA (C) levels in the indicated genotypes grown under LD conditions for 4 weeks, as determined by high‐performance liquid chromatography. Bars indicate the SD of three replicates.
We then evaluated whether SA synthesis was altered in these mutant plants. Total SA and free SA were analyzed by high‐performance liquid chromatography. As shown in Figure 3B and C, the fhy3 far1 plants accumulated significantly higher levels of free SA (∼10 fold) and total SA (free SA plus glucose‐conjugated SA, ∼20 fold) than the fhy3 and far1 single mutant and the wild‐type plants, suggesting that FHY3 and FAR1 together repress SA production.
Since SA is one of the most important signaling molecules in plant defense, we tested the mutant and wild‐type leaves for resistance to a model pathogen, P.s.t. DC3000. Three days after infiltration or spraying, bacterial growth of P.s.t. DC3000 on fhy3 far1 plants was much less than on wild‐type or fhy3 and far1 plants (Figures S2, 4). Furthermore, growth of P.s.t. DC3000 expressing the effector AvrRps4 (recognized by the TIR‐NB‐LRR R protein RPS4), and to a lesser extent of P.s.t. DC3000 expressing AvrRpt2 (recognized by the CC‐NB‐LRR R protein resistant to P.s. protein2) was significantly inhibited in the fhy3 far1 leaves (Figure 4). These results suggest that the defense responses are constitutively activated in fhy3 far1 and that FHY3 and FAR1 regulate basal defense and resistance.
Figure 4.

Loss of FHY3 and FAR1 causes increased resistance to Pseudomonas syringae bacteria (A–C) Growth of P.s.t. DC3000 (A), P.s.t. DC3000 AvrRps4 (B), and P.s.t. DC3000 AvrRpt2 (C) on wild type (WT), fhy3‐4, far1‐2 and fhy3 far1 leaves. Leaves of 4‐week‐old long day (LD)‐grown plants were infiltrated with bacterial suspensions at a density of 1 × 10⁵ cfu/mL. Bacterial titers were measured on day 0 and day 3. Bars indicate the standard deviation (SD) of four parallel samples. Asterisks denote statistically significant differences in bacterial growth compared with WT (P < 0.01, Student's t‐test). Similar results were obtained in two independent experiments.
Mutations in PAD4, EDS1 and SID2 largely alleviate the fhy3 far1 defects
To test whether the constitutive defense response in fhy3 far1 is dependent on the SA biosynthesis or signaling pathway, we introduced either the pad4, eds1, or sid2 mutation into fhy3 far1 by genetic crossing. Homozygous plants were used in the following studies. The addition of the pad4, eds1 or sid2 mutation largely suppressed the dwarfism phenotype of fhy3 far1 (Figure 5A). Furthermore, the transcript levels of PR1 of the pad4 fhy3 far1, eds1 fhy3 far1, and sid2 fhy3 far1 triple mutants were almost completely restored to the level of the wild‐type plants (Figure 5B). Moreover, we observed that the sensitivities of these triple mutants to P.s.t. DC3000 or P.s.t. DC3000 AvrRps4 infection were similar to those of the pad4, eds1 or sid2 single mutants (Figure 5C). The SA levels in pad4 fhy3 far1 and sid2 fhy3 far1 were also restored to the levels of wild‐type plants (Figure 5D). These results indicate that the constitutive defense response of fhy3 far1 requires functional PAD4, EDS1 or SID2, and thus PAD4, EDS1 and SID2 act downstream of FHY3 and FAR1.
Figure 5.

Suppression of the fhy3 far1 mutant phenotype by pad4, eds1, and sid2 mutations (A) Morphological phenotypes of the wild‐type and various mutant plants. Bars: 1 cm. (B) Growth of bacteria after infection. Leaves were infiltrated with bacterial suspensions at a density of 1 × 10⁵ cfu/mL for P.s.t. DC3000 and P.s.t. DC3000 AvrRps4. Bacterial titers were measured on day 3. Bars indicate the standard deviation (SD) of four parallel samples. Asterisks denote statistically significant differences in bacterial growth compared with fhy3 far1 double mutant (P < 0.01, Student's t‐test). Similar results were obtained in three independent experiments. (C) PR5 expression. Relative PR5 expression was normalized to the level of UBQ1. Bars indicate SD of three biological replicates. (D) Free salicylic acid (SA) levels. Bars indicate the SD of three replicates. For A to D, plants were grown under long day (LD) conditions for 4 weeks.
In addition, we introduced the nahG transgene, which encodes the bacterial salicylate hydroxylase that blocks SA accumulation and SAR (Gaffney et al. 1993), into fhy3 far1. The small‐size morphology of fhy3 far1 was partially suppressed by nahG in the nahG fhy3 far1 plants (Figure 5A), further supporting an essential role of over accumulated SA in triggering the constitutive defense response in fhy3 far1 double mutants.
Overexpression of HEMB1 largely rescues the fhy3 far1phenotype
We previously generated plants overexpressing HEMB1 in the fhy3 far1 mutant background, and found that the leaves of most lines became pale and died at the adult stage (Tang et al. 2012). We screened a large population of the transgenic plants and obtained four independent lines (line OE‐2 and OE‐33 are shown in this study). The heterozygous transgenic plants had 9–17 fold increases in HEMB1 levels compared to the wild type. Remarkably, the dwarfism phenotype of fhy3 far1 was largely suppressed in these heterozygous transgenic lines (Figures 6A, S3A). Surprisingly, one‐fourth progenies of these heterozygotes had pale leaves and died later. These plants had low levels of HEMB1 mRNA, due to co‐suppression by exogenous HEMB1 (Figure S3A). In the heterozygous plants, the ALAD activity was recovered to beyond wild‐type levels (Figure S3B). Moreover, overexpression of HEMB1 also largely complemented the aberrant phenotype of fhy3 far1, including the cell death response, ROS accumulation, increased expression of EDS1, PAD4, SID2, and PR5, increased SA production, and increased pathogen resistance to P.s.t. DC3000 and P.s.t. DC3000 AvrRps4 (Figure 6B–F). These data together confirm that FHY3 and FAR1 control the autoimmune response largely in a HEMB1‐dependent manner, consistent with the direct target of these factors.
Figure 6.

Constitutive expression of HEMB1 largely rescues the fhy3 far1 phenotype (A) Morphology of the wild type (WT), fhy3 far1, and two transgenic lines overexpressing HEMB1 in the fhy3 far1 mutant background (lines OE‐2 and OE‐33 are shown). Plants were grown in soil under long day (LD) conditions for 4 weeks and under short day (SD) conditions for 5 weeks. Bars, 1 cm. (B) and (C) Trypan blue (B) and 3,3′‐diaminobenzidine (DAB) (C) staining of leaves of the indicated genotypes. Plants were grown under LD conditions for 4 weeks. Bars, 2 mm. (D) Gene expression, as determined by quantitative reverse transcription polymerase chain reaction (qRT‐PCR). Relative expression was normalized to the level of UBQ1. Bars indicate the standard deviation (SD) of three biological replicates. (E) Free and total SA levels in the indicated genotypes. Bars indicate the SD of three replicates. (F) Growth of P.s.t. DC3000 and P.s.t. DC3000 AvrRps4 on the indicated genotypes. Leaves of 4‐week‐old plants were infiltrated with bacterial suspensions at a density of 1 × 10⁵ cfu/mL. Bacterial titers were measured on day 0 and day 3. Bars indicate the SD of four parallel samples. Asterisks denote statistically significant differences in bacterial growth compared with fhy3 far1 double mutant (P < 0.01, Student's t‐test). Similar results were obtained in three independent experiments.
Reduction of HEMB1 leads to constitutive activation of the immune response
The above results led us to examine whether HEMB1 itself is involved in the defense response. To this end, we screened more than 200 independent transgenic lines expressing an artificial microRNA of HEMB1 (amiRNA‐HEMB1) in the No‐0 wild‐type background. It should be noted that most of the homozygous seedlings were seedling lethal due to severe inhibition of HEMB1 expression and tetrapyrrole biosynthesis, as previously reported (Tang et al. 2012). We obtained three independent lines that developed true leaves and set seeds. The endogenous HEMB1 levels of amiRNA‐HEMB1 (lines amiR‐1 and amiR‐2 are shown) were reduced to 40%–50% of those in the wild type (Figure S4A). Furthermore, the ALAD activity was drastically impaired in these transgenic lines (Figure S4B).
Similar to the fhy3 far1 mutant, these amiRNA‐HEMB1 plants were small with a lesion‐mimic phenotype (Figure 7A). Trypan blue and DAB staining analyses showed that the amiRNA‐HEMB1 leaves exhibited severe cell death and accumulated high amounts of ROS, respectively (Figure 7B, C). The expression of EDS1, PAD4, SID2, and PR1, but not of NDR1, was dramatically upregulated in both transgenic lines compared with the wild‐type control (Figure 7D). Furthermore, these transgenic plants accumulated free SA levels that were approximately 8–11‐fold higher than those in the wild type (Figure 7E). When the plants were infiltrated with P.s.t. DC3000, bacterial growth on amiR‐1 and amiR‐2 was much less than on the No‐0 wild type (Figure 7F). Taken together, these data indicate that a reduction of HEMB1 leads to a constitutive immune response as do the FHY3 and FAR1 mutations.
Figure 7.
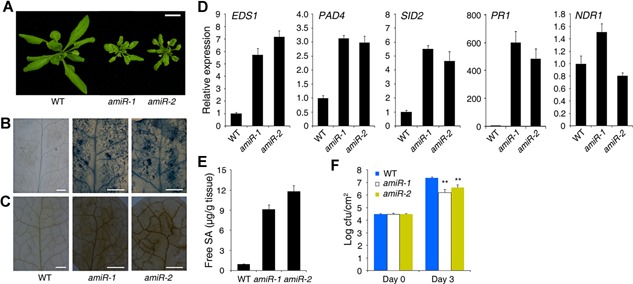
Reduction of HEMB1 mimics the fhy3 far1 mutant phenotypes (A) Morphological phenotype of the No‐0 wild type (WT) and two transgenic lines expressing an artificial microRNA of HEMB1 (lines amiR‐1 and amiR‐2). Bar, 1 cm. (B) and (C) Trypan blue (B) and 3,3́‐diaminobenzidine (DAB) (C) staining of leaves in the indicated genotypes. Bars, 2 mm. (D) Gene expression analysis by quantitative reverse transcription polymerase chain reaction (qRT‐PCR). Relative expression was normalized to the level of UBQ1. Bars indicate the standard deviation (SD) of three biological replicates. (E) Free SA level in the indicated genotypes. Bars indicate the SD of three replicates. (F) Growth of on the leaves of wild‐type and amiRNA‐HEMB1 plants. Leaves were infiltrated with suspensions of P.s.t. DC3000 at a density of 1 × 10⁵ cfu/mL. Bacterial titers were measured on day 0 and day 3. Bars indicate the SD of three parallel samples. Asterisks denote statistically significant differences in bacterial growth compared with WT (P < 0.01, Student's t‐test). Similar results were obtained in two independent experiments. All plants were grown in soil under LD conditions for 4 weeks before examination.
DISCUSSION
FHY3 and FAR1 negatively modulate plant immunity by regulating HEMB1 expression and SA signaling
In this study, we showed that loss of both FHY3 and FAR1 resulted in autoimmune responses, including a dwarfism phenotype with premature cell death, accumulation of ROS and SA, and resistance to P. syringae infection. These responses of fhy3 far1 are similar to those observed for gain‐of‐function mutants of R genes, such as snc1 and ssi4 (Shirano et al. 2002; Zhang et al. 2003). Microarray analysis revealed that FHY3 and FAR1 negatively regulate large numbers of stress‐ and defense‐responsive genes, especially those involved in the SA signaling pathway, e.g., EDS1, SID2, PAD4, and NDR1. Consistently, a large portion of the TIR‐NB‐LRR and CC‐NB‐LRR type R genes were induced by FHY3 and FAR1 mutations. Most intriguingly, growth of P.s.t. DC3000, P.s.t. DC3000 AvrRps4 and P.s.t. DC3000 AvrRpt2 was significantly inhibited in the fhy3 far1 leaves. Furthermore, our genetic data indicate that PAD4, EDS1 and SID2 act downstream of FHY3 and FAR1. Our collective evidence supports the conclusion that FHY3 and FAR1 are negative regulators of plant immunity.
We previously demonstrated that HEMB1 is a direct target of FHY3 and FAR1 (Tang et al. 2012). This study further reveals that FHY3 and FAR1 function in the plant immune response, most likely through activating HEMB1 expression, as the autoimmune phenotypes of fhy3 far1 are largely complemented by overexpression of HEMB1 (Figure 8). In agreement with this proposition, the amiRNA‐HEMB1 transgenic plants exhibited similar autoimmune phenotypes as fhy3 far1. Other undefined targets or pathways downstream of FHY3/FAR1 could also be involved in the plant immune response (Strawn et al. 2007).
Figure 8.

A model showing the role of FHY3 and FAR1 in regulating plant immunity FHY3 and FAR1 directly promote HEMB1 expression, leading to the repression of R gene expression and SA signaling, and inhibition of plant immunity. On the other hand, HEMB1 is required for chlorophyll biosynthesis and plant growth. Therefore, FHY3 and FAR1 modulate the balance between plant growth and immunity. Arrows show activation and bar‐ended lines denote inhibition.
Although some photoreceptors have been shown to affect defense response (Genoud et al. 2002; Wu and Yang 2010; Kazan and Manners 2011; Xie et al. 2011), the intermediate linkage between them is still missing. FHY3 and FAR1 were derived from an ancient transposase and function as key positive regulators downstream of the phytochrome A signaling pathway, where FHY3 and FAR1 directly binding to the promoters of FHY1 and FHL, whose produces interact with phyA and facilitate its nucleus‐cytosol translocation (Hudson et al. 1999; Wang and Deng 2002; Hiltbrunner et al. 2005; Lin et al. 2007). Together with this study, we propose that FHY3 and FAR1 might act as a cross‐talk point that integrates light and SA signaling. Besides the function in photomorphogenesis and plant immunity, FHY3 and FAR1 play roles in regulating flowering time and the circadian clock (Allen et al. 2006; Li et al. 2011), chloroplast development (Ouyang et al. 2011), chlorophyll biosynthesis (Tang et al. 2012), shoot branching (Stirnberg et al. 2012), and abscisic acid‐mediated responses (Tang et al. 2013). In agreement with this, the expression of FHY3 and/or FAR1 themselves is regulated by multiple environmental and endogenous cues. Hence, FHY3 and FAR1 appear to constitute key transcriptional signaling factors that coordinate the expression of downstream genes to ensure optimal plant growth, development, and immunity, in response to diverse internal and external signals.
Involvement of tetrapyrrole biosynthesis in plant immunity
Chloroplasts have a critical role in the transcriptional regulation of plant immune signaling (Nomura et al. 2012). This study reveals that HEMB1, encoding enzymes in tetrapyrrole (e.g., chlorophyll) biosynthesis, is involved in plant immunity, thus substantiates the link between this biosynthesis pathway and SA‐dependent defense responses. There are several possible explanations for the involvement of tetrapyrrole biosynthesis in the defense response. First, those photosensitizing intermediates of the tetrapyrrole pathway could generate ROS upon light irradiation, subsequently leading to plant cell death and defense responses (Reinbothe et al. 1996; Tanaka and Tanaka 2007). For instance, FLU encodes a negative regulator of chlorophyll biosynthesis. The conditional flu mutant releases singlet oxygen in the chloroplasts and triggers accumulation of free SA and activation of PR genes (Ochsenbein et al. 2006). In this study, the altered biosynthesis of tetrapyrrole compounds in the fhy3 far1 and amiRNA‐HEMB1 plants leads to ROS production in chloroplasts and this might trigger activation of the SA pathway and plant immunity.
Second, intermediates of tetrapyrrole metabolism, such as ALA, Mg‐protoporphyrins, and heme, are considered as potential chloroplast‐derived retrograde signaling molecules that modulate photosynthetic gene expression in the nucleus (Strand et al. 2003; Woodson et al. 2011; Czarnecki et al. 2012). In the fhy3 far1 mutants and amiRNA‐HEMB1 plants, the constitutive over‐accumulation of ALA could activate a retrograde signal to regulate nuclear gene expression. Similarly, in isoprenoid biosynthesis, the plastidial metabolite methylerythritol cyclodiphosphate acts as a signal that elicits the expression of stress‐responsive genes and elevates SA biosynthesis in response to abiotic stresses (Xiao et al. 2012). Third, SA is synthesized in chloroplasts via the chorismate pathway in Arabidopsis (Strawn et al. 2007; Wiermer et al. 2007). Impairment of tetrapyrrole synthesis and chloroplast function and integrity possibly affect SA metabolism. For instance, mutations in genes encoding chloroplast‐localized proteins alter SA synthesis and defense signaling (Kachroo et al. 2001; Nomura et al. 2012). Nevertheless, the underlying mechanism by which tetrapyrrole biosynthesis contributes to the plant immune response requires further investigation.
Tetrapyrrole biosynthesis is crucial for plant growth and development, e.g., chlorophylls for photosynthesis, its intermediates also play important roles in regulating plant immunity. Meanwhile, the chloroplasts are sensitive to biotic and abiotic stresses. Therefore, under changing environmental conditions, the tetrapyrrole biosynthetic pathway could fine‐tune the antagonistic relationship between growth and immunity in plants.
MATERIALS AND METHODS
Plant materials and growth conditions
The fhy3‐4, far1‐2, and fhy3 far1 mutants are of the Arabidopsis thaliana Nossen (No‐0) ecotype (Hudson et al. 1999; Wang and Deng 2002; Lin et al. 2007). The eds1, pad4 and sid2 mutants and nahG transgenic plants are of the Columbia (Col) ecotype. Triple mutants and transgenic plants were generated by genetic crossing. Homozygous lines were confirmed by genotyping and/or sequencing. After sterilization, seeds were sown onto Murashige and Skoog (MS) medium containing 1% sucrose and 0.8% agar, and were incubated at 4°C in darkness for 3 d, followed by irradiation for 9 h with white light to promote uniform germination. The light source in long‐day and short‐day conditions was cool white fluorescent lamps (60 µmol m−2 s−1) and the temperature was maintained at 22°C.
Generation of transgenic plants
Binary vectors of 35S:HEMB1 and pDS1301‐HEMB1‐amiRNA were described previously (Tang et al. 2012). 35S:HEMB1 (to fhy3 far1 mutant), and pDS1301‐HEMB1‐amiRNA (to No‐0 wild type) were transformed via the floral dip method (Clough and Bent 1998). Transgenic plants were selected on MS plates in the presence of 50 mg/L hygromycin.
Trypan blue and DAB staining
Trypan blue and DAB staining were performed according to the method by Chen et al. (2013). After staining, tissues were mounted on slides and photographed on a dissecting microscope (Olympus).
SA determination
Leaf tissues were collected from 4‐week‐old soil‐grown plants, weighed, and frozen in liquid nitrogen. For each sample, 0.1 g of the frozen tissue was used for measurement of free SA and SA β‐glucoside (SAG). Briefly, each tissue sample was ground in liquid nitrogen, extracted with 1 mL of 90% methanol and 44 ng [2H4] (internal standard) and incubated at 4°C for 12 h. After centrifugation at 7600 g for 5 min, the supernatant (free SA) was dried under vacuum. The free SA sample was treated with β‐glucosidase at 37°C to yield the total SA sample. For free SA and total SA determination, 0.4 mL 5% acetic/ethyl acetate and 0.4 mL H2O were added, the samples were centrifuged at 7600 g for 5 min, and the supernatants were dried under vacuum. The residues were resuspended in 30 µL of methanol and 0.1 mL H2O and incubated at –20 °C for 2 h. The samples were then centrifuged at 13500 g for 7 min and the supernatant was dried under vacuum. The dried SA was measured using an Agilent gas chromatographer‐mass spectrometer, with the separation performed in a DB‐5ms column (Agilent) (Müller et al. 2002).
Bacterial growth assay
Arabidopsis plants were grown under LD (16 h light/8 h dark) conditions at 22 °C for 4 weeks. Leaves were infiltrated with suspensions of P. syringae DC3000, P.s.t. DC3000 AvrRps4, or P.s.t. DC3000 AvrRpt2 (Bent et al. 1994) at a density of 1 × 10⁵ cfu/mL. For spray inoculation, leaves were dipped in P.s.t. DC3000 suspension at a density of 2 × 10⁸ cfu/mL containing 0.05% Silwet L‐77 (OSi Specialties), and were kept under high humidity. Five leaf discs (0.5 cm in diameter) were harvested 1 h (day 0) and 3 d (day 3) after inoculation and homogenized in 10 mM MgCl2, and plated in serial dilutions on King's B medium containing 50 µg/mL rifampicin for selecting P.s.t DC3000. Plates were incubated at 28 °C for 2 d, and the colony number was then determined from three biological replicates.
Determination of ALAD activity
The activity of endogenous ALAD was determined as described previously (Tang et al. 2012).
RNA extraction and quantitative RT‐PCR
Plant total RNA was extracted using an RNAprep Pure Plant Kit (Tiangen), and the first strand cDNA was synthesized by Reverse Transcriptase (Invitrogen). Real‐time PCR was performed using the SYBR Premix ExTaq Kit (Takara) and a LightCycler 480 thermal cycler (Roch), following the manufacturer's instructions. Three biological replicates were performed for each sample, and the expression levels were normalized to those of UBQ1. All primers sequences are listed in Table S1 online.
Microarray analysis
The fhy3 far1 mutant and No‐0 wild‐type plants were grown in soil under LD conditions for 4 weeks, and total RNA was isolated using the RNAprep Pure Plant Kit (Tiangen). Hybridization to the Agilent Arabidopsis Oligo Microarray (44k, Agilent Technologies) was performed according to the manufacturer's instructions. Three biological replicates were analyzed. Gene ontology (GO) terms enriched in upregulated and downregulated genes were identified with GOEAST (Zheng and Wang 2008). The P‐value of enrichment was calculated as the hypergeometric probability of obtaining so many probes/probesets/genes for a GO term, under the null hypothesis that the probes/probesets/genes were randomly selected from the microarray/genome.
Supporting information
Additional supporting information may be found in the online version of this article at the publisher's web‐site.
Figure S1. Verification of R gene expression by qRT‐PCR
Figure S2. Bacterial growth of P.s.t. DC3000 after spraying
Figure S3. Characterization of HEMB1 overexpression plants in the fhy3 far1 mutant background
Figure S4. Characterization of HEMB1 artificial microRNA transgenic plants
Table S1. List of primers used in this study
Dataset S1. List of FHY3/FAR1‐regulated genes identified in the microarray analysis Differentially regulated genes in the fhy3 far1 mutant with a q value of <0.05 and a fold change of >2 are listed.
ACKNOWLEDGEMENTS
We are grateful to Dr. Hong‐Gu Kang (Texas State University) for insightful comments. We thank Dr. Jianmin Zhou (Institute of Genetics and Developmental Biology, Chinese Academy of Sciences) for gifting bacterial strain P. syringae DC3000. We also thank Ms. Xue Zhen and Li Wang for technique support. This work was supported by grants from the National Natural Science Foundation of China (31170221, 31325002 and 31300206), and the Ministry of Agriculture of China (2014ZX08009‐003).
Wang W, Tang W, Ma T, Niu D, Jin JB, Wang H, Lin R ( 2015) A pair of light signaling factors FHY3 and FAR1 regulates plant immunity by modulating chlorophyll biosynthesis. J Integr Plant Biol 58: 91–103
Current address: College of Biochemical Engineering, Beijing Union University, Beijing 100023, China.
Available online on May 18, 2015 at www.wileyonlinelibrary.com/journal/jipb
REFERENCES
- Allen T, Koustenis A, Theodorou G, Somers DE, Kay SA, Whitelam GC, Devlin DF ( 2006) Arabidopsis FHY3 specifically gates phytochrome signaling to the circadian clock. Plant Cell 18: 2506–2516 [DOI] [PMC free article] [PubMed] [Google Scholar]
- Bartsch M, Gobbato E, Bednarek P, Debey S, Schultze JL, Bautor J, Parker JE ( 2006) Salicylic acid‐independent ENHANCED DISEASE SUSCEPTIBILITY1 signaling in Arabidopsis immunity and cell death is regulated by the monooxygenase FMO1 and the nudix hydrolase NUDT7 . Plant Cell 18: 1038–1051 [DOI] [PMC free article] [PubMed] [Google Scholar]
- Bent AF, Kunkel BN, Dahlbeck D, Brown KL, Schmidt R, Giraudat J, Leung J, Staskawicz BJ ( 1994) RPS2 of Arabidopsis thaliana: A leucine‐rich repeat class of plant disease resistance genes. Science 265: 1856–1860 [DOI] [PubMed] [Google Scholar]
- Blanco F, Salinas P, Cecchini NM, Jordana X, Van Hummelen PV, Alvarez ME, Holuigue L ( 2009) Early genomic responses to salicylic acid in Arabidopsis . Plant Mol Biol 70: 79–102 [DOI] [PubMed] [Google Scholar]
- Bray EA, Bailey‐Serres J, Weretilnyk E ( 2000) Responses to abiotic stress In: Buchanan BB, Gruissem W, Jones RL, eds. Biochemistry and Molecular Biology of Plants. American Society of Plant Physiologist, Rockville, MD: pp. 1158–1203 [Google Scholar]
- Caplan J, Padmanabhan M, Dinesh‐Kumar SP ( 2008) Plant NB‐LRR immune receptors: From recognition to transcriptional reprogramming. Cell Host Microbe 3: 126–135 [DOI] [PubMed] [Google Scholar]
- Century KS, Shapiro AD, Repetti PP, Dahlbeck D, Holub E ( 1997) NDR1, a pathogen‐induced component required for Arabidopsis disease resistance. Science 278: 1963–1965 [DOI] [PubMed] [Google Scholar]
- Chen D, Xu G, Tang W, Jing Y, Ji Q, Fei Z, Lin R ( 2013) Antagonistic bHLH/bZIP transcription factors form transcriptional modules that integrate light and reactive oxygen species signaling in Arabidopsis . Plant Cell 25: 1657–1673 [DOI] [PMC free article] [PubMed] [Google Scholar]
- Clough SJ, Bent AF ( 1998) Floral dip: A simplified method for Agrobacterium‐mediated transformation of Arabidopsis thaliana . Plant J 16: 735–743 [DOI] [PubMed] [Google Scholar]
- Czarnecki O, Glaber C, Chen JG, Mayer KFX, Grimm B ( 2012) Evidence for a contribution of ALA synthesis to plastid‐to‐nucleus signaling. Front Plant Sci 3: 236 [DOI] [PMC free article] [PubMed] [Google Scholar]
- Eitas TK, Dangl JL ( 2010) NB‐LRR proteins: Pairs, pieces, perception, partners, and pathways. Curr Opin Plant Biol 13: 472–477 [DOI] [PMC free article] [PubMed] [Google Scholar]
- Feys BJ, Moisan LJ, Newman MA, Parker JE ( 2001) Direct interaction between the Arabidopsis disease resistance signaling proteins, EDS1 and PAD4. EMBO J 20: 5400–5411 [DOI] [PMC free article] [PubMed] [Google Scholar]
- Fu ZQ, Dong X ( 2013) Systemic acquired resistance: Turning local infection into global defense. Annu Rev Plant Biol 64: 839–863 [DOI] [PubMed] [Google Scholar]
- Gaffney T, Friedrich L, Vernooij B, Negrotto D, Nye G, Uknes S, Ward E, Kessmann H, Ryals J ( 1993) Requirement of salicylic acid for the induction of systemic acquired resistance. Science 261: 754–756 [DOI] [PubMed] [Google Scholar]
- Garcia AV, Blanvillain‐Baufume S, Huibers RP, Wiermer M, Li G, Gobbato E, Rietz S, Parker JE ( 2010) Balanced nuclear and cytoplasmic activities of EDS1 are required for a complete plant innate immune response. PLoS Pathog 6: e1000970 [DOI] [PMC free article] [PubMed] [Google Scholar]
- Genoud T, Buchala AJ, Chua NH, Metraux JP ( 2002) Phytochrome signaling modulates the SA‐perceptive pathway in Arabidopsis . Plant J 31: 87–95 [DOI] [PubMed] [Google Scholar]
- Hammond‐Kosack KE, Jones JD ( 1996) Resistance gene‐dependent plant defense responses. Plant Cell 8: 1773–1791 [DOI] [PMC free article] [PubMed] [Google Scholar]
- Heidrich K, Blanvillain‐Baufume S, Parker JE ( 2012) Molecular and spatial constraints on NB‐LRR receptor signaling. Curr Opin Plant Biol 15: 385–391 [DOI] [PubMed] [Google Scholar]
- Hinsch M, Staskawicz B ( 1996) Identification of a new Arabidopsis disease resistance locus, RPS4, and cloning of the corresponding avirulence gene, avrRps4, from Pseudomonas syringae pv. pisi . Mol Plant Microbe Interact 9: 55–61 [DOI] [PubMed] [Google Scholar]
- Hu G, Yalpani N, Briggs SP, Johal GS ( 1998) A porphyrin pathway impairment is responsible for the phenotype of a dominant disease lesion mimic mutant in maize. Plant Cell 10: 1095–1105 [DOI] [PMC free article] [PubMed] [Google Scholar]
- Hua J ( 2013) Modulation of plant immunity by light, circadian rhythm, and temperature. Curr Opin Plant Biol 16: 406–413 [DOI] [PubMed] [Google Scholar]
- Hudson M, Ringli C, Boylan MT, Quail PH ( 1999) The FAR1 locus encodes a novel nuclear protein specific to phytochrome A signaling. Genes Dev 13: 2017–2027 [DOI] [PMC free article] [PubMed] [Google Scholar]
- Hudson ME, Lisch DR, Quail PH ( 2003) The FHY3 and FAR1 genes encode transposase‐related proteins involved in regulation of gene expression by the phytochrome A‐signaling pathway. Plant J 34: 453–471 [DOI] [PubMed] [Google Scholar]
- Hiltbrunner A, Viczian A, Bury E, Tscheuschler A, Kircher S, Toth R, Honsberger A, Nagy F, Fankhauser C, Schafer E ( 2005) Nuclear accumulation of the phytochrome A photoreceptor requires FHY1. Curr Biol 15: 2125–2130 [DOI] [PubMed] [Google Scholar]
- Ishikawa A, Okamoto H, Iwasaki Y, Asahi T ( 2001) A deficiency of coproporphyrinogen III oxidase causes lesion formation in Arabidopsis . Plant J 27: 89–99 [DOI] [PubMed] [Google Scholar]
- Jones JDG, Dangl JL ( 2006) The plant immune system. Nature 444: 323–329 [DOI] [PubMed] [Google Scholar]
- Journot‐Catalino N, Somssich IE, Roby D, Kroj T ( 2006) The transcription factors WRKY11 and WRKY17 act as negative regulators of basal resistance in Arabidopsis thaliana . Plant Cell 18: 3289–3302 [DOI] [PMC free article] [PubMed] [Google Scholar]
- Kachroo P, Shanklin J, Shah J, Whittle EJ, Klessig DF ( 2001) A fatty acid desaturase modulates the activation of defense signaling pathways in plants. Proc Natl Acad Sci USA 98: 9448–9453 [DOI] [PMC free article] [PubMed] [Google Scholar]
- Karpinski S, Gabrys H, Mateo A, Karpinska B, Mullineaux PM ( 2003) Light perception in plant disease defense signaling. Curr Opin Plant Biol 6: 390–396 [DOI] [PubMed] [Google Scholar]
- Kazan K, Manners JM ( 2011) The interplay between light and jasmonate signaling during defense and development. J Exp Bot 62: 4087–4100 [DOI] [PubMed] [Google Scholar]
- Li G, Siddiqui H, Teng Y, Lin R, Wan XY, Li J, Lau NS, Ouyang X, Dai M, Wan J, Devlin PF, Deng XW, Wang H ( 2011) Coordinated transcriptional regulation underlying the circadian clock in Arabidopsis . Nat Cell Biol 13: 616–624 [DOI] [PubMed] [Google Scholar]
- Li J, Li G, Gao S, Martinez C, He G, Zhou Z, Huang X, Lee JH, Zhang H, Shen Y, Wang H, Deng XW ( 2010) Arabidopsis transcription factor ELONGATED HYPOCOTYL5 plays a role in the feedback regulation of phytochrome A signaling. Plant Cell 22: 3634–3649 [DOI] [PMC free article] [PubMed] [Google Scholar]
- Lin R, Ding L, Casola C, Ripoll DR, Feschotte C, Wang H ( 2007) Transposase‐derived transcription factors regulate light signaling in Arabidopsis . Science 318: 1302–1305 [DOI] [PMC free article] [PubMed] [Google Scholar]
- Mateo A, Muhlenbock P, Resterucci C, Chang CC, Miszalski Z, Karpinska B, Parker JE, Mullineaux PM, Karpinski S ( 2004) Lesion Simulating Disease 1 is required for acclimation to conditions that promote excess excitation energy. Plant Physiol 136: 2818–2830 [DOI] [PMC free article] [PubMed] [Google Scholar]
- Meyers BC, Kozik A, Griego A, Kuang H, Michelmore RW ( 2003) Genome‐wide analysis of NBS‐LRR‐encoding genes in Arabidopsis . Plant Cell 15: 809–834 [DOI] [PMC free article] [PubMed] [Google Scholar]
- Mochizuki N, Tanaka R, Grimm B, Masuda T, Moulin M, Smith AG, Tanaka A, Terry MJ ( 2010) The cell biology of tetrapyrroles: A life and death struggle. Trends Plant Sci 15: 488–498 [DOI] [PubMed] [Google Scholar]
- Molina A, Volrath S, Guyer D, Maleck K, Ryals J, Ward E ( 1999) Inhibition of protoporphyrinogen oxidase expression in Arabidopsis causes a lesion‐mimic phenotype that induces systemic acquired resistance. Plant J 17: 667–678 [DOI] [PubMed] [Google Scholar]
- Mock HP, Heller W, Molina A, Neubohn B, Sandermann H, Grimm B ( 1990) Expression of uroporphyrinogen decarboxylase or coproporphyrinogen oxidase antisense RNA in tobacco induces pathogen defense responses conferring increased resistance to tobacco mosaic virus. J Biol Chem 274: 4231–4238 [DOI] [PubMed] [Google Scholar]
- Müller A, Düchting P, Weiler E ( 2002) A multiplex GC‐MS/MS technique for the sensitive and quantitative single‐run analysis of acidic phytohormones and related compounds, and its application to Arabidopsis thaliana . Planta 216: 44–56 [DOI] [PubMed] [Google Scholar]
- Nomura H, Komori T, Uemura S, Kanda Y, Shimotani K, Nakai K, Furichi T, Kohsuke Takebayashi K, Sugimoto T, Sano S, Suwastika N, Fukusaki E, Yoshioka H, Nakahira Y, Shiina T ( 2012) Chloroplast‐mediated activation of plant immune signaling in Arabidopsis . Nat Commu 3:926 [DOI] [PubMed] [Google Scholar]
- Ochsenbein C, Przybyla D, Danon A, Landgraf F, Gobel C, Imboden A, Feussner I, Apel K ( 2006) The role of EDS1 (enhanced disease susceptibility) during singlet oxygen‐mediated stress responses of Arabidopsis . Plant J 47: 445–456 [DOI] [PubMed] [Google Scholar]
- Oldroyd GE, Staskawicz BJ ( 1998) Genetically engineered broad‐spectrum disease resistance in tomato. Proc Natl Acad Sci USA 95: 10300–10305 [DOI] [PMC free article] [PubMed] [Google Scholar]
- Ouyang X, Li J, Li G, Li B, Chen B, Shen H, Huang X, Mo X, Wan X, Lin R, Li S, Wang H, Deng XW ( 2011) Genome‐wide binding site analysis of FAR‐RED ELONGATED HYPOCOTYL3 reveals its novel function in Arabidopsis development. Plant Cell 23: 2514–2535 [DOI] [PMC free article] [PubMed] [Google Scholar]
- Pandey SP, Roccaro M, Schon M, Logemann E, Somssich IE ( 2010) Transcriptional reprogramming regulated by WRKY18 and WRKY40 facilitates powdery mildew infection of Arabidopsis . Plant J 64: 912–923 [DOI] [PubMed] [Google Scholar]
- Papenbroack J, Mishra S, Mock HP, Kruse E, Schmidt EK, Petersmann A, Braun HP, Grimm B ( 2001) Impaired expression of the plastidic ferrochelatase by antisense RNA synthesis leads to a necrotic phenotype of transformed tobacco plants. Plant J 28: 41–50 [DOI] [PubMed] [Google Scholar]
- Reinbothe S, Reinbothe C, Apel K, Lebedev N ( 1996) Evolution of chlorophyll biosynthesis — the challenge to survive photooxidation. Cell 86: 703–705 [DOI] [PubMed] [Google Scholar]
- Shah J ( 2003) The salicylic acid loop in plant defense. Curr Opin Plant Biol 6: 365–371 [DOI] [PubMed] [Google Scholar]
- Shirano Y, Kachroo P, Shah J, Klessig DF ( 2002) A gain‐of‐function mutation in an Arabidopsis toll interleukin 1 receptor‐nucleotide binding site‐leucine‐rich‐repeat type R gene triggers defense responses and results in enhanced disease resistance. Plant Cell 14: 3149–3162 [DOI] [PMC free article] [PubMed] [Google Scholar]
- Stirnberg P, Zhan S, Williamson L, Ward S, Leyser O ( 2012) FHY3 promotes shoot branching and stress tolerance in Arabidopsis in an AXR1‐dependent manner. Plant J 71: 907–920 [DOI] [PubMed] [Google Scholar]
- Stokes TL, Kunkel BN, Richards EJ ( 2002) Epigenetic variation in Arabidopsis disease resistance. Genes Dev 16: 171–182 [DOI] [PMC free article] [PubMed] [Google Scholar]
- Strand A, Asami T, Alonso J, Ecker JR, Chory J ( 2003) Chloroplast nucleus communication triggered by accumulation of Mg‐protoporphyrin IX. Nature 421: 79–83 [DOI] [PubMed] [Google Scholar]
- Strawn MA, Marr SK, Inoue K, Inada N, Zubieta C, Wildermuth MC ( 2007) Arabidopsis isochorimate synthase functional in pathogen‐induced salicylate biosynthesis exhibits properties consistent with a role in diverse stress responses. J Biol Chem 282: 5919–5933 [DOI] [PubMed] [Google Scholar]
- Tanaka R, Kobayashi K, Masuda T ( 2011) Tetrapyrrole metabolism in Arabidopsis thaliana . The Arabidopsis Book: e0145. doi:10.1199/tab.0145 [DOI] [PMC free article] [PubMed] [Google Scholar]
- Tanaka R, Tanaka A ( 2007) Tetrapyrrole biosynthesis in higher plants. Annu Rev Plant Biol 58: 321–346 [DOI] [PubMed] [Google Scholar]
- Tang W, Ji Q, Huang Y, Jiang Z, Bao M, Wang H, Lin R ( 2013) FHY3 and FAR1 transcription factors integrate light and abscisic acid signaling in Arabidopsis . Plant Physiol 163: 857–866 [DOI] [PMC free article] [PubMed] [Google Scholar]
- Tang W, Wang W, Chen D, Ji Q, Jing Y, Wang H, Lin R ( 2012) Transposase‐derived proteins FHY3/FAR1 interact with PHYTOCHROME‐INTERACTING FACTOR 1 to regulate chlorophyll biosynthesis by modulating HEMB1 during deetiolation in Arabidopsis . Plant Cell 24: 1984–2000 [DOI] [PMC free article] [PubMed] [Google Scholar]
- Tian D, Traw MB, Chen JQ, Kreitman M, Bergelson J ( 2003) Fitness costs of R gene‐mediated resistance in Arabidopsis thaliana . Nature 423: 74–77 [DOI] [PubMed] [Google Scholar]
- Todesco M, Balasubramanian S, Hu TT, Traw MB, Horton M, Epple P, Kuhns C, Sureshkumar S, Schwartz C, Lanz C, Laitinen RAE, Huang Y, Chory J, Lipka V, Borevitz JO, Dangl JL, Bergelson J, Nordborg M, Weigel D ( 2010) Natural allelic variation underlying a major fitness trade‐off in Arabidopsis thaliana . Nature 465: 632–636 [DOI] [PMC free article] [PubMed] [Google Scholar]
- Vlot AC, Dempsey DA, Klessig DF ( 2009) Salicylic acid, a multifaceted hormone to combat disease. Annu Rev Phytopathol 47: 177–206 [DOI] [PubMed] [Google Scholar]
- Wang H, Deng XW ( 2002) Arabidopsis FHY3 defines a key phytochrome A signaling component directly interacting with its homologous partner FAR1. EMBO J 21: 1339–1349 [DOI] [PMC free article] [PubMed] [Google Scholar]
- Wiermer M, Palma K, Zhang Y, Li X ( 2007) Should I stay or should I go? Nucleocy to plasmic trafficking in plant innate immunity. Cell Microbiol 9: 1880–1890 [DOI] [PubMed] [Google Scholar]
- Wildermuth MC, Dewdney J, Wu G, Ausubel FM ( 2001) Isochorismate synthease is required to synthesize salicylic acid for plant defense. Nature 414: 562–565 [DOI] [PubMed] [Google Scholar]
- Woodson JD, Perez‐Ruiz JM, Chory J ( 2011) Heme synthesis by plastid ferrochelatase I regulates nuclear gene expression in plants. Curr Biol 21: 897–903 [DOI] [PMC free article] [PubMed] [Google Scholar]
- Wu L, Yang HQ ( 2010) Cryptochrome 1 is implicated in promoting R protein‐mediated plant resistance to Pseudomonas syringae in Arabidopsis . Mol Plant 3: 539–548 [DOI] [PubMed] [Google Scholar]
- Xiao Y, Savchenko T, Baidoo EEK, Chenhab WE, Hayden DM, Tolstikov V, Corwin JA, Kliebenstein DJ, Keasling JD, Dehesh K ( 2012) Retrograde signaling by the plastidial metabolite MEcPP regulates expression of nuclear stress‐response genes. Cell 149: 1525–1535 [DOI] [PubMed] [Google Scholar]
- Xie XZ, Xue YJ, Zhou B, Chang H, Takano M ( 2011) Phytochromes regulate SA and JA signaling pathways in rice and are required for developmentally controlled resistance to Magnaporthe grisea . Mol Plant 4: 688–696 [DOI] [PubMed] [Google Scholar]
- Xu X, Chen C, Fan B, Chen Z ( 2006) Physical and functional interactions between pathogen‐induced Arabidopsis WRKY18, WRKY40, and WRKY60 transcription factors. Plant Cell 18: 1310–1326 [DOI] [PMC free article] [PubMed] [Google Scholar]
- Zhang Y, Goritschnig S, Dong X, Li X ( 2003) A gain‐of‐function mutation in a plant disease resistance gene leads to constitutive activation of downstream signal transduction pathways in suppressor of npr1‐1, constitutive 1 . Plant Cell 15: 2636–2646 [DOI] [PMC free article] [PubMed] [Google Scholar]
- Zheng Q, Wang XJ ( 2008) GOEAST: A web‐based software toolkit for gene ontology enrichment analysis. Nucleic Acids Res 36:W358–W363 [DOI] [PMC free article] [PubMed] [Google Scholar]
- Zhu Z, Xu F, Zhang Y, Cheng YT, Wiermer M, Li X, Zhang Y ( 2010) Arabidopsis resistance protein SNC1 activates immune responses through association with a transcriptional corepressor. Proc Natl Acad Sci USA 107: 13960–13965 [DOI] [PMC free article] [PubMed] [Google Scholar]
Associated Data
This section collects any data citations, data availability statements, or supplementary materials included in this article.
Supplementary Materials
Additional supporting information may be found in the online version of this article at the publisher's web‐site.
Figure S1. Verification of R gene expression by qRT‐PCR
Figure S2. Bacterial growth of P.s.t. DC3000 after spraying
Figure S3. Characterization of HEMB1 overexpression plants in the fhy3 far1 mutant background
Figure S4. Characterization of HEMB1 artificial microRNA transgenic plants
Table S1. List of primers used in this study
Dataset S1. List of FHY3/FAR1‐regulated genes identified in the microarray analysis Differentially regulated genes in the fhy3 far1 mutant with a q value of <0.05 and a fold change of >2 are listed.