

Abstract
Objective:
Noncystic fibrosis (non-CF) bronchiectasis remains as a common health problem in Asia. Pathogens’ distribution in airways of patients with non-CF bronchiectasis is important for doctors to make right decision.
Data Sources:
We performed this systematic review on the English language literatures from 1966 to July 2014, using various search terms included “pathogens” or “bacteria” or “microbiology” and “bronchiectasis” or “non-cystic fibrosis bronchiectasis” or “non-CF bronchiectasis” or “NCFB.”
Study Selection:
We included studies of patients with the confirmed non-CF bronchiectasis for which culture methods were required to sputum or bronchoalveolar lavage fluid (BALF). Weighted mean isolation rates for Haemophilus influenzae, Pseudomonas aeruginosa, Streptococcus pneumoniae, Stapylococcus aureus, Moxarella catarrhails were compared according to different methodology.
Results:
The total mean bacterial culture positive rates were 63%. For studies using sputum samples, the mean positive culture rates were 74%. For studies using BALF alone or BALF and sputum, it was 48%. The distributions of main bacterial strains were 29% for H. influenzae, 28% for P. aeruginosa, 11% for S. pneumoniae, 12% for S. aureus, and 8% for M. catarrhails with methodology of sputum. Meanwhile, the bacterial distributions were 37% for H. influenzae, 8% for P. aeruginosa, 14% for S. pneumoniae, 5% for S. aureus, and 10% for M. catarrhails with methodology of BALF alone or BALF and sputum. Analysis of the effect of different methodology on the isolation rates revealed some statistically significant differences.
Conclusions:
H. influenzae accounted for the highest percentage in different methodology. Our results suggested that the total positive culture rates and the proportion of P. aeruginosa from sputum and BALF specimens had significant differences, which can be used in further appropriate recommendations for the treatment of non-CF bronchiectasis.
Keywords: Bronchiectasis, Bronchoalveolar Lavage Fluid, Pathogens, Sputum
INTRODUCTION
Bronchiectasis is a heterogeneous and progressive respiratory disease. It is characterized by recurrent cough, sputum production, and recurrent respiratory infections. These patients had chronic colonization or infection of pathogens, the underlying pathological process can be understood as a vicious circle caused by chronic infection.[1,2] The two main pathogens isolated have been reported as Haemophilus influenzae (mean of 42% and a range of 29–70%) and Pseudomonas aeruginosa (mean of 18% and range of 12-33%).[3] Most studies used sputum culture, mainly as a simple noninvasive and inexpensive procedure, although it may combine with oropharyngeal flora which comes from upper airways. On the contrary, bronchoalveolar lavage fluid (BALF) can avoid oropharyngeal flora and provide bacterial samples of lower airways. Therefore, BALF specimens are the golden standard for evaluating lower airway microorganisms and inflammation in adults as well as in young children who are unable to expectorate sputum.[4] Studies using BALF techniques have shown that H. influenzae and P. aeruginosa may be isolated from 60% to 90% of these patients.[5]
Some studies show that 40–67% of children with bronchiectasis have respiratory bacteria pathogens in their sputum with H. influenzae and Streptococcus pneumoniae as the most commonly bacteria.[6,7] Stockley et al. achieved sputum of 12 adult bronchiectasis patients found that the most common infecting organisms isolated are H. influenzae and S. pneumoniae.[8] P. aeruginosa, particulaly, tends to be of more amount than H. influenzae. A study by Ho indicated that P. aeruginosa rank the first followed by H. influenza.[9]
Although there are some studies using varying culture methods under different conditions that have obtained the isolation rates of bacteria from the airway of noncystic fibrosis (non-CF) bronchiectasis, previous studies reported various confusing results on the rates of cultural bacteria. It is generally believed that H. influenzae account for the highest, but there was a trend toward more P. aeruginosa and less H. influenzae. And, there was no study making a systematic evaluation and calculation about the proportion of pathogenic bacteria caused by different culture samples. Therefore, the purpose of this study was to find out the real prevalence of pathogens isolated from patients with non-CF bronchiectasis and whether different culture samples would cause different results through a systematic review of the data provided by those enrolled studies.
METHODS
Selection of studies
A retrospective review of the English language literature was performed for inclusion using the following criteria: (1) With the aim of non-CF bronchiectasis patients, and the diagnosis of bronchiectasis was confirmed radiologically by high-resolution computed tomography; (2) The literatures from the period 1966 to 2014 that were restricted to English language literatures and human studies; (3) Articles contained the isolation rates of pathogens. The search included the following databases: PubMed, EMBASE, Web of Science, Cochrane Libray, and Controlled Trials metaRegister. The search terms included “pathogens” or “bacteria” or “microbiology” and “bronchiectasis” or “non-cystic fibrosis bronchiectasis” or “non-CF bronchiectasis” or “NCFB.”
All studies with abstracts that either met the inclusion criteria or did not provide sufficient information were then reviewed for exclusion. Studies were excluded if: (1) Articles were not in the English language; (2) They involved CF bronchiectasis patients; (3) Using either other culture technique such as nasopharyngeal and deep nasal swab; (4) Data could not be extracted by the statistical methods. Also, the references of each article were reviewed for inclusion or exclusion.
Data extraction
Basic graphic information was obtained from each studies. Items included culture technique (either sputum or BALF alone or BALF and sputum), median age, sex percentages, the number of patients who had culture performed, the number of patients who had positive culture rates, the isolation rates of the interested pathogens (H. influenzae, P. aeruginosa, S. pneumoniae, Stapylococcus aureus, Moxarella catarrhails), studies locations, studies years, status, and forced expiratory volume in 1 s (FEV1).
Statistical analysis
Studies analyses were conducted by STATA version 12.0 (STATA, College Station, Texas, USA). Culture rates of each specific pathogen were computed per article, such data were pooled and mean isolation rates were weighted according to the different samples. The nonparametric test was performed to determine the statistical differences of specific pathogens isolation rates and positive culture rates between the different samples.
RESULTS
The initial search had gained 2848 abstracts or articles. In all, 949 duplicates were removed, 1899 abstracts or articles were screened for eligibility. These articles were evaluated, and after a more full and deeply evaluation, 1856 articles were excluded [Figure 1]. At last, 30 articles were enrolled for final analysis [Table 1]. Among the 30 final articles, 19 articles reported the use of sputum for culture, 8 articles reported BALF results alone, and 4 studies reported BALF and sputum results. Among a total number of 3073 patients, 2358 patients had positive culture results (9 articles did not list the number of positive culture results). The weighted mean positive culture rates of 2358 non-CF bronchiectasis patients was 65% (95% confidence interval [CI]: 55–75%). For sputum samples, mean positive culture rates of 1905 patients was 75% (95% CI: 66–84%). Five hundred and twelve patients using BALF alone or BALF and sputum for culture was 48% (95% CI: 33–63%). Data comparing between the different method of positive culture rates results are shown in Table 2.
Figure 1.
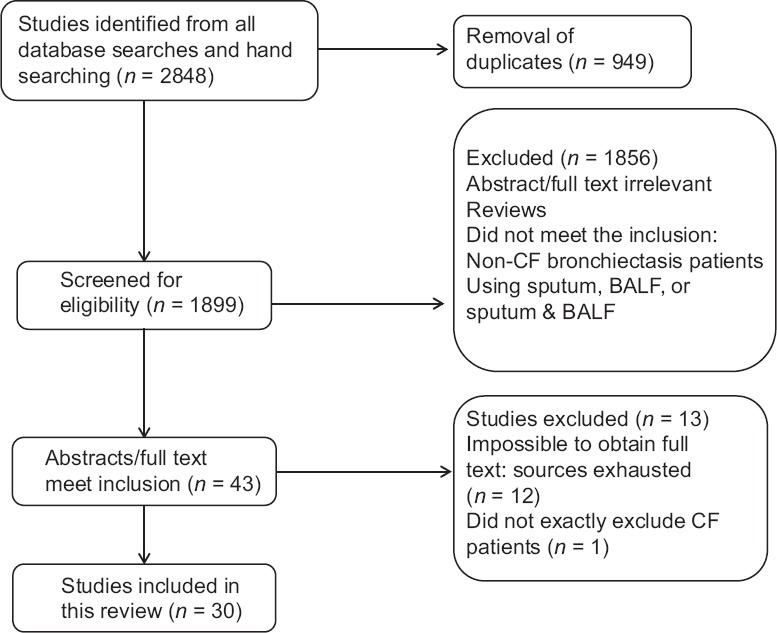
Flow diagram of the process of selection of included studies. Flow chart depicts the selection process at each stage.
Table 1.
Characteristics of and isolation rates in 30 studies of noncystic fibrosis
| Article (year) | Collect method | Location | Age, mean (years) | Male gender (%) | Total number of patients | Number of positive culture results | Isolation rates (%) | Study years | Status | FEV1 (%) (mean) (n) | |||||
|---|---|---|---|---|---|---|---|---|---|---|---|---|---|---|---|
| Pseudomonas aeruginosa | Haemophilus influenzae | Moraxella catarrhalis | Streptococcus pneumoniae | Staphylococcus aureus | Other pathogens | ||||||||||
| Pang et al. (1989)[10] | BALF | Hong Kong, China | >18 | 21.7 | 21 | 14 | 19 | 28.6 | – | 4.8 | 14.3 | 28.6 | – | – | – |
| Rayner et al. (1994)[11] | Sputum | UK | 51.9 | – | 10 | 9 | 50 | 30 | – | 10 | – | – | – | Stable | 50–60 |
| Ho et al. (1998)[9] | Sputum | Hong Kong, China | 55.1 | 38 | 100 | 65 | 33 | 10 | 2 | 6 | 5 | 9 | – | Stable | 66.59 |
| Tsang et al. (1999)[12] | Sputum | Hong Kong, China | 54.3 | 23.9 | 24 | – | 66.7/76.2 | 12.5/14.3 | – | – | – | 8.3/9.5 | 1996–1997 | Stable | – |
| Pasteur et al. (2000)[13] | Sputum | UK | 52.7 | 37.3 | 146 | 112 | 29 | 35 | 20 | 13 | 14 | 18 | 1996–1997 | – | 74 |
| Angrill et al. (2001)[14] | BALF | Spain | 57 | 36.7 | 49 | 22 | 2 | 22.4 | – | 2 | 2 | 24.5 | 1995–1997 | Stable | 79 |
| Chang et al. (2002)[15] | BALF | Australia | 3.8 | 45.5 | 33 | 11 | – | 72.7 | 3 | 9 | – | 9 | – | Stable | 65 (10) |
| Palwatwichai et al. (2002)[16] | Sputum | Thailand | 58 | – | 50 | 41 | 20 | 14 | 4 | 6 | – | 38 | 1999–2001 | – | 71.9 (30) |
| Angrill et al. (2002)[17] | Sputum/BALF | Spain | 58 | 34 | 42/59 | 22/33 | 9/12 | 26/32 | 5/– | 7/14 | –/3 | 6/12 | 1998–1999 | Stable | 75 |
| Edwards et al. (2003)[7] | Sputum | New Zealand | 10 | 60 | 60 | 40 | 2 | 68 | 6 | 12 | – | 12 | 1998–2000 | – | 69 (39) |
| Davies and Wilson (2004)[18] | Sputum | UK | 51.9 | 33.3 | 35 | 22 | 22.9 | 17.1 | 2.9 | – | 17.1 | 5.7 | 1998–2000 | – | – |
| Eastham et al. (2004)[19] | Sputum and BALF | UK | 1.1 | 66.7 | 93 | – | 6 | 48 | 17 | 22 | 8 | 12 | 1999–2002 | – | – |
| Lai et al. (2004)[20] | Sputum and BALF | Taiwan, China | 11 | 41.4 | 29 | 12 | 25/21.4 | 16.7/14.3 | – | 16.7/14.3 | – | 50/42.9 | 1996–2002 | – | 67.6 (13) |
| Karadag et al. (2005)[6] | Sputum | Turkey | 7.4 | 50.5 | 111 | 65 | 10.8 | 38.5 | 6.2 | 23 | 16.9 | 4.6 | 1991–2001 | – | 65–75.4 |
| Li et al. (2005)[21] | Sputum and BALF | UK | 12.1 | 47.8 | 136 | – | 11/14.4 | 39/51 | 2/3 | 17/22.1 | 4/4.8 | 8/10.6 | 1987–2001 | – | 71 |
| Banjar (2007)[22] | Sputum | Saudi Arabia | – | 49.7 | 151 | – | 16 | 37 | – | 17 | – | – | 1986–2002 | – | – |
| MartínezGarcía et al. (2007)[23] | Sputum | Spain | 69.9 | 48.7 | 76 | – | 19.7 | 18.4 | – | – | – | – | 1993–2005 | Stable | 59.04 |
| Kapur et al. (2009)[24] | Sputum and BALF | Australia | 5.5 | 56.7 | 27 | 13 | 11.1 | 25.9 | 7.4 | 11.1 | 7.4 | – | 2003–2005 | Stable | 82.5 |
| Hare et al. (2010)[25] | BALF | Australia | 2.3 | 66.7 | 45 | 26 | – | 47 | 20 | 18 | 4 | – | 1997–2002 | – | – |
| Macfarlane et al. (2010)[26] | Sputum | UK | 60.6 | 38.5 | 143 | 114 | 43 | 52 | 27 | 34 | 24 | 58 | 2007–2009 | – | – |
| Kapur et al. (2012)[27] | BALF | Australia | 5.25 | 56.6 | 113 | 77 | 6 | 47 | 10 | 22 | 12 | 7 | 1987–2009 | – | – |
| Murray et al. (2011)[28] | Sputum | Scotland | 61 | 42.1 | 57 | 57 | 42.1 | 45.6 | 3.5 | 1.8 | 5.3 | 1.8 | 1992–2009 | Stable | 63.4–72.9 |
| Sahabudeen and Smith (2011)[29] | Sputum | UK | 64.5 | 36.7 | 158 | 135 | 26.6 | 13.9 | 3.8 | 7 | 1.9 | 16.6 | 2007–2009 | – | – |
| Chalmers et al. (2012)[30] | Sputum | UK | 67 | 42.9 | 385 | 290 | 21 | 38.6 | 11.4 | 9.7 | 12.4 | 9.3 | – | Stable | 69.2 |
| Hare et al. (2012)[31] | BALF | Australia | 2.38 | 61.5 | 104 | – | – | 31 | 12 | 16 | – | – | 2007–2011 | – | – |
| Smith et al. (2014)[32] | Sputum | Australia | 60 | 50 | 8 | – | 75/66.7 | 13/11.1 | – | – | – | 25/22.2 | 2007–2009 | – | 33 |
| Wilson et al. (2013)[33] | Sputum | Australia, | 63 | 33.9 | 124 | – | 54/42.9 | 24.2/19.2 | 6.5/5.1 | 7.3/5.8 | 20.2/16 | 13.7/10.9 | 2007–2011 | – | 54.6–57.2 |
| Germany, spain, Sweden, UK, USA | |||||||||||||||
| Rogers et al. (2013)[34] | Sputum | UK | 62.9 | 31.7 | 41 | – | 27 | 29 | – | – | – | – | 2009–2010 | Stable | 72.9 |
| Pizzutto et al. (2013)[35] | BALF | Australia | 2.2 | 57.1 | 136 | 26 | 7.1 | 28.6 | 16.1 | 17.9 | – | – | – | Stable | – |
| Chalmers et al. (2014)[36] | Sputum | UK | – | 40 | 608 | 440 | 11.5 | 29.1 | 10.4 | 6 | 7 | 7.9 | 2011–2012 | Stable | – |
The number of n represent part do the lung function. BALF: Bronchoalveolar lavage fluid; FEV1: Forced expiratory volume in 1 s.
Table 2.
Percentages of patients who had positive culture results
| Variables | Studies | P | ||
|---|---|---|---|---|
| All | Sputum | BALF alone or BALF and sputum | ||
| Rate of positive culture | 0.65 | 0.75 | 0.48 | 0.000 |
| results (95% CI) | (0.55–0.75) | (0.66–0.84) | (0.33–0.63) | |
| Number of studies | 21 | 13 | 9 | |
| Number of patients who | 2358 | 1905 | 512 | |
| had culture performed | ||||
P value with respect to the difference between the rate of positive culture results for studies that used sputum and for studies that used BALF alone or BALF and sputum, calculated by nonparametric test. BALF: Bronchoalveolar lavage fluid; CI: Confidence interval.
Thirty articles were weighted mean values for analyses of the isolation rates of the 5 major pathogens. Nineteen articles reported H. influenzae from sputum samples, the mean isolation rate was 29% (95% CI: 23–36%), 12 articles reported using BALF alone or BALF and sputum method and the mean isolation rate was 37% (95% CI: 29–44%). For P. aeruginosa, 19 articles using sputum method and mean isolation rate was 28% (95 CI: 21–34%), 9 articles using BALF alone or BALF and sputum method and mean isolation rate was 8% (95% CI: 5–11%) [Table 3]. For S. pneumonia, 14 articles reported mean isolation rate as 11% (95% CI: 7–14%) by sputum culture, 12 articles using BALF alone or BALF and sputum method was 14% (95% CI: 9–19%). Ten articles of mean isolation rate cultured from sputum for S. aureus was 12% (95% CI: 7–16%), 8 articles with BALF or BALF and sputum results was 5% (95% CI: 3–6%) [Table 3]. Thirteen articles reported mean isolation rate cultured from sputum for Moxarella catarrhalis was 8% (95% CI: 5–11%), 8 articles with BALF or BALF and sputum results was 10% (95% CI: 5–15%) [Table 3].
Table 3.
Weighted mean isolation rates according to the culture technique used in the studies
| Pathogens | Sputum | BALF alone or BALF and sputum | P |
|---|---|---|---|
| Haemophilus influenzae | n = 19 | n = 12 | |
| Isolation rate (95% CI) | 0.29 (0.23–0.36) | 0.37 (0.29–0.44) | 0.172 |
| Pseudomonas aeruginosa | n = 19 | n = 9 | |
| Isolation rate (95% CI) | 0.28 (0.21–0.34) | 0.08 (0.05–0.11) | 0.004 |
| Streptococcus pneumoniae | n = 14 | n = 12 | |
| Isolation rate (95% CI) | 0.11 (0.07–0.14) | 0.14 (0.09–0.19) | 0.205 |
| Staphylococcus aureus | n = 10 | n = 8 | |
| Isolation rate (95% CI) | 0.12 (0.07–0.16) | 0.05 (0.03–0.06) | 0.093 |
| Moxarella catarrhalis | n = 13 | n = 8 | |
| Isolation rate (95% CI) | 0.08 (0.05–0.11) | 0.10 (0.05–0.15) | 0.473 |
P values comparing the pathogen isolation rate for studies that used sputum with studies that used BALF or BALF and sputum, calculated by nonparametric test. BALF: Bronchoalveolar lavage fluid; n: Numbers of studies; CI: Confidence interval.
Analyses were performed to determine whether isolation rates were affected by the two different methods of culture performed [Table 3]. The isolation rates of five major pathogens except P. aeruginosa had no significant statistical difference. While P. aeruginosa was isolated more frequently in studies using sputum than those using BALF or BALF and sputum for culture (28% vs. 8%; P = 0.004). We also analyzed whether there are some statistical differences between major pathogens rates using two different methods among adults and children. Results of this analysis showed P. aeruginosa has a significant statistical difference among adults and children in sputum samples (33% vs. 6%; P = 0.029), while other four isolation rates of pathogens have no statistical difference.
DISCUSSION
The characteristics of brochiectasis are progressive inflammation and a cycle of worsening pulmonary damage. As a long-term disease which is hard to clear, appropriate further treatments and antibiotics use on bronchiectasis should be based on the exact prevalence percentages of pathogens. However, the microbiology of bronchiectasis varies among in different studies. This meta-analysis summarized and analyzed 30 articles of pathogens of non-CF bronchiectasis. Our results showed that H. influenzae accounted for the highest percentage in two kinds of culture methods. Sputum and BALF specimens suggested that the total positive culture rates and the proportion of P. aeruginosa had significant differences. Total positive culture rates in sputum specimens were higher than those in BALF specimens, which revealed that the results from sputum may combine with oropharyngeal flora from upper airways, as BALF are the golden standard for evaluating lower airway microorganisms and inflammation.[4]
King conducted several studies showing that H. influenzae ranked the first common pathogen (range: 29–70%), P. aeruginosa followed as range of 12–31%.[37] While Shah et al. found that 32% for H. influenzae, 14% for S. pneumoniae, 8% for M. catarrhails, 5% for S. aureus, and 2% for P. aeruginosa. Some studies of sputum microbiology and bronchoscopic sampling revealed that S. aureus occurred in non-CF bronchiectasis patients of 4–10%.[38] Stockley et al. found that the most common infected organisms isolated are H. influenzae and S. pneumoniae. In our study, the mean isolation rates was 29% for H. influenzae, 28% for P. aeruginosa by using sputum, which were in accordance with King's results. We found 11% for S. pneumoniae, 12% for S. aureus, and 8% for M. catarrhalis, which were similar with Shah study except the isolate rates of P. aeruginosa, which focused on children. Our study explored whether there were statistical differences between major pathogens rates by using two different methods among adults and children. Results of this analysis showed that P. aeruginosa had a significant statistical difference among adults and children, while other four isolation rates of pathogens did not. This result can best interpret Shah's study that P. aeruginosa rate was lower in children. Clinically, patients with P. aeruginosa infected in non-CF bronchiectasis would bring about a more rapid decline in lung function and earlier mortality.[2] Hence, more attention should be paid to P. aeruginosa. Recommendations for antibiotic therapy for non-CF bronchiectasis are periodically reviewed and updated by the British Thoracic Society.[1] These recommended uses were combination of antibiotics not required in patients colonized with H. influenzae, M. catarrhalis, S. aureus, and S. pneumoniae. In patients with P. aeruginosa, who are sensitive to ciprofloxacin, monotherapy with oral ciprofloxacin can be used as a first-line treatment.
In this study, we extracted FEV1 data from the included articles. Articles that only part of patients did lung function in a study or did not provide any data on lung function were excluded. Then we divided the patients involved into three groups, <50%, 50–73%, and more than 73%, respectively. There was no obvious difference in the distribution of pathogens, which may be due to the relatively small number of sample, or the different health states of the patients. We revealed that S. aureus is increasing compared to the previous studies. Our study also found the positive culture rates of different methods had the obvious statistical difference (74% vs. 48%, P = 0.000). However, the isolation rates of four pathogens excepted P. aeruginosa (28% vs. 8%) using different methods have no statistical difference.
This study, like any systematic reviews, is limited by pool potential heterogeneous data. The included articles resulted from different countries, patients may have different races or may have different medical resources and conditions or some patients may obtain antibiotics before the study although there is no evidence showing that using antibiotics would change bacteria distribution. As a result, data derived from these studies may not actually show the true prevalence of five major pathogens in non-CF bronchiectasis.
CONCLUSIONS
The data suggest that H. influenzae ranks the first as a major pathogen in non-CF bronchiectasis, followed by P. aeruginosa, S. pneumoniae, S. aureus, and M. catarrhalis. Methods using sputum or BALF have some statistical differences. The treatment of non-CF bronchiectasis patients may be according with the prevalence data from this study.
Financial support and sponsorship
This work was supported by grants from the National Natural Science Foundation of China (Nos. 81170003, 81370109), Science and Technology Commission of Shanghai Municipality (Nos. 134119a6400, 12JC1402300) and Shanghai Municipal Education Commission (No. 13SG21).
Conflicts of interest
There are no conflicts of interest.
Footnotes
Edited by: Li-Shao Guo
REFERENCES
- 1.Pasteur MC, Bilton D, Hill AT. British Thoracic Society Bronchiectasis non-CF Guideline Group. British Thoracic Society guideline for non-CF bronchiectasis. Thorax. 2010;65(Suppl 1):i1–58. doi: 10.1136/thx.2010.136119. [DOI] [PubMed] [Google Scholar]
- 2.Chalmers JD, Hill AT. Mechanisms of immune dysfunction and bacterial persistence in non-cystic fibrosis bronchiectasis. Mol Immunol. 2013;55:27–34. doi: 10.1016/j.molimm.2012.09.011. [DOI] [PubMed] [Google Scholar]
- 3.King PT, Holdsworth SR, Freezer NJ, Villanueva E, Holmes PW. Microbiologic follow-up study in adult bronchiectasis. Respir Med. 2007;101:1633–8. doi: 10.1016/j.rmed.2007.03.009. [DOI] [PubMed] [Google Scholar]
- 4.Nicolai T. Pediatric bronchoscopy. Pediatr Pulmonol. 2001;31:150–64. doi: 10.1002/1099-0496(200102)31:2<150::aid-ppul1024>3.0.co;2-6. [DOI] [PubMed] [Google Scholar]
- 5.Cabello H, Torres A, Celis R, El-Ebiary M, Puig de la Bellacasa J, Xaubet A, et al. Bacterial colonization of distal airways in healthy subjects and chronic lung disease: A bronchoscopic study. Eur Respir J. 1997;10:1137–44. doi: 10.1183/09031936.97.10051137. [DOI] [PubMed] [Google Scholar]
- 6.Karadag B, Karakoc F, Ersu R, Kut A, Bakac S, Dagli E. Non-cystic-fibrosis bronchiectasis in children: A persisting problem in developing countries. Respiration. 2005;72:233–8. doi: 10.1159/000085362. [DOI] [PubMed] [Google Scholar]
- 7.Edwards EA, Asher MI, Byrnes CA. Paediatric bronchiectasis in the twenty-first century: Experience of a tertiary children's hospital in New Zealand. J Paediatr Child Health. 2003;39:111–7. doi: 10.1046/j.1440-1754.2003.00101.x. [DOI] [PubMed] [Google Scholar]
- 8.Stockley RA, Hill SL, Morrison HM. Effect of antibiotic treatment on sputum elastase in bronchiectatic outpatients in a stable clinical state. Thorax. 1984;39:414–9. doi: 10.1136/thx.39.6.414. [DOI] [PMC free article] [PubMed] [Google Scholar]
- 9.Ho PL, Chan KN, Ip MS, Lam WK, Ho CS, Yuen KY, et al. The effect of Pseudomonas aeruginosa infection on clinical parameters in steady-state bronchiectasis. Chest. 1998;114:1594–8. doi: 10.1378/chest.114.6.1594. [DOI] [PubMed] [Google Scholar]
- 10.Pang JA, Cheng A, Chan HS, Poon D, French G. The bacteriology of bronchiectasis in Hong Kong investigated by protected catheter brush and bronchoalveolar lavage. Am Rev Respir Dis. 1989;139:14–7. doi: 10.1164/ajrccm/139.1.14. [DOI] [PubMed] [Google Scholar]
- 11.Rayner CF, Tillotson G, Cole PJ, Wilson R. Efficacy and safety of long-term ciprofloxacin in the management of severe bronchiectasis. J Antimicrob Chemother. 1994;34:149–56. doi: 10.1093/jac/34.1.149. [DOI] [PubMed] [Google Scholar]
- 12.Tsang KW, Ho PI, Chan KN, Ip MS, Lam WK, Ho CS, et al. A pilot study of low-dose erythromycin in bronchiectasis. Eur Respir J. 1999;13:361–4. doi: 10.1183/09031936.99.13236199. [DOI] [PubMed] [Google Scholar]
- 13.Pasteur MC, Helliwell SM, Houghton SJ, Webb SC, Foweraker JE, Coulden RA, et al. An investigation into causative factors in patients with bronchiectasis. Am J Respir Crit Care Med. 2000;162(4 Pt 1):1277–84. doi: 10.1164/ajrccm.162.4.9906120. [DOI] [PubMed] [Google Scholar]
- 14.Angrill J, Agustí C, De Celis R, Filella X, Rañó A, Elena M, et al. Bronchial inflammation and colonization in patients with clinically stable bronchiectasis. Am J Respir Crit Care Med. 2001;164:1628–32. doi: 10.1164/ajrccm.164.9.2105083. [DOI] [PubMed] [Google Scholar]
- 15.Chang AB, Boyce NC, Masters IB, Torzillo PJ, Masel JP. Bronchoscopic findings in children with non-cystic fibrosis chronic suppurative lung disease. Thorax. 2002;57:935–8. doi: 10.1136/thorax.57.11.935. [DOI] [PMC free article] [PubMed] [Google Scholar]
- 16.Palwatwichai A, Chaoprasong C, Vattanathum A, Wongsa A, Jatakanon A. Clinical, laboratory findings and microbiologic characterization of bronchiectasis in Thai patients. Respirology. 2002;7:63–6. doi: 10.1046/j.1440-1843.2002.00367.x. [DOI] [PubMed] [Google Scholar]
- 17.Angrill J, Agustí C, de Celis R, Rañó A, Gonzalez J, Solé T, et al. Bacterial colonisation in patients with bronchiectasis: Microbiological pattern and risk factors. Thorax. 2002;57:15–9. doi: 10.1136/thorax.57.1.15. [DOI] [PMC free article] [PubMed] [Google Scholar]
- 18.Davies G, Wilson R. Prophylactic antibiotic treatment of bronchiectasis with azithromycin. Thorax. 2004;59:540–1. [PMC free article] [PubMed] [Google Scholar]
- 19.Eastham KM, Fall AJ, Mitchell L, Spencer DA. The need to redefine non-cystic fibrosis bronchiectasis in childhood. Thorax. 2004;59:324–7. doi: 10.1136/thx.2003.011577. [DOI] [PMC free article] [PubMed] [Google Scholar]
- 20.Lai SH, Wong KS, Liao SL. Clinical analysis of bronchiectasis in Taiwanese children. Chang Gung Med J. 2004;27:122–8. [PubMed] [Google Scholar]
- 21.Li AM, Sonnappa S, Lex C, Wong E, Zacharasiewicz A, Bush A, et al. Non-CF bronchiectasis: Does knowing the aetiology lead to changes in management? Eur Respir J. 2005;26:8–14. doi: 10.1183/09031936.05.00127704. [DOI] [PubMed] [Google Scholar]
- 22.Banjar HH. Clinical profile of Saudi children with bronchiectasis. Indian J Pediatr. 2007;74:149–52. doi: 10.1007/s12098-007-0008-z. [DOI] [PubMed] [Google Scholar]
- 23.Martínez-García MA, Soler-Cataluña JJ, Perpiñá-Tordera M, Román-Sánchez P, Soriano J. Factors associated with lung function decline in adult patients with stable non-cystic fibrosis bronchiectasis. Chest. 2007;132:1565–72. doi: 10.1378/chest.07-0490. [DOI] [PubMed] [Google Scholar]
- 24.Kapur N, Masters IB, Chang AB. Exacerbations in noncystic fibrosis bronchiectasis: Clinical features and investigations. Respir Med. 2009;103:1681–7. doi: 10.1016/j.rmed.2009.05.007. [DOI] [PubMed] [Google Scholar]
- 25.Hare KM, Grimwood K, Leach AJ, Smith-Vaughan H, Torzillo PJ, Morris PS, et al. Respiratory bacterial pathogens in the nasopharynx and lower airways of Australian indigenous children with bronchiectasis. J Pediatr. 2010;157:1001–5. doi: 10.1016/j.jpeds.2010.06.002. [DOI] [PubMed] [Google Scholar]
- 26.Macfarlane JG, McAlinden P, De Soyza A. Longitudinal study of sputum microbiology in adult Non-CF bronchiectasis. Thorax. 2010;65:A177. [Google Scholar]
- 27.Kapur N, Grimwood K, Masters IB, Morris PS, Chang AB. Lower airway microbiology and cellularity in children with newly diagnosed non-CF bronchiectasis. Pediatr Pulmonol. 2012;47:300–7. doi: 10.1002/ppul.21550. [DOI] [PubMed] [Google Scholar]
- 28.Murray MP, Govan JR, Doherty CJ, Simpson AJ, Wilkinson TS, Chalmers JD, et al. A randomized controlled trial of nebulized gentamicin in non-cystic fibrosis bronchiectasis. Am J Respir Crit Care Med. 2011;183:491–9. doi: 10.1164/rccm.201005-0756OC. [DOI] [PubMed] [Google Scholar]
- 29.Sahabudeen WA, Smith DL. Longitudinal microbiology of adult Non-CF brochiectasis. Thorax. 2011;66:A49. [Google Scholar]
- 30.Chalmers JD, Smith MP, McHugh BJ, Doherty C, Govan JR, Hill AT. Short- and long-term antibiotic treatment reduces airway and systemic inflammation in non-cystic fibrosis bronchiectasis. Am J Respir Crit Care Med. 2012;186:657–65. doi: 10.1164/rccm.201203-0487OC. [DOI] [PubMed] [Google Scholar]
- 31.Hare KM, Leach AJ, Morris PS, Smith-Vaughan H, Torzillo P, Bauert P, et al. Impact of recent antibiotics on nasopharyngeal carriage and lower airway infection in Indigenous Australian children with non-cystic fibrosis bronchiectasis. Int J Antimicrob Agents. 2012;40:365–9. doi: 10.1016/j.ijantimicag.2012.05.018. [DOI] [PubMed] [Google Scholar]
- 32.Smith DJ, Anderson GJ, Bell SC, Reid DW. Elevated metal concentrations in the CF airway correlate with cellular injury and disease severity. J Cyst Fibros. 2014;13:289–95. doi: 10.1016/j.jcf.2013.12.001. [DOI] [PubMed] [Google Scholar]
- 33.Wilson R, Welte T, Polverino E, De Soyza A, Greville H, O’Donnell A, et al. Ciprofloxacin dry powder for inhalation in non-cystic fibrosis bronchiectasis: A phase II randomised study. Eur Respir J. 2013;41:1107–15. doi: 10.1183/09031936.00071312. [DOI] [PMC free article] [PubMed] [Google Scholar]
- 34.Rogers GB, van der Gast CJ, Cuthbertson L, Thomson SK, Bruce KD, Martin ML, et al. Clinical measures of disease in adult non-CF bronchiectasis correlate with airway microbiota composition. Thorax. 2013;68:731–7. doi: 10.1136/thoraxjnl-2012-203105. [DOI] [PubMed] [Google Scholar]
- 35.Pizzutto SJ, Grimwood K, Bauert P, Schutz KL, Yerkovich ST, Upham JW, et al. Bronchoscopy contributes to the clinical management of indigenous children newly diagnosed with bronchiectasis. Pediatr Pulmonol. 2013;48:67–73. doi: 10.1002/ppul.22544. [DOI] [PubMed] [Google Scholar]
- 36.Chalmers JD, Goeminne P, Aliberti S, McDonnell MJ, Lonni S, Davidson J, et al. The bronchiectasis severity index. An international derivation and validation study. Am J Respir Crit Care Med. 2014;189:576–85. doi: 10.1164/rccm.201309-1575OC. [DOI] [PMC free article] [PubMed] [Google Scholar]
- 37.King PT. The pathophysiology of bronchiectasis. Int J Chron Obstruct Pulmon Dis. 2009;4:411–9. doi: 10.2147/copd.s6133. [DOI] [PMC free article] [PubMed] [Google Scholar]
- 38.Shah PL, Mawdsley S, Nash K, Cullinan P, Cole PJ, Wilson R. Determinants of chronic infection with Staphylococcus aureus in patients with bronchiectasis. Eur Respir J. 1999;14:1340–4. doi: 10.1183/09031936.99.14613409. [DOI] [PubMed] [Google Scholar]