
Figure 3. Statistical parsimony network and geographical distribution of plastid DNA haplotypes.
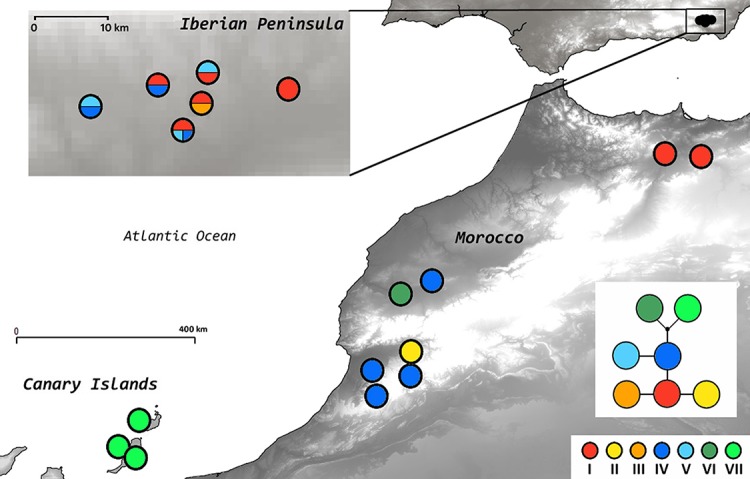
The insert shows populations within the Iberian Peninsula. The small black dot represents a missing intermediate haplotype. Sectors within circles in the map indicate the presence of different haplotypes in different individuals of the same population.