Abstract
The suprachiasmatic nucleus (SCN) in mammals is the master clock which regulates circadian rhythms. Neural activity of SCN neurons is synchronized to external light through the retinohypothalamic tract (RHT). The paraventricular thalamic nucleus (PVT) is a neural structure that receives synaptic inputs from, and projects back to, the SCN. Lesioning the anterior PVT (aPVT) modifies the behavioral phase response curve induced by short pulses of bright light. In order to study the influence of the aPVT on SCN neural activity, we addressed whether the stimulation of the aPVT can modulate the electrical response of the SCN to either retinal or RHT stimulation. Using in vitro and in vivo recordings, we found a large population of SCN neurons responsive to the stimulation of either aPVT or RHT pathways. Furthermore, we found that simultaneous stimulation of the aPVT and the RHT increased neuronal responsiveness and spontaneous firing rate (SFR) in neurons with a low basal SFR (which also have more negative membrane potentials), such as quiescent and arrhythmic neurons, but no change was observed in neurons with rhythmic firing patterns and more depolarized membrane potentials. These results suggest that inputs from the aPVT could shift the membrane potential of an SCN neuron to values closer to its firing threshold and thus contribute to integration of the response of the circadian clock to light.
Keywords: circadian, hypothalamus, intralaminar nuclei, light entrainment, patch‐clamp
Introduction
The suprachiasmatic nucleus (SCN) hosts the major circadian clock in mammals. In the intact animal, SCN neurons function as a homogeneous clock that transmits its phase to the target structures (Honma et al., 2012). SCN neurons go through the circadian cycle from states of low spontaneous firing rate (SFR) during the night to states of elevated neural activity during the day (Welsh et al., 1995; Shirakawa et al., 2000). In acute experiments, SCN neurons comprise a heterogeneous population consisting of neurons with different firing patterns (Groos & Hendriks, 1979; Shibata et al., 1984; Bos & Mirmiran, 1993; Pennartz et al., 1998).
The SCN receives glutamatergic innervation from the retinohypothalamic tract (RHT). The RHT originates in melanopsin‐containing neurons in the retinal ganglion cell layer (De Vries & Lakke, 1995; Provencio et al., 1998, 2000; Morin & Allen, 2006) and innervates several hypothalamic nuclei (Morin & Allen, 2006). SCN neurons synchronize to light cues via glutamate and pituitary adenylate cyclase‐activating polypeptide (PACAP) released from the RHT terminals onto SCN neurons (Kim & Dudek, 1991; Hannibal, 2002).
The paraventricular thalamic nucleus (PVT), which is one of the intralaminar thalamic nuclei (Groenewegen & Berendse, 1994), receives afferents from the reticular formation in the brainstem, hypothalamus, and cortical and subcortical areas associated with visceral integration (Moga et al., 1995). Moreover, the PVT sends projections to centers related to reward, awareness and motivational states, such as the nucleus accumbens, the amygdala and the prefrontal cortex (Peng & Bentivoglio, 2004). In relation to the circadian system, reciprocal connections between the PVT and the SCN have been described (Watts et al., 1987; Morin et al., 1994; Moga et al., 1995; Moga & Moore, 1997; Novak et al., 2000; Kawano et al., 2001; Peng & Bentivoglio, 2004; Vertes & Hoover, 2008); the PVT also receives afferents from the retina in the rock cavy (Nascimento et al., 2008) and the marmoset (Cavalcante et al., 2005). These mutual connections between the PVT and the SCN suggest a role for the PVT in the regulation of circadian rhythmicity. We have reported that lesioning the anterior part of the PVT (aPVT) modifies the phase response curve (PRC) to light, particularly eliminating the phase advances induced by light pulses at circadian time (CT)23, whereas electrical and glutamatergic stimulation of the aPVT induce a PRC similar to one induced by light (Salazar‐Juarez et al., 2002). We have also reported that the aPVT terminals release gamma‐aminobutyric acid (GABA) and glutamate neurotransmitters onto SCN neurons (Alamilla & Aguilar‐Roblero, 2010). In the present study, we addressed whether the electrical stimulation of the aPVT is able to modulate the response of SCN neurons to photic input. In particular, we studied the probability of generating action potentials and the changes in SFR in SCN neurons after the RHT and the aPVT were stimulated either singly or simultaneously. We found many SCN neurons were responsive to stimulation of both aPVT and RHT inputs; furthermore, simultaneous stimulation (SS) increased both firing probability and SFR in SCN neurons displaying low SFR whereas in SCN neurons with high SFR, neither stimulation had a noticeable effect on their response.
Materials and methods
Animals and general conditions
Male Wistar rats were housed under a 12:12‐h light:dark cycle (lights on at 06.00 h, 400 lux intensity) in a sound‐attenuated room with regulated temperature (22 ± 1 °C) for at least 2 weeks before the beginning of the experiments. Animals had continuous access to food and water. All procedures were approved by the animal care committee from the Instituto de Fisiología Celular at the UNAM and conducted according to the guidelines for use of experimental animals from the Universidad Nacional Autónoma de México in accordance to national laws on the matter (NOM‐062‐200‐1999) in accordance with guidelines from the Society for Neuroscience (National_Research_Council, 2011).
Electrophysiological in vivo recordings
The experiments were carried on in adult male Wistar rats ~ 10–11 weeks of age (180–200 g). Surgical procedures were performed under light anesthesia with halothane, starting at ~ ZT3 (ZT0 is the time of lights‐on) while the actual recordings lasted for 3–4 h between ZT4 and ZT7. A bipolar electrode (300 μm chrome–nickel wire) to be used for electrical stimulation was stereotaxically placed in the PVT (3.5 mm posterior and 0 mm lateral to bregma and 5.8 mm below the surface of the dura; Paxinos & Watson, 1998); a miniature stainless steel screw anchored to the ethmoid bone served as a reference electrode.
Extracellular single‐unit activity of SCN cells was recorded with glass micropipette electrodes (10–15 MΩ) filled with 2 m Na acetate. The signal was amplified and filtered to a final band between 300 and 10 000 Hz (Grass P‐511; Grass Instruments, Warwick, RI, USA). In the vicinity of and throughout the SCN, the recording electrode was advanced in 10‐μm steps using a hydraulic microdrive (Kopf 607 W). When a spontaneously active neuron was found, recordings began with 2 min of spontaneous activity and continued with responses to photic stimulation of the retina, electrical stimulation of the PVT and simultaneous retinal and PVT stimulation. Retinal stimulation was applied by a stroboscopic lamp (Grass PS40 photic stimulator) placed 15 cm in front of the eyes of the rat; the PVT electrical stimulation consisted of square DC pulses of 0.6 mA for 0.5 ms at a frequency of 0.5 Hz (Grass S88 analog stimulator). A short stimulus duration protocol was used to avoid long‐lasting changes in neuronal excitability. The stimulation protocol consisted of a control of 50 s with 100 synchronization pulses but no stimulation, 100 light flashes to the eyes, 100 electrical pulses to the PVT and, finally, 100 flashes to the eyes and electrical pulses to the PVT presented simultaneously. The pulses were applied in a counter‐balanced sequence. At the end of the stimulation protocol the electrode was advanced 100 μm and another neuron was sought. This procedure ensured that recordings were obtained from different neurons. The neuronal activity and the synchronized pulses were recorded on magnetic tape (Ampex) for subsequent off‐line analysis. The microelectrode track finished when the middle portion of the optic chiasm was reached.
At the end of each experiment, a DC electrolytic lesion (1 mA, 5 s) marked the position of the stimulation electrode in the PVT and the last recording position of the microelectrode in the SCN. The animal was then killed with an overdose of sodium pentobarbital, and the brain was removed for histological analysis after fixation by transcardial perfusion of saline (0.9%) followed by 10% formalin. The placement of the recording electrode in the SCN and the stimulation electrode in the PVT was verified by histological examination of 40‐μm coronal sections stained with Cresyl violet. The location of the recorded neurons was estimated by comparing the electrode position at the time of recording to the experimental logbook, with the lesion site determined in camera lucida drawings (Fig. 1).
Figure 1.
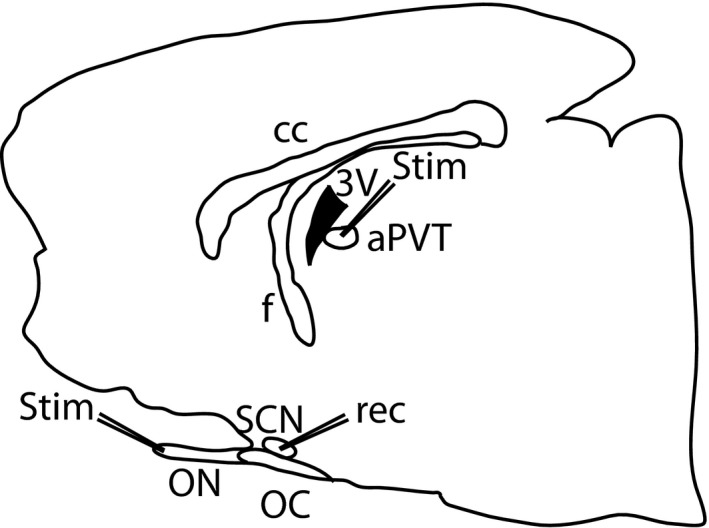
Schematic representation of the preparation. A sagittal slice used for patch‐clamp recordings. The stimulation electrodes (stim) were located on the aPVT and the ON, whereas the recording electrode (rec) was placed into the SCN. Abbreviations: cc, corpus callosum; f, fornix, 3V, third ventricle; aPVT, anterior paraventricular thalamus; ON, optic nerve; OC, optic chiasm; SCN, suprachiasmatic nucelus.
Data were analyzed in a separate session using experimenters workbench software (DataWave Technologies). The signals from the tapes were first digitized at 20 kHz and then a single unit was selected by a window discriminator, and peristimulus, frequency and interspike histograms were constructed. CUSUM procedures were used for the analysis of generated responses after stimulations (Ellaway, 1978). Briefly, CUSUM analysis involves subtraction of a control reference level from a series of data points and adding the differences consecutively. Visible changes in the trend or slope away from the expected horizontal progression of points indicate changes in firing; a positive trend (up) would indicate excitation and a negative trend (down) would indicate inhibition. Latency and duration of the responses were determined from the peristimulus histograms.
Electrophysiological in vitro recordings
Brain slice preparation
Wistar rats between 35 and 45 postnatal days old (90–100 g) were deeply anaesthetized between 3 and 5 h after lights on, and the brain was quickly removed and placed in ice‐cold low‐Ca2+ artificial cerebrospinal fluid (aCSF) containing (in mm): NaCl, 126; KCl, 2.5; NaH2PO4, 1.2; MgCl2, 4; CaCl2, 0.5; NaHCO3, 26; and glucose, 10; pH 7.4, 330 mOsm/L; oxygenated with a gas mixture of 95% O2 and 5% CO2. Sagittal sections of 300–350 μm were obtained using a vibratome (Vibratome, St Louis, MO, USA), and a slice containing the SCN, the aPVT and the optic nerve was transferred to a recovery chamber with fresh low‐Ca2+ aCSF at room temperature (RT) under continuous oxygenation, at least 1 h before the experiments. To ensure that the aPVT, the optic nerve and the SCN were contained in the same slice (Fig. 1), only one slice was collected per brain. The slice was then placed in the recording chamber and continuously superfused (2.5–5 mL/min) with oxygenated aCSF at RT.
Whole‐cell and cell‐attached recordings
The recording chamber solution was identical to the extraction solution except that CaCl2 was increased to 2.4 mm, MgCl2 reduced to 1.3 mm and the pH adjusted to 7.4. The SCN neurons were visualized, and the recording electrodes were positioned by infrared Nomarski microscopy at 60× using a Nikon Eclipse 600 (Nikon, Melville, NY, USA) with a Dage MTI video camera and monitor. Recordings were made at RT (20–24 °C) using the whole‐cell mode during the subjective day of the circadian cycle, between 5 and 8 h after lights on (midday). The recording electrodes were filled with a solution containing (in mm): KH2PO4, 115; MgCl2, 2; HEPES, 10; EGTA, 0.5; Na2ATP, 2; and Na2GTP, 0.2; pH 7.2, 275 mOsmol/L. Pipettes used for recording had resistances between 2 and 4 MΩ. Once a good seal (> 2 GΩ) was obtained between the recording electrode and the neuron, the membrane was disrupted by gentle suction. Cell‐attached recordings were performed in voltage‐clamp mode, at 0 mV. Loose patch (< 50 MΩ) was used to perform cell‐attached recordings. Whole‐cell recordings were achieved in voltage‐clamp mode; series resistance and capacitance were compensated for by a minimum of 80%. Afterwards, the recordings were performed in current‐clamp mode; the seal was monitored throughout the experiment. Cells were discarded if input resistance was < 150 MΩ and/or access resistance was > 20 MΩ or changed by ≥ 15%. Average access resistance was < 15 MΩ. Input resistance was calculated from the voltage deflection produced by negative current injections (50 pA, 1 s). The average input resistance was 1.7 ± 0.3 GΩ, in those neurons recorded in whole‐cell mode. An Axopatch 200B amplifier (Axon instruments, Foster City, CA, USA) was used for the experiments in patch‐clamp configuration. On‐line data were collected using a digital acquisition board (DAQ; National Instruments) using a custom‐made program in the LabView environment. Recordings were sampled at 10 kHz and filtered at 5 kHz.
In vitro electrical stimulation
Stimulation was delivered to the aPVT or the optic nerve for RHT stimulation (Fig. 1) with a concentric bipolar electrode (outside diameter 125 μm, inner diameter 12.5 μm; FHC, Bowdoin, ME, USA); the bipolar electrode was connected to a constant‐current stimulus isolation unit (Grass PSIU6) driven by a Grass model 2000 stimulator (Grass), synchronized to a computer. Electrical pulses were applied with a frequency of 0.5 Hz; each pulse had a duration of 0.05 ms. In whole‐cell mode, the stimulus strength was adjusted to the lowest intensity that induced a stable response in amplitude. In cell‐attached mode, the stimulus strength was adjusted to induce action potentials to a maximum of 50% of the stimuli.
Probability of evoked action potentials
Action potentials were first evoked at a hyperpolarized membrane potential (Vm; −70 mV) in order to avoid spontaneous firing from the recorded neuron. Neurons were hyperpolarized by injection of negative current until reaching the desired Vm. Then, in order to obtain an index of spike probability, 100 stimuli (S) were applied independently (aPVT or RHT stimulation) or simultaneously to the two afferents (aPVT + RHT stimulation), and the number of times that the neuron reached an action potential (A) was divided by the number of stimuli (A/S). The probability of evoked action potentials was also studied at spontaneous Vm, with the parameters of the stimulus described in the electrical stimulation section. In this condition, no compensatory current was applied to the neuron. Neurons were categorized considering the distribution of the interspike interval histograms and the spike frequency or SFR. Given that the aPVT stimulation showed a longer synaptic latency than RHT stimulation, aPVT stimulation was delivered 5 ms before the RHT stimulation.
Analysis of the afferent stimulation on the SFR
The effect of the afferent stimulation on the SFR was analyzed in the same population of neurons in which the firing probability was analyzed, so the stimuli had similar characteristics as previously described (stimulation section; 100 stimuli/0.5 Hz). The SFR was recorded for 3.5 min during each of the following conditions: (i) Control (Ctrl) 1, without any stimulation; (ii) aPVT simulation (iii) RHT stimulation; (iv) aPVT and RHT SS; and (v) Ctrl 2, after stimulation. The aim of this last measurement was to determine long‐lasting effects on neuronal excitability after stimulation.
Identification of SCN neurons responsive to stimulation
Our preparation of sagittal slices (Fig. 1) offers the advantage of containing in the same slice the aPVT and SCN neurons and the fibers that project from the former to the latter. In order to have an accurate account of the placement of the recording pipette within the SCN we visualized the electrode tip using a 10× objective and marked the position of every neuron studied in a representative drawing from the sagittal section of the SCN.
Electrophysiological and statistical analysis
Analysis of the probability of an action potential and SFR was performed using mini analysis 6.0.3 (Synaptosoft, Decatur, GA, USA) and origin (OriginLab, Northampton, MA, USA). Statistical tests used were nonparametric unless otherwise stated (graphpad Software, La Jolla, CA, USA and spss, IBM Corporation, Armonk, NY, USA). We used nonparametric statistics because our samples were small and we could not assume the normality of the outcomes. The α level was set at 0.05. Data are presented as mean ± SEM.
Results
Extracellular in vivo recordings
A total of 200 neurons were recorded from 33 rats. The histological analysis showed that 148 (74%) were located in the surrounding hypothalamic area outside the SCN (AHA; Fig. 2A) and 52 (26%) were located within the SCN (Fig. 2B). All recorded neurons were located in a region centered on the SCN with a radius of ~ 1500 μm. Analysis of spontaneous firing frequency in SCN neurons showed an overall firing frequency of 2.93 ± 2.41 Hz.
Figure 2.
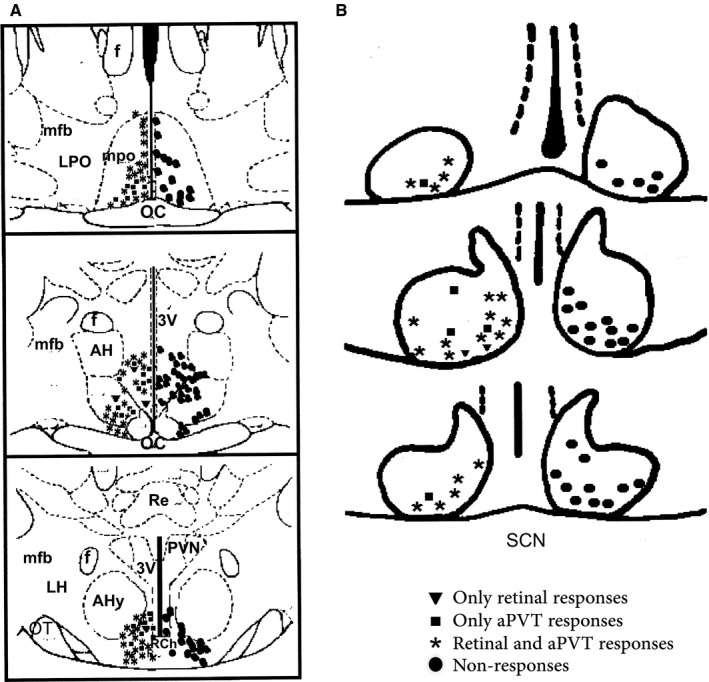
Location of extracellular recording marks in vivo. (A) Neurons recorded outside the SCN, circles on the right indicate the neurons that did not respond to stimulation; on the left, are neurons that responded to only retinal stimulation, to only aPVT stimulation and to both stimuli. (B) Neurons recorded in the SCN. Abbreviations: OC, optic chiasm; AHy, anterior hypothalamic area; RCh, retrochiasmatic area; mpo, medial preoptic area; LPO, lateral preoptic area; 3V, third ventricle; AH, anterior hypothalamus; F, fornix; PVN, paraventricular nucleus of the hypothalamus; LH, lateral hypothalamus.
SCN neurons responding to in vivo stimulation
From 52 neurons recorded within the SCN, 26 (50%) responded to some type of stimulation and the remaining 26 neurons did not respond to any of the stimuli. From the SCN‐responsive neurons, 7.7% (n = 2) responded only to light stimulation, 19.2% (n = 5) responded only to PVT stimulation and 73.1% (n = 19) responded to both stimuli. The latency of response of SCN neurons to light stimulation was 14.8 ± 1.1 ms and the latency of response to PVT stimulation was 15.7 ± 3.7 ms. Most of the neurons (78.9%) responding to SS only responded to one afferent (either retina or PVT) when stimulated independently, but the response was modified when the two afferents were stimulated at the same time (Fig. 3). Only a few neurons (21.1%) that responded independently to stimulation of the retina and PVT modified their responses when the two afferents were simultaneously stimulated.
Figure 3.
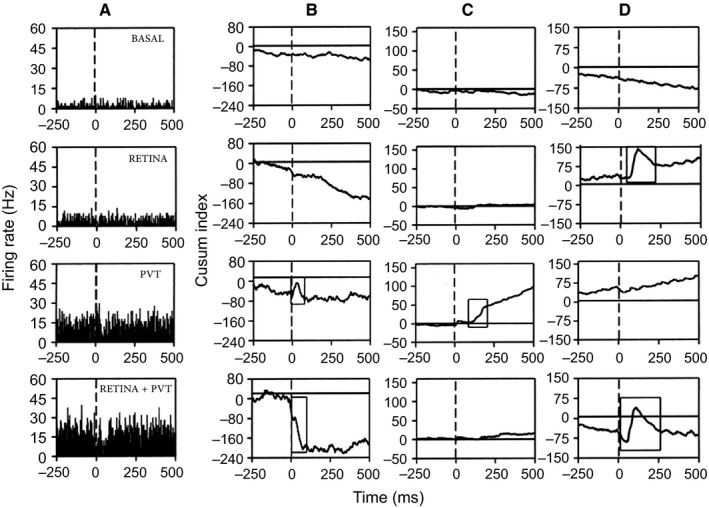
Examples of 3 SCN neurons recorded in vivo on which functional convergence of the retina and the aPVT occurs. (A) Peristimulus histogram showing a SCN neuron responding to aPVT but not to retinal stimulation; when both afferents were stimulated, the response to aPVT stimulation was modulated from an excitation to an inhibition. (B) CUSUM analysis (cumulative frequency analysis) from the same neurons as in A. (C and D) Two additional examples of the CUSUM analysis; in C, the neuron responded to aPVT stimulation with an excitation that disappears when the aPVT is stimulated simultaneously with the retina. In D, the SCN neuron responded to retinal stimulation with an excitation followed by inhibition; simultaneous stimulation of both the aPVT and the retina modulates the response to inhibition‐excitation‐inhibition. The rectangles in the CUSUM graphs indicate the statistically significant responses (Mann‐Whitney test, P < 0.05).
From 148 AHA‐recorded neurons, 81 (54.8%) responded to either retinal or PVT stimulation and the remaining 67 (45.2%) neurons did not respond to any type of stimulation. From the AHA responsive neurons, 4.8% responded to both stimuli. The latency of response for AHA neurons to light stimulation was 16.7 ± 3.9 ms.
In vitro recordings
Firing rate and pattern of SCN neurons from in vitro recordings
All neurons were recorded within the SCN and the position of stimulus‐responsive neurons is depicted in a representative drawing from the sagittal section of the SCN in Fig. 4. From a total of 138 SCN neurons, 46 (33.3%) were recorded using a cell‐attached configuration whereas 92 cells (66.7%) were recorded using a whole‐cell configuration. As a first step, we categorized the cells according to the SFR and the distribution of the interspike intervals (Kononenko & Dudek, 2004); we considered normal distributions to be synonymous with rhythmic spike pattern or type I (Fig. 5A and E), and skewed distributions to have an arrhythmic spike pattern, type II (Fig. 5B and F). Neurons with an SFR < 0.5 Hz were considered to be quiescent neurons (Fig. 5C). In the quiescent group, although there were fewer data points because of the low firing rate, the interspike distributions were also skewed (data not shown). In whole‐cell recordings, we found five bursting cells characterized by brief bursts of action potentials followed by a silent period (Fig. 5D); these cells were similar to those described by Groos & Hendriks (1979) and Shibata et al. (1984). We sorted the cells in order to unmask any possible harm resulting from the invasive whole‐cell configuration (Schaap et al., 1999).
Figure 4.
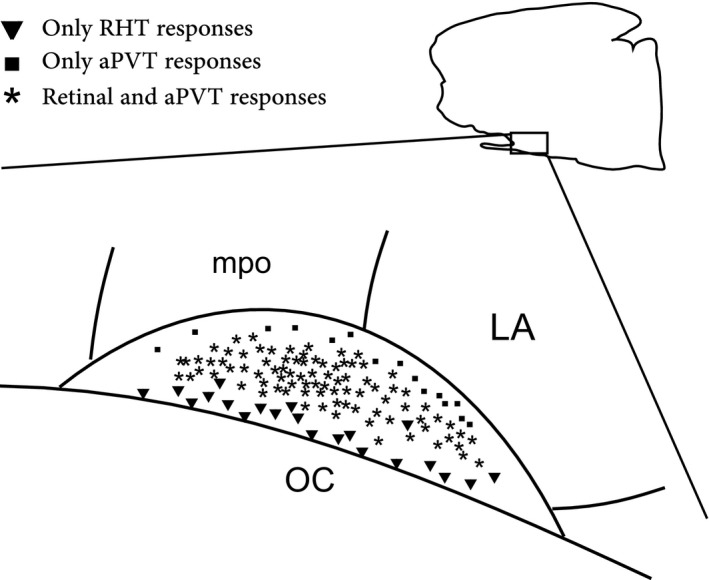
Schematic representation of 122 SCN neurons recorded in vitro which responded to different types of stimulation; the inset indicates the outline of sagittal section shown in Fig. 1. Abbreviations: OC, optic chiasm; mpo, medial preoptic area; LA, lateral anterior hypothalamus.
Figure 5.
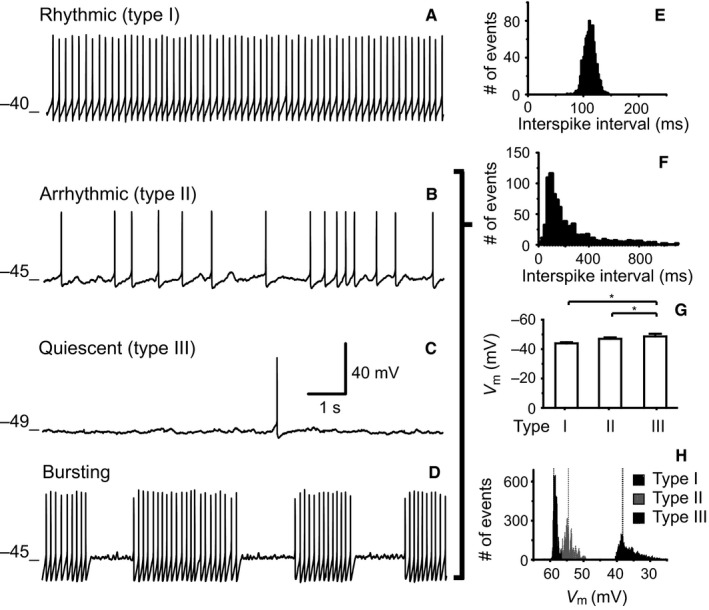
Firing patterns recorded in SCN neurons in vitro. (A) Rhythmic firing presents a narrow Gaussian interspike interval distribution (E). (B) Arrhythmic firing in which the interspike interval has a Poisson distribution (F). (C) Quiescent, with sporadic action potentials. (D) Bursting firing in which bursts of action potentials are followed by periods of silence. Voltage traces A–C indicate the in Vm for the different spike patterns shown. (E) Interspike interval histogram of the rhythmic neuron shown in A. The histogram has a normal distribution, characteristic of this type of spike pattern. (F) Interspike interval histogram of the arrhythmic neuron illustrated in B. This type of distribution is also characteristic of the arrhythmic, the quiescent and the bursting spike patterns. (G) Average and SEM of the Vm related to the different spike patterns of all SCN neurons recorded in whole‐cell mode, *P < 0.05. (H) Frequency histograms of raw data (20 000 points) belonging to rhythmic neurons (type I), arrhythmic neurons (type II) and quiescent neurons (type III). Dotted lines show the median for each distribution.
In quiescent neurons from the SCN, Vm was more negative (−49 ± 2.0 mV; type III) than in arrhythmic (−46 ± 1.0 mV; type II) or rhythmic (−43 ± 0.8 mV; type I) neurons. The mean values of the neuronal Vm from all SCN neurons recorded in the whole‐cell configuration are shown in Fig. 5G. These differences were significant (arrhythmic, n = 37; rhythmic, n = 36; and quiescent, n = 14; Kruskal–Wallis test, H = 7.0, df = 2, P = 0.02; Dunn's post hoc, rhythmic compared with quiescent, P < 0.05; arrhythmic compared with quiescent, P < 0.05). Frequency histograms of Vm from raw data are shown in Fig. 5H. These results suggest that the Vm contributes to determining the spike pattern.
In cell‐attached recordings, 30 neurons (65.2%) showed an arrhythmic spike pattern, 13 cells (28.3%) were rhythmic and three (6.5%) showed a quiescent pattern (Fig. 6A). In whole‐cell experiments, 37 neurons (40.2%) had an arrhythmic spike pattern, 36 cells (39.1%) had a rhythmic pattern, 14 neurons (15.3%) were quiescent and the remaining five neurons (5.4%) fired in bursts. The spike pattern distributions were similar in the two recording configurations, which suggest that our whole‐cell methodology maintained the SCN neurons in a healthy state at least for the period that the experimental procedures lasted. For further analyses, only the firing pattern was taken into consideration regardless of the recording mode, given that no significant differences were found in the firing pattern induced by the recording configuration (cell‐attached/whole‐cell/all neurons) χ 2 = 9.35, df = 6, P = 0.155 (Fig. 6), and the five bursting neurons were included in the arrhythmic category.
Figure 6.
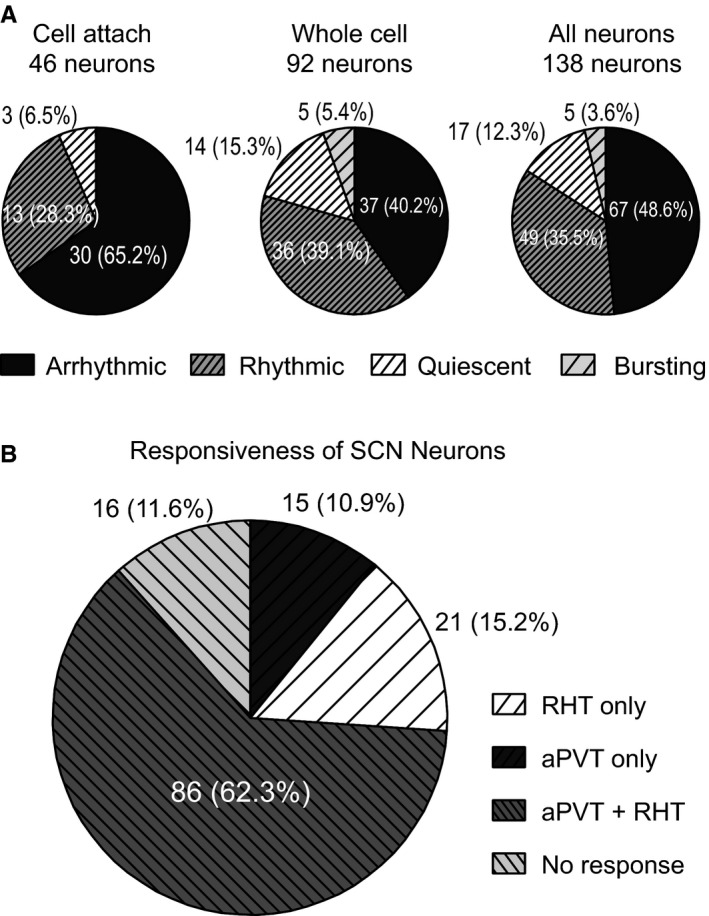
(A) Relative frequency of spike patterns found in the SCN in cell‐attached (left), whole‐cell (middle) and all patch‐clamp (right) recordings. (B) Relative distribution of responsiveness of SCN neurons to aPVT and RHT stimulation, as well as the non‐responsive neurons recorded in vitro (cell‐attached and whole‐cell modes).
Responsiveness of SCN neurons to aPVT or RHT stimulation
We stimulated either the optic nerve (RHT) or the aPVT or both inputs simultaneously. In experiments using a whole‐cell configuration, we considered an SCN neuron responsive to stimulation of either pathway when the neuron firing was able to follow 10‐Hz stimulation frequency. In cell‐attached experiments, the neurons that showed action potentials in 80% of the stimulation trials (in either of the pathways) were considered responsive (the stimulus intensity was increased 2× to increase the probability of firing action potentials). From a total of 138 neurons recorded, 16 neurons (11.6%) did not show any response whereas we found responses to either or both inputs in 122 neurons (88.4%); 15 neurons (10.9%) responded only to aPVT stimulation, 21 neurons (15.2%) responded only to RHT stimulation and 86 (62.3%) responded to stimulation from both inputs simultaneously (Fig. 6B). In the whole‐cell configuration, the response to aPVT stimulation showed a synaptic latency of 10.8 ± 0.4 ms whereas the latency to RHT stimulation was 5.7 ± 0.3 ms (n = 84; t = 10.3, df = 152, P < 0.0001, unpaired t‐test). No differences from in vivo recordings vs. in vitro were found among the relative responsiveness from SCN neurons to its inputs from the RHT or the aPVT, either individually or simultaneously stimulated [χ 2 (1) = 2.033, df = 2, P = 0.362].
The aPVT and the RHT modulated the firing probability of hyperpolarized SCN neurons
As we noted in the previous section, a subpopulation of SCN neurons receive overlapping inputs from the aPVT and the RHT. In order to address whether the aPVT modulates the excitability of SCN neurons in response to RHT stimulation, in 12 neurons we hyperpolarized the neuronal Vm to −70 mV; this holding potential was used to eliminate spontaneous action potentials, which could mask the response to the stimulus and are present in the majority of the SCN neurons. We stimulated the aPVT and the RHT, either independently or simultaneously; we took into consideration the difference in synaptic delay that exists in the two pathways (see Materials and Methods). The probability of spike induction was 0.04 ± 0.01 for the aPVT stimulation and 0.15 ± 0.05 for the RHT stimulation, whereas the SS of the two pathways increased the probability of a spike to 0.6 ± 0.06 (n = 12, F = 14.2, df = 2, P < 0.0001, Friedman test; Dunn's post hoc, aPVT compared with SS, P < 0.05; Fig. 7). This experiment was performed in a subset of the previously described SCN neurons with no special emphasis on the spike pattern.
Figure 7.
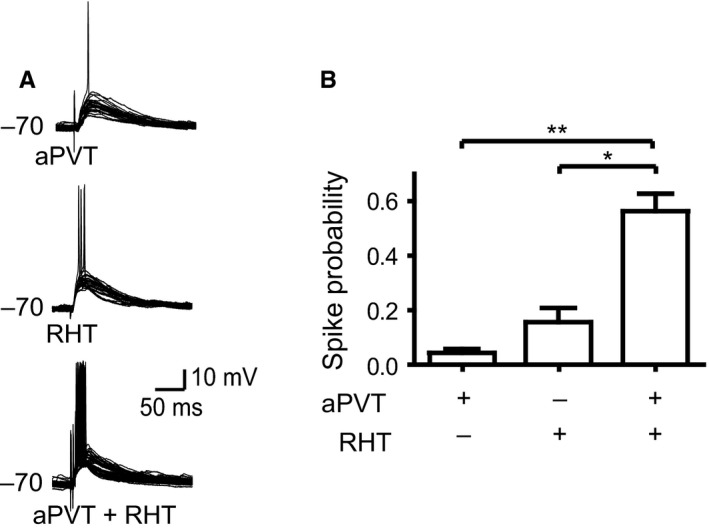
SS of the aPVT and the RHT increases the probability of firing action potentials in hyperpolarized SCN neurons. (A) Overlaid voltage traces (30 sweeps) displaying occurrence of the action potentials by aPVT, RHT and concurrent aPVT and RHT stimulation (SS). (B) SS induces a significant increase in the firing probability over individual stimulation (*P < 0.05; **P < 0.001).
The aPVT and the RHT modulated excitability of SCN neurons at spontaneous interspike Vm
In order to address whether under physiological conditions the aPVT modulates the response of SCN neurons to RHT stimulation, we proceeded to analyze the probability of spike induction at the spontaneous interspike Vm. We measured the number of spikes that result from the stimulation (100 stimuli at 0.5 Hz) of each pathway individually or simultaneously. In order to have a better picture of the spike induction we sorted the cells into the different categories as previously described (rhythmic, arrhythmic and quiescent). For all neurons, regardless of their firing pattern, SS increased the probability of firing compared to individual stimulation of each input (aPVT, 0.4 ± 0.03; RHT, 0.3 ± 0.03; SS, 0.5 ± 0.04; F = 22, df = 2, P < 0.0001, Friedman test; Dunn's post hoc, aPVT and RHT compared with SS, P < 0.05, n = 86). Similar results were found when we sorted the cells by their characteristic firing patterns: rhythmic neurons (aPVT, 0.3 ± 0.05; RHT, 0.3 ± 0.06; SS, 0.47 ± 0.07; F = 7.7, df = 2, P = 0.02; Dunn's post hoc, aPVT compared with SS, P < 0.05; n = 32; Fig. 8A and D); arrhythmic neurons (aPVT, 0.3 ± 0.03; RHT, 0.3 ± 0.05; SS, 0.5 ± 0.05; F = 11.7, df = 2, P = 0.003; Dunn's post hoc, aPVT and RHT compared with SS, P < 0.05, n = 41; Fig. 8B and E); quiescent neurons (aPVT, 0.4 ± 0.09; RHT, 0.36 ± 0.09; SS, 0.6 ± 0.08; F = 6.3, df = 2, P = 0.04; Dunn's post hoc, aPVT and RHT compared with SS, P < 0.05, n = 13; Fig. 8C and F). No significant association was found between firing pattern and stimulation of the afferents (RHT/aPVT/SS), χ 2 = 0.242, df = 4, P = 0.993. Additionally, in rhythmically and arrhythmically firing neurons we observed a delay in the generation of the next action potential in 43% of the responsive neurons, probably due to an inhibitory interval, which occurred after the spike was induced by the stimulation (Fig. 8A and B).
Figure 8.
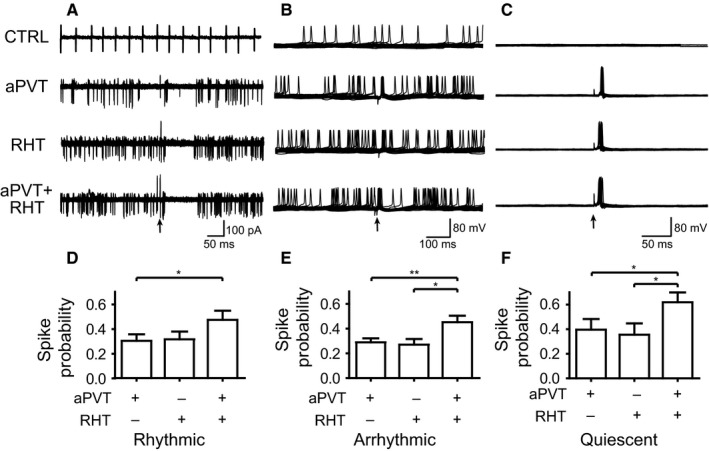
SS of the RHT and the aPVT increases the probability of firing action potentials in different neuronal firing patterns. Overlaid traces (10 sweeps) illustrate different spike patterns and action potential induction by individual afferent stimulation and concurrent stimulation in (A) rhythmic neurons (cell‐attached recordings), (B) arrhythmic neurons and (C) quiescent neurons. The arrows indicate the stimulation of the afferents. (D–F) Modulation of firing probability in (D) rhythmic neurons (*P < 0.05), (E) arrhythmic neurons (*P < 0.01; **P < 0.05) and (F) quiescent neurons (*P < 0.05).
Simultaneous aPVT–RHT stimulation increased firing frequency of quiescent and arrhythmic SCN neurons
In order to determine the effect on the sustained firing rate from SCN neurons after SS of the aPVT and the RHT, we analyzed the effect of independent stimulation or SS of these afferents on SCN neurons. We quantified the neuronal firing rate for 3.5 min during each of the following conditions: (i) Ctrl 1 prior to stimulation; (ii) aPVT stimulation; (iii) RHT stimulation; (iv) SS; and (v) Ctrl 2 after the stimulation (see Materials and Methods). One hundred stimuli were delivered to each pathway as described in Materials and Methods. In rhythmic neurons, none of the stimuli changed the firing frequency with respect to the basal conditions (Ctrl 1, 5.7 ± 0.5 Hz; aPVT, 5.9 ± 0.6 Hz; RHT, 5.8 ± 0.7 Hz; SS, 5.5 ± 0.6 Hz; Ctrl 2, 5.0 ± 0.6 Hz; n = 32; Fig. 9A and D; F = 2.68, df = 4, P = 0.44; Friedman test). In arrhythmic neurons, RHT stimulation and SS increased the firing rate in comparison with the control and aPVT stimulation (Ctrl 1, 1.9 ± 0.2 Hz; aPVT, 2.3 ± 0.2 Hz; RHT, 2.5 ± 0.3 Hz; SS, 2.7 ± 0.3 Hz; Ctrl 2, 2.5 ± 0.3 Hz; F = 21.4, df = 4, P = 0.0003, Friedman test, n = 41; Dunn's post hoc, RHT and SS compared with Ctrl 1, P < 0.05; Fig. 9B and E). Similar results were found in quiescent neurons (Ctrl 1, 0.2 ± 0.1 Hz; aPVT, 0.6 ± 0.2 Hz; RHT, 0.8 ± 0.2 Hz; SS, 0.9 ± 0.2 Hz; Ctrl 2, 0.01 ± 0.1 Hz; F = 37.2, df = 4, P < 0.0001, Friedman test, n = 13; Dunn's post hoc, RHT and SS compared with Ctrl 1, P < 0.05; RHT and SS compared with Ctrl 2, P < 0.05; Fig. 9C and F). The stimulation of the afferents did not cause a persistent effect on the spontaneous firing rate on any of the firing patterns as indicated by the Ctrl 2 firing rates.
Figure 9.
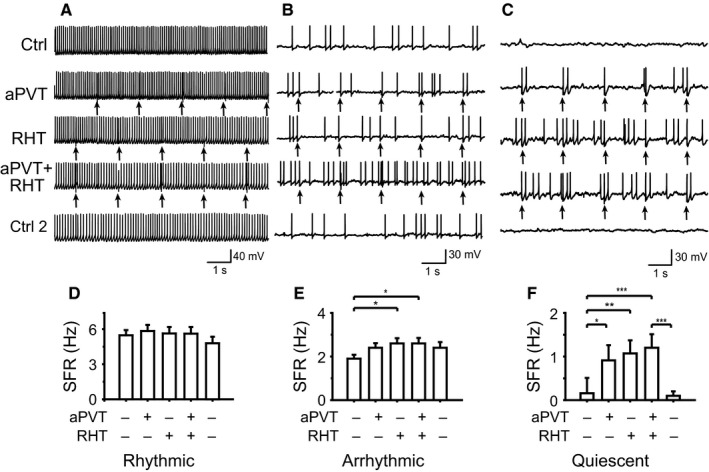
SS has different effects on firing frequency depending on the spontaneous firing pattern and SFR. The afferent stimulation is indicated on the left. Firing patterns and changes induced in firing rate during different stimulations are shown for (A and D) rhythmic neurons, (B and E) arrhythmic neurons (*P < 0.05) and (C and F) quiescent neurons (*P < 0.05; **P < 0.01; ***P < 0.001). Arrows indicate the moment of afferent stimulation.
Discussion
The present data highlight two important issues: first, that functional convergence between retinal and aPVT fibers occurs in many of the responsive SCN neurons and second, that the aPVT is able to modulate SCN neuronal response to RHT stimulation. It is worth noting that although the present experiments were conducted during the light part of the day–night cycle (when photic cues do not shift the phase of the circadian clock), we found modulation of the response to RHT inputs from SCN neurons by PVT stimulation. This finding is consistent with a role of the aPVT in the entrainment of circadian rhythms to light, as previously suggested from the aPVT lesion studies where light induced phase delays at circadian time (CT)23 instead of phase advances (Salazar‐Juarez et al., 2002). The effects of aPVT stimulation during the night, when the clock is phase‐shifted by light, are necessary to understand more fully the role of PVT in modifying SCN responses to light.
Based on their responses to stimulation of the retina and aPVT both in vivo and in vitro, SCN neurons can be grouped into four subpopulations: two neuronal subpopulations are innervated independently by RHT or PVT fibers, a third subpopulation corresponds to SCN neurons where overlapping of RHT and aPVT afferents occurs and, finally, a fourth subpopulation of SCN neurons does not receive any inputs from these pathways. These findings support the notion of microcircuits within the SCN involved in the handling of afferent information. A similar result was previously proposed in a study involving the stimulation of the retina and the intergeniculate leaflet (Roig et al., 1997).
We were interested in determining whether the aPVT is able to modulate SCN responses to RHT inputs. We found that aPVT stimulation could increase SCN excitability when it was combined with RHT stimulation, especially in neurons characterized by a hyperpolarized membrane potential and a low spontaneous firing rate. In a previous report, we showed that the aPVT simultaneously releases glutamate and GABA onto SCN neurons (Alamilla & Aguilar‐Roblero, 2010); however, we did not study the contribution of the aPVT to the neural excitability of SCN neurons. The present results indicate that integration of aPVT and RHT inputs into the SCN modifies neuronal excitability from the effects induced by independent stimulation of the aPVT or the RHT; this was clearly seen in vivo as changes in the direction (from excitation to inhibition) or the complexity (some cells were inhibited, followed by excitation and inhibition) of the response, while in vitro in most cases it was seen as an increase in the probability of a spike (Fig. 8). In the case of increases in neuronal excitability, the effect involves depolarization of neuronal Vm because it was conspicuous in neurons where Vm was hyperpolarized to −70 mV (Fig. 7) and it was also found in neurons with arrhythmic and quiescent spontaneous firing patterns.
The differential effect of the SS of the two afferents related to the different neuronal firing patterns could result from the Vm associated with each pattern (rhythmic ~ −40 mV, arrhythmic ~ −45 mV and quiescent ~ −49 mV). A similar relation between firing pattern and Vm in SCN neurons has been reported previously (Pennartz et al., 1998; Belle et al., 2009). Furthermore, the differential receptivity of SCN neurons to its afferent at a more negative Vm may be due to the increased movement of the ions across the membrane when glutamate receptors are activated. The dual role of GABAergic inputs, inhibitory or excitatory, which depends on the relation between the chloride equilibrium potential and the Vm of SCN neurons, may also contribute. When [Cl−]i is high due to the activity of the KNCC2 chloride transporter, at more negative Vm, it is more likely that the GABAergic inputs are excitatory than when Vm is more depolarized (Alamilla et al., 2014). Additionally, in a more negative Vm, Na2+ channels are deactivated and ready to be activated, which increases the probability that inputs can elicit action potentials.
We found a significant increase in SCN firing rate after RHT stimulation in neurons with low SFR, which often had arrhythmic and quiescent firing patterns, but not in neurons with rhythmic firing pattern and high SFR. SS of the aPVT and the RHT did not increase SFR any further than RHT stimulation alone, while aPVT stimulation by itself produced a nonsignificant increment in firing rate (Fig. 9). It is possible that the lack of effect from the stimulation in neurons with high SFR is because these neurons are already firing close to their maximal firing rate (ceiling effect) and are not sensitive to the inputs coming from the afferents. Bos & Mirmiran (1993) found similar results when analyzing the effects of iontophoretic administration of glutamate on SCN neurons with different spike patterns. In neurons with a rhythmic pattern and a firing rate of ~ 8 Hz, administration of glutamate increases SFR only to 150% of the basal rate, whereas in arrhythmic and quiescent neurons similar administration of glutamate increases the SFR up to ~ 350% and ~ 1000%, respectively (fig. 3 in Bos & Mirmiran, 1993). Kononenko & Dudek (2004) described equivalent results; the authors report differential regulation in the inhibitory GABAergic inputs to SCN neurons depending on their SFR. In rhythmic neurons, which show an SFR > 3.5 Hz, spontaneous GABAergic inputs are almost negligible whereas in arrhythmic neurons, which show an SFR < 3.5 Hz, GABAergic inputs are evident.
Some additional aspects of the functional connectivity among the SCN, the RHT and the aPVT deserve further discussion. As we mentioned before, the present findings support the notion of microcircuits within the SCN involved in the handling of afferent information. Roig et al. (1997) found that the proportion of SCN neurons responding to both retinal and intergeniculate leaflet stimulation (26.1%) is smaller than the one found in the present study for simultaneous retinal and aPVT stimulation (56.2% in vivo and 62% in vitro), while the proportion of neurons responding only to retinal stimulation in the present study (12.5% in vivo and 14% in vitro) is smaller (43.5%) than that reported by Roig and colleagues. Because the proportion of SCN neurons receiving inputs from the retina should be similar in the two experiments such differences could be due to different proportions of sampled SCN neurons, because aPVT fibers distribute more widely on SCN neurons receiving inputs from the RHT than those arising from the intergeniculate leaflet.
The percentage of SCN neurons responsive to simultaneous aPVT and RHT stimulation both in vivo (73%) and in vitro (62%) exceed our expectation based on previous anatomical studies, because in rat the heaviest projections of the RHT impinge on the ventrolateral SCN, (Johnson et al., 1988; Cooper et al., 1993; Speh & Moore, 1993; De Vries & Lakke, 1995; Moga & Moore, 1997), while the projections coming from the aPVT are diffuse throughout the SCN (Moga et al., 1995; Moga & Moore, 1997; Vertes & Hoover, 2008). We are confident that this high proportion of overlapping afferents on the SCN cannot be attributed to the recording procedures, because the proportion of SCN neurons receiving aPVT and RHT inputs was similar in the two procedures (in vivo and in vitro) used in the present study. The high percentage of neurons responsive to SS found in vivo and in vitro indicates that indeed there is a substantial population of SCN neurons that integrates the concomitant inputs coming from the two mentioned pathways.
In conclusion, the results of the present study indicate that although inputs arriving from the aPVT are not strong enough to modify the SCN firing rate by themselves they might contribute to SCN excitability, as was seen by the increase in the probability of response to the RHT when the aPVT is simultaneously stimulated. Thus, both inputs would supply the stimulation necessary for reaching the threshold to elicit an action potential, particularly in neurons with a low SFR. Such a mechanism could be relevant to the entrainment of the circadian clock.
Conflict of interest
The authors declare that there is no conflict of interests regarding the publication of this paper.
Abbreviations
- aCSF
artificial cerebrospinal fluid
- AHA
hypothalamic area
- aPVT
anterior PVT
- Ctrl
Control
- GABA
gamma‐aminobutyric acid
- PACAP
pituitary adenylate cyclase‐activating polypeptide
- PVT
paraventricular thalamic nucleus
- RHT
retinohypothalamic tract
- SCN
suprachiasmatic nucleus
- SFR
spontaneous firing rate
- SS
simultaneous stimulation
- Vm
membrane potential
Acknowledgements
The authors thank Jose Luis Chávez‐Juarez, Ana María Escalante and Francisco Pérez for skillful technical assistance. This work was partially supported by grants from PAPIIT, IN204811, and CONACyT, 128528 and 252482.
References
- Alamilla, J. & Aguilar‐Roblero, R. (2010) Glutamate and GABA neurotransmission from the paraventricular thalamus to the suprachiasmatic nuclei in the rat. J. Biol. Rhythm, 25, 28–36. [DOI] [PubMed] [Google Scholar]
- Alamilla, J. , Perez‐Burgos, A. , Quinto, D. & Aguilar‐Roblero, R. (2014) Circadian modulation of the Cl(‐); Equilibrium potential in the rat suprachiasmatic nuclei. BioMed Res. Int., 2014, 15. [DOI] [PMC free article] [PubMed] [Google Scholar]
- Belle, M.D. , Diekman, C.O. , Forger, D.B. & Piggins, H.D. (2009) Daily electrical silencing in the mammalian circadian clock. Science, 326, 281–284. [DOI] [PubMed] [Google Scholar]
- Bos, N.P. & Mirmiran, M. (1993) Effects of excitatory and inhibitory amino acids on neuronal discharges in the cultured suprachiasmatic nucleus. Brain Res. Bull., 31, 67–72. [DOI] [PubMed] [Google Scholar]
- Cavalcante, J.S. , Costa, M.S. , Santee, U.R. & Britto, L.R. (2005) Retinal projections to the midline and intralaminar thalamic nuclei in the common marmoset (Callithrix jacchus). Brain Res., 1043, 42–47. [DOI] [PubMed] [Google Scholar]
- Cooper, H.M. , Herbin, M. & Nevo, E. (1993) Visual system of a naturally microphthalmic mammal: the blind mole rat, Spalax ehrenbergi. J. Comp. Neurol., 328, 313–350. [DOI] [PubMed] [Google Scholar]
- De Vries, M.J. & Lakke, E.A. (1995) Retrograde labeling of retinal ganglion cells and brain neuronal subsets by [3H]‐D‐aspartate injection in the Syrian hamster hypothalamus. Brain Res. Bull., 38, 349–354. [DOI] [PubMed] [Google Scholar]
- Ellaway, P.H. (1978) Cumulative sum technique and its application to the analysis of peristimulus time histograms. Electroen. Clin. Neuro., 45, 302–304. [DOI] [PubMed] [Google Scholar]
- Groenewegen, H.J. & Berendse, H.W. (1994) The specificity of the ‘nonspecific’ midline and intralaminar thalamic nuclei. Trends Neurosci., 17, 52–57. [DOI] [PubMed] [Google Scholar]
- Groos, G.A. & Hendriks, J. (1979) Regularly firing neurones in the rat suprachiasmatic nucleus. Experientia, 35, 1597–1598. [DOI] [PubMed] [Google Scholar]
- Hannibal, J. (2002) Neurotransmitters of the retino‐hypothalamic tract. Cell Tissue Res., 309, 73–88. [DOI] [PubMed] [Google Scholar]
- Honma, S. , Ono, D. , Suzuki, Y. , Inagaki, N. , Yoshikawa, T. , Nakamura, W. & Honma, K. (2012) Suprachiasmatic nucleus: cellular clocks and networks. Prog. Brain Res., 199, 129–141. [DOI] [PubMed] [Google Scholar]
- Johnson, R.F. , Morin, L.P. & Moore, R.Y. (1988) Retinohypothalamic projections in the hamster and rat demonstrated using cholera toxin. Brain Res., 462, 301–312. [DOI] [PubMed] [Google Scholar]
- Kawano, J. , Krout, K. & Loewy, A. (2001) Suprachiasmatic nucleus projections to the paraventricular thalamic nucleus of the rat. Thalamus Relat. Syst., 1, 197–202. [Google Scholar]
- Kim, Y.I. & Dudek, F.E. (1991) Intracellular electrophysiological study of suprachiasmatic nucleus neurons in rodents: excitatory synaptic mechanisms. J. Physiol., 444, 269–287. [DOI] [PMC free article] [PubMed] [Google Scholar]
- Kononenko, N.I. & Dudek, F.E. (2004) Mechanism of irregular firing of suprachiasmatic nucleus neurons in rat hypothalamic slices. J. Neurophysiol., 91, 267–273. [DOI] [PubMed] [Google Scholar]
- Moga, M.M. & Moore, R.Y. (1997) Organization of neural inputs to the suprachiasmatic nucleus in the rat. J. Comp. Neurol., 389, 508–534. [DOI] [PubMed] [Google Scholar]
- Moga, M.M. , Weis, R.P. & Moore, R.Y. (1995) Efferent projections of the paraventricular thalamic nucleus in the rat. J. Comp. Neurol., 359, 221–238. [DOI] [PubMed] [Google Scholar]
- Morin, L.P. & Allen, C.N. (2006) The circadian visual system, 2005. Brain Res. Rev., 51, 1–60. [DOI] [PubMed] [Google Scholar]
- Morin, L.P. , Goodless‐Sanchez, N. , Smale, L. & Moore, R.Y. (1994) Projections of the suprachiasmatic nuclei, subparaventricular zone and retrochiasmatic area in the golden hamster. Neuroscience, 61, 391–410. [DOI] [PubMed] [Google Scholar]
- Nascimento, E.S. , Duarte, R.B. , Silva, S.F. , Engelberth, R.C.G.J. , Toledo, C.A.B. , Cavalcante, J.S. & Costa, M.S.M.O. (2008) Retinal projections to the thalamic paraventricular nucleus in the rock cavy (Kerodon rupestris). Brain Res., 1241, 56–61. [DOI] [PubMed] [Google Scholar]
- National_Research_Council (2011) Guide to Care an Use Animals in Experimentation, 8th edn The national Academies Press, Washington, DC. [Google Scholar]
- Novak, C.M. , Harris, J.A. , Smale, L. & Nunez, A.A. (2000) Suprachiasmatic nucleus projections to the paraventricular thalamic nucleus in nocturnal rats (Rattus norvegicus) and diurnal nile grass rats (Arviacanthis niloticus). Brain Res., 874, 147–157. [DOI] [PubMed] [Google Scholar]
- Paxinos, G. & Watson, C. (1998) The Rat Brain: In Stereotaxic Coordinates. Academic Press, Incorporated. [Google Scholar]
- Peng, Z.C. & Bentivoglio, M. (2004) The thalamic paraventricular nucleus relays information from the suprachiasmatic nucleus to the amygdala: a combined anterograde and retrograde tracing study in the rat at the light and electron microscopic levels. J. Neurocytol., 33, 101–116. [DOI] [PubMed] [Google Scholar]
- Pennartz, C.M. , De Jeu, M.T. , Geurtsen, A.M. , Sluiter, A.A. & Hermes, M.L. (1998) Electrophysiological and morphological heterogeneity of neurons in slices of rat suprachiasmatic nucleus. J. Physiol., 506(Pt 3), 775–793. [DOI] [PMC free article] [PubMed] [Google Scholar]
- Provencio, I. , Cooper, H.M. & Foster, R.G. (1998) Retinal projections in mice with inherited retinal degeneration: implications for circadian photoentrainment. J. Comp. Neurol., 395, 417–439. [DOI] [PubMed] [Google Scholar]
- Provencio, I. , Rodriguez, I.R. , Jiang, G.S. , Hayes, W.P. , Moreira, E.F. & Rollag, M.D. (2000) A novel human opsin in the inner retina. J. Neurosci., 20, 600–605. [DOI] [PMC free article] [PubMed] [Google Scholar]
- Roig, J. , Granados‐Fuentes, D. & Aguilar‐Roblero, R. (1997) Neuronal Subpopulations in the suprachiasmatic nuclei based on their response to retinal and intergeniculate leaflet stimulation. NeuroReport, 8, 5. [DOI] [PubMed] [Google Scholar]
- Salazar‐Juarez, A. , Escobar, C. & Aguilar‐Roblero, R. (2002) Anterior paraventricular thalamus modulates light‐induced phase shifts in circadian rhythmicity in rats. Am. J. Physiol. Reg. I., 283, R897–R904. [DOI] [PubMed] [Google Scholar]
- Schaap, J. , Bos, N.P. , de Jeu, M.T. , Geurtsen, A.M. , Meijer, J.H. & Pennartz, C.M. (1999) Neurons of the rat suprachiasmatic nucleus show a circadian rhythm in membrane properties that is lost during prolonged whole‐cell recording. Brain Res., 815, 154–166. [DOI] [PubMed] [Google Scholar]
- Shibata, S. , Oomura, Y. , Liou, S.Y. & Ueki, S. (1984) Electrophysiological studies of the development of suprachiasmatic neuronal activity in hypothalamic slice preparations. Brain Res., 315, 29–35. [DOI] [PubMed] [Google Scholar]
- Shirakawa, T. , Honma, S. , Katsuno, Y. , Oguchi, H. & Honma, K.I. (2000) Synchronization of circadian firing rhythms in cultured rat suprachiasmatic neurons. Eur. J. Neuorsci., 12, 2833–2838. [DOI] [PubMed] [Google Scholar]
- Speh, J.C. & Moore, R.Y. (1993) Retinohypothalamic tract development in the hamster and rat. Brain Res. Dev. Brain Res., 76, 171–181. [DOI] [PubMed] [Google Scholar]
- Vertes, R.P. & Hoover, W.B. (2008) Projections of the paraventricular and paratenial nuclei of the dorsal midline thalamus in the rat. J. Comp. Neurol., 508, 212–237. [DOI] [PubMed] [Google Scholar]
- Watts, A.G. , Swanson, L.W. & Sanchez‐Watts, G. (1987) Efferent projections of the suprachiasmatic nucleus: I. Studies using anterograde transport of Phaseolus vulgaris leucoagglutinin in the rat. J. Comp. Neurol., 258, 204–229. [DOI] [PubMed] [Google Scholar]
- Welsh, D.K. , Logothetis, D.E. , Meister, M. & Reppert, S.M. (1995) Individual neurons dissociated from rat suprachiasmatic nucleus express independently phased circadian firing rhythms. Neuron, 14, 697–706. [DOI] [PubMed] [Google Scholar]


