Abstract
Oxide‐derived copper (OD‐Cu) electrodes exhibit unprecedented CO reduction performance towards liquid fuels, producing ethanol and acetate with >50 % Faradaic efficiency at −0.3 V (vs. RHE). By using static headspace‐gas chromatography for liquid phase analysis, we identify acetaldehyde as a minor product and key intermediate in the electroreduction of CO to ethanol on OD‐Cu electrodes. Acetaldehyde is produced with a Faradaic efficiency of ≈5 % at −0.33 V (vs. RHE). We show that acetaldehyde forms at low steady‐state concentrations, and that free acetaldehyde is difficult to detect in alkaline solutions using NMR spectroscopy, requiring alternative methods for detection and quantification. Our results represent an important step towards understanding the CO reduction mechanism on OD‐Cu electrodes.
Keywords: analytical chemistry, catalysis, electrochemistry, energy conversion, materials science
Utilization of CO2 as a feedstock for producing fuels and commodity chemicals is a highly promising technology for reducing the anthropogenic carbon footprint. Capture of CO2 from point sources or ambient air, followed by reduction, gives an opportunity to close the carbon cycle.1 Electrochemical technology provides a means of achieving this, as electrochemical devices can operate at ambient conditions, with minimal capital investment, and with fast start–stop cycles enabling coupling to intermittent energy sources. To date, implementation of this technology is hindered by a lack of electrocatalysts capable of converting CO2 into energy‐rich products in an efficient and selective manner. Copper is the only pure metal that is active for CO2 reduction towards hydrocarbons and alcohols.2 However, high overpotentials are needed and a variety of products are formed. Measurements on planar extended surfaces of Cu electrodes showed that potentials of −1 V (vs. RHE), or overpotentials, η>≈1.0 V, are needed to produce significant amounts of C2 products, that is, above 5 % Faradaic efficiency with a current density of 1 mA cm−2 or higher.2, 3, 4, 5, 6
A viable route forward is to split the reaction into two sequences; reducing CO2 to CO at first, and then reducing CO to the desired product in a second step. Since CO is a key intermediate in the reduction of CO2 to alcohols and hydrocarbons, CO reduction can be used as a proxy for understanding trends in CO2 reduction.2, 4 Several catalysts have been reported to reduce CO2 to CO efficiently and selectively,7, 8, 9, 10, 11 but the second step remains a challenge owing to multi‐electron transfer involving several reaction intermediates.12 This calls for development of new catalysts with improved energy efficiency and selectivity for CO reduction towards valuable compounds. Kanan and co‐workers recently achieved a breakthrough in this area; they showed that oxidation and subsequent reduction of polycrystalline copper yields a high surface area metallic copper electrode with unprecedented CO electroreduction performance.13, 14 Oxide‐derived copper (OD‐Cu) has a Faradaic efficiency towards ethanol as high as 43 % at −0.3 V, η≈500 mV (U0 CO/CH3CH2OH=0.18 V), and a total Faradaic efficiency towards CO reduction products of 57 %, with a total geometric current density of ≈0.3 mA cm−2.
The underlying reasons for the high performance of OD‐Cu electrodes remain unknown. Our own temperature programmed desorption (TPD) experiments show that the activity correlates with the presence of strong binding sites, which in turn correlates with the presence of grain boundaries.15 Importantly, the mechanism for ethanol production has not been determined yet. In this work, we reveal the role of acetaldehyde as a likely reaction intermediate and product of CO reduction on OD‐Cu electrodes.
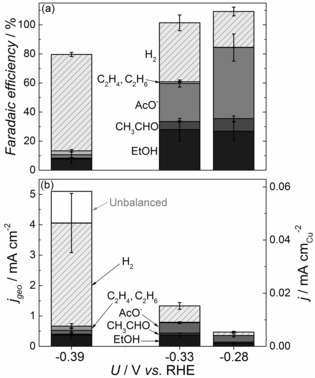
Oxide‐derived Cu electrodes were produced following the procedure outlined by Li et al. (Supporting Information, section S.1).14 The resulting electrodes had a roughness factor of 87±10 (section S.2). Electrochemical CO reduction was carried out in CO‐saturated 0.1 m KOH electrolyte. We used three approaches to analyze the reaction products. The gas phase composition over the electrolyte was measured by gas chromatography (GC). The liquid phase products were analyzed by extracting liquid samples and using a combination of nuclear magnetic resonance (NMR) spectroscopy and static headspace gas chromatography (HS‐GC), the latter coupled with either a flame ionization detector (FID) or a mass spectrometer (MS). Figure 1 a shows the Faradaic efficiency for CO reduction on oxide‐derived Cu electrodes. Results resemble those reported by Kanan and co‐workers.14 At −0.33 V (vs. RHE; unless otherwise stated, all potentials in this work are given against the RHE scale), the current efficiency to ethanol and acetate is 25 % for each, and 1 % of the charge results in ethylene and ethane. Our observation that C2H4 and C2H6 is formed on OD‐Cu is consistent with earlier works.14, 16 The parasitic evolution of hydrogen accounts for the remaining ≈40 %. Interestingly, we observed that acetaldehyde, which is previously unreported on OD‐Cu, is produced with a current efficiency of 5 % at −0.33 V, or η≈400 mV (U0 CO/CH3CHO=0.10 V). The fact that we can only observe C2 products corresponds well with the previous observations that such products are favored on Cu‐based electrodes at low overpotentials under alkaline conditions.14, 17 The total Faradaic efficiency at −0.28 and −0.33 V comes, within the experimental error, to ≈100 %; we attribute the error to uncertainties in the calibration as well as minor leaks. At −0.39 V, ≈20 % of the charge is not accounted for; this is likely to be caused by the high current density towards hydrogen evolution, where some of the H2 escapes the cell. Figure 1 b shows the partial current densities to the various products, normalized to the geometrical and specific electrode surface area. The overall current densities are two to three times higher than those reported by Li et al. at all potentials.14 This discrepancy could be caused by differences in mass transport, which is a function of the cell design. Alternatively, the greater capacitance observed for the electrodes produced in the current study could indicate that they have a higher surface area (section S.2).
Figure 1.

CO reduction on oxide‐derived Cu electrodes. (a) Faradaic efficiency and (b) current density normalized to geometric and specific surface area for the individual products. Measurements were carried out in CO saturated (1.1 bar) 0.1 m KOH. Note: The unbalanced contribution to the current is only added at −0.39 V, since the total Faradaic efficiency at the other two potentials are ≈100 % within the experimental error. The data are based on at least three independent measurements for each potential. At −0.28 V, electrolysis was carried out until the accumulated charge reached ≈5 C, and at −0.33 and −0.39 V until ≈10 C.
Earlier studies on extended surfaces of Cu have suggested that acetylaldehyde is an intermediate for ethanol production from CO2 or CO reduction;3, 18 Hori et al. reported that on polycrystalline Cu, acetaldehyde is formed from CO at potentials negative of −0.83 V RHE, albeit with a low selectivity of 0.5 %. They also showed that acetaldehyde can be reduced to ethanol,16 suggesting it is a soluble intermediate in the reaction (incidentally acetaldehyde is a key intermediate in ethanol oxidation, the reverse reaction19).
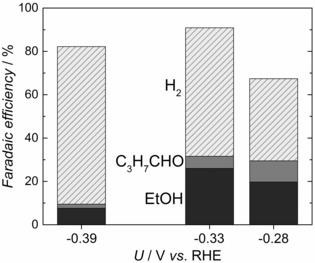
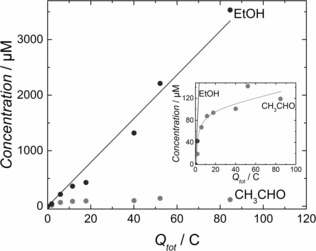
To investigate the possibility that acetaldehyde is an intermediate during CO reduction on OD‐Cu, we tested its hydrogenation by introducing 10 mm CH3CHO in Ar‐saturated 0.1 m KOH. As shown in Figure 2, ethanol is produced with a Faradaic efficiency of ≈30 % at −0.33 V. Significant production of C3H7CHO also occurred. We did not observe this compound during our CO reduction experiments, possibly because of the lower acetaldehyde concentrations. However, we cannot discard the possibility that C3H7CHO is produced in concentrations below the detection limit from CO reduction. For lower added concentrations of acetaldehyde, much less ethanol and butanal were produced, possibly because of poorer mass transport of acetaldehyde to the electrode. This makes measurements at the concentrations observed for CO reduction (≈120 μm) difficult. Interestingly, performing the same experiment with acetate did not yield any detectable CO reduction products; this suggests that acetate cannot be reduced further when it is formed at the electrode. Figure 3 shows the concentration of acetaldehyde and ethanol from CO reduction at −0.33 V as a function of total electrolysis charge. Whereas ethanol concentration scales linearly with charge, the acetaldehyde concentration quickly saturates at ≈120 μm. We hypothesize that this is caused by the formation of aqueous acetaldehyde and its further reduction to ethanol reaching equilibrium.
Figure 2.

Faradaic efficiency for CH3CHO hydrogenation at different potentials. Measurements were carried out in Ar saturated (1.1 bar) 0.1 m KOH with 10 mm of acetaldehyde. Note: The charge not accounted for is attributed to higher carbon oxygenates that have not been quantified.
Figure 3.

Acetaldehyde and ethanol concentration from CO reduction at −0.33 V showed as a function of the charge involved in each measurement. Measurements were carried out in 0.1 m KOH.
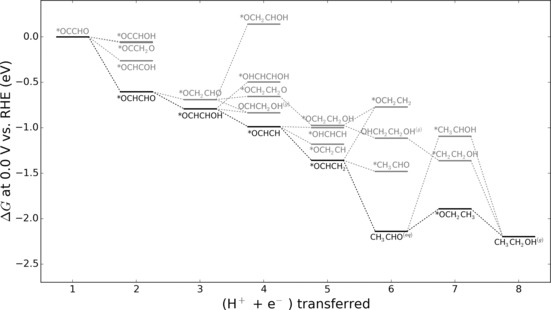
In Figure 4, we provide the results of density functional theory (DFT) calculations of intermediates proceeding from adsorbed *OCCHO, a likely intermediate in the C−C coupling pathway.17, 20 The most favorable thermodynamic pathway towards ethanol on Cu(211), highlighted in black proceeds directly through this intermediate. Using other copper facets could alter the reactivity of the surface, but is unlikely to change the overall shape of the reaction pathway.12 Aqueous acetaldehyde can be seen as an intermediate, as previously reported.21 The step following the formation of CH3CHO, a proton‐coupled electron transfer producing adsorbed *OCH2CH3, is uphill at 0.0 V vs. RHE. However, it is downhill at −0.3 V, and will be even more exergonic with increasing concentrations of CH3CHO. The lower free energy found for aqueous acetaldehyde compared to its adsorbed counterpart (≈0.7 eV) yields a thermodynamic sink, supporting the experimental observation that it is released from the electrode and is present in the electrolyte in detectable concentrations.
Figure 4.

Free energy diagram for reduction of C−C coupled intermediate *OCCHO on Cu(211). The free energy for CH3CH2OH(g) was calculated at 1 bar and the free energy of CH3CHO(aq) was calculated at a concentration of 100 μm. The steps marked with black represent the thermodynamically most favorable pathway. The gray represent other potential intermediates of higher energy.
Typically, NMR spectroscopy is used for detection of liquid products.3, 14, 22 Liquid state NMR spectroscopy requires analytes to be dissolved in a liquid phase for adequate detection. Alternative techniques can overcome this limitation. For instance, HS‐GC heats up the liquid samples, in this case to 70 °C, and relies on the volatility of compounds for identification.22 This is particularly useful for products that evaporate readily, or that decompose into such compounds upon heating. Acetaldehyde has a boiling point of 20.9 °C under standard conditions.23 However, no trace of acetaldehyde was observed in the gas phase, which might be due to deviations from standard conditions and low concentrations. In Figure 5, a typical sample from CO reduction at −0.33 V is compared with two different solutions containing the same liquid products as the sample, analyzed with HS‐GC‐FID, HS‐GC‐MS, and NMR spectroscopy. For the two GC techniques, acetaldehyde can be clearly identified, both for the sample and the two prepared solutions. HS‐GC‐MS enables positive identification of acetaldehyde at mass 44. In contrast, acetaldehyde only appears in NMR through its diol form in the solution made from 40 % acetaldehyde, observed as a doublet at ≈1.25 ppm. Neither the solution made from a 100 % acetaldehyde precursor, nor the CO reduction sample shows any major signals that could be attributed to this compound, implying that routine NMR spectroscopy is not a reliable technique to identify acetaldehyde under basic conditions.
Figure 5.

Liquid product analysis for a representative CO reduction sample from electrolysis at −0.33 V (black) as well as two solutions containing 250 μm CH3CHO, EtOH and AcO− in 0.1 m KOH (gray), one made from a 40 %, and the other from a 100 % acetaldehyde precursor. (a) HS‐GC‐FID chromatograms. (b) HS‐GC‐MS mass spectrum obtained from the acetaldehyde peak (at ≈1.5 min) of a CO reduction measurement, compared to a database reference mass spectrum for acetaldehyde. Inset: HS‐GC‐MS chromatograms (c) NMR spectra.
The organic chemistry of acetaldehyde, particularly in alkaline solutions, is complex.24 Acetaldehyde occurs in various hydrated, aggregated, and polymerized states in solution (see section S.3 for further discussion). We hypothesize that the main difficulty in detecting acetaldehyde with NMR spectroscopy is polymerization, possibly caused by a high local concentration at the electrode. This could yield insoluble compounds invisible to NMR and/or significant signal broadening. Three key observations support this hypothesis: a) For concentrated solutions in alkaline media, a yellow precipitate can be observed (Supporting Information, Figure S.6 b), which could be attributed to an aggregated or polymerized form. b) Acetaldehyde standards aged in 0.1 m KOH and extensive NMR signal accumulation in high‐field NMR yield spectra consistent with the presence of acetaldehyde and its condensation products formed upon aging (Figure S.5). Since acetaldehyde occurs as a minor steady‐state intermediate (Figure 3), the detection of acetaldehyde by more routine NMR methods, on the other hand, remains difficult. c) Upon acidification of the 0.1 m KOH solution from pH 13 to pH 1, visible but broadened signals appear in the NMR spectra (Figure S.6 a). We attribute their presence to ethyl acetate, an acetaldehyde dimer, which could result from an acid‐catalyzed depolymerization process. Acetaldehyde chemistry is discussed further in section S.3, but is beyond the scope of this study.
The appearance of an additional product should, in principle, be observable through the Faradaic efficiency not reaching 100 %. However, the uncertainty in the analysis techniques could lead to minor products being overlooked.
In summary, we present evidence that acetaldehyde is a product and key intermediate in the electroreduction of carbon monoxide on oxide‐derived copper. Detection of acetaldehyde in alkaline solutions using NMR spectroscopy is challenging, and thus, identification is performed using HS‐GC. Our results highlight the importance of using complementary methods for product detection from electrochemical reactions. Identification of acetaldehyde represents a first step in elucidating the CO reduction mechanism on OD‐Cu electrodes and paves the way for the design of improved catalysts.
Experimental Section
Rectangular electrodes of 5×10 mm were cut and electropolished. They were annealed in air at 500 °C for an hour and cooled to room temperature, before being mounted in the electrochemical cell where the Cu2O surface layer was reduced chronopotentiometrically at 7 mA cm−2. Electrode capacitance measured by cyclic voltammetry was used to determine the roughness of the electrodes.
The working electrode (WE) and counter electrode (CE) compartments were separated by a Nafion 117 membrane and the WE and reference electrode (RE) compartments were separated by an ion‐conducting ceramic frit. A gold mesh was used as CE, while an Hg/HgSO4 electrode was used as reference, calibrated to the reversible hydrogen electrode (RHE) in the same electrolyte. CO reduction was carried out potentiostatically at the desired potential. 85 % of the uncompensated ohmic drop was corrected for in the software, as measured through electrochemical impedance spectroscopy.25 If significant, the remaining 15 % was corrected for after the experiment. The ohmic drop typically ranged from 20 to 50 Ω, depending on the WE position relative to the RE.
During measurements, CO reduction products accumulate in the electrolyte and headspace of the WE compartment. The gaseous product composition was analyzed by a GC mounted with a flame ionization detector (FID) and a thermal conductivity detector (TCD). Liquid products were analyzed through HS‐GC and NMR spectroscopy.
DFT calculations were performed on a 4×3×3‐atom periodic computational cell corresponding to the (211) facet of fcc Cu, with a 4‐atom long step edge. The (211) facet was chosen based on the presence of step edge, four‐fold, and three‐fold terrace sites that may occur on OD‐Cu. Electronic energies were determined with the Dacapo DFT calculator as implemented in the open‐source Atomic Simulation Environment (ASE),26 and the revised Perdew–Burke–Ernzerhof (RPBE) exchange correlation functional was chosen for its relative accuracy in describing chemisorption energies.27 The geometries of multiple configurations of each adsorbate corresponding to placement on each available binding site were optimized into local energy minima, and the most stable configuration selected for the energies presented with a free energy correction corresponding to vibrational contributions determined in the harmonic approximation. Static solvation corrections based on the presence of aldehyde and hydroxyl groups on adsorbates similar to previous work12, 28 are also included.
More details can be found in the Supporting Information.
Supporting information
As a service to our authors and readers, this journal provides supporting information supplied by the authors. Such materials are peer reviewed and may be re‐organized for online delivery, but are not copy‐edited or typeset. Technical support issues arising from supporting information (other than missing files) should be addressed to the authors.
Supplementary
Acknowledgements
We acknowledge funding from Danish Council for Strategic Research's NACORR project. I.E.L. Stephens is the recipient of the Peabody Visiting Associate Professorship from the Department of Mechanical Engineering at MIT. We also acknowledge the assistance of Casper Hoeck and Charlotte H. Gotfredsen in setting up and carrying out NMR spectroscopy measurements, as well as Zarko Jovanov and Ana Sofia Varela in setting up the HS‐GC equipment.
E. Bertheussen, A. Verdaguer-Casadevall, D. Ravasio, J. H. Montoya, D. B. Trimarco, C. Roy, S. Meier, J. Wendland, J. K. Nørskov, I. E. L. Stephens, I. Chorkendorff, Angew. Chem. Int. Ed. 2016, 55, 1450.
Contributor Information
Prof. Dr. Ifan E. L. Stephens, Email: ifan@fysik.dtu.dk.
Prof. Dr. Ib Chorkendorff, Email: ibchork@fysik.dtu.dk.
References
- 1. Goeppert A., Czaun M., Jones J. P., Surya Prakash G. K., Olah G. A., Chem. Soc. Rev. 2014, 43, 7995–8048. [DOI] [PubMed] [Google Scholar]
- 2. Hori Y., in Mod. Asp. Electrochem. (Eds.: C. G. Vayenas, R. E. White, M. E. Gamboa-Aldeco), Springer, Berlin, 2008, pp. 89–189. [Google Scholar]
- 3. Kuhl K. P., Cave E. R., Abram D. N., Jaramillo T. F., Energy Environ. Sci. 2012, 5, 7050–7059. [Google Scholar]
- 4. Schouten K. J. P., Kwon Y., van der Ham C. J. M., Qin Z., Koper M. T. M., Chem. Sci. 2011, 2, 1902–1909. [Google Scholar]
- 5. Wuttig A., Surendranath Y., ACS Catal. 2015, 5, 4479–4484. [Google Scholar]
- 6. Tang W., Peterson A. A., Varela A. S., Jovanov Z. P., Bech L., Durand W. J., Dahl S., Nørskov J. K., Chorkendorff I., Phys. Chem. Chem. Phys. 2012, 14, 76–81. [DOI] [PubMed] [Google Scholar]
- 7. Chen Y., Li C. W., Kanan M. W., J. Am. Chem. Soc. 2012, 134, 19969–19972. [DOI] [PubMed] [Google Scholar]
- 8. Medina-Ramos J., Dimeglio J. L., Rosenthal J., J. Am. Chem. Soc. 2014, 136, 8361–8367. [DOI] [PMC free article] [PubMed] [Google Scholar]
- 9. Zhu W., Zhang Y. J., Zhang H., Lv H., Li Q., Michalsky R., Peterson A. A., Sun S., J. Am. Chem. Soc. 2014, 136, 16132–16135. [DOI] [PubMed] [Google Scholar]
- 10. Asadi M., Kumar B., Behranginia A., Rosen B. A., Baskin A., Repnin N., Pisasale D., Phillips P., Zhu W., Haasch R., et al., Nat. Commun. 2014, 5, 4470. [DOI] [PubMed] [Google Scholar]
- 11. Varela A. S., Sahraie N. R., Steinberg J., Ju W., Oh H. S., Strasser P., Angew. Chem. Int. Ed. 2015, 54, 10758–10762; [DOI] [PubMed] [Google Scholar]; Angew. Chem. 2015, 127, 10908–10912. [Google Scholar]
- 12. Peterson A. A., Nørskov J. K., J. Phys. Chem. Lett. 2012, 3, 251–258. [Google Scholar]
- 13. Li C. W., Kanan M. W., J. Am. Chem. Soc. 2012, 134, 7231–7234. [DOI] [PubMed] [Google Scholar]
- 14. Li C. W., Ciston J., Kanan M. W., Nature 2014, 508, 504–507. [DOI] [PubMed] [Google Scholar]
- 15. Verdaguer-Casadevall A., Li C. W., Johansson T. P., Scott S. B., McKeown J. T., Kumar M., Stephens I. E. L., Kanan M. W., Chorkendorff I., J. Am. Chem. Soc. 2015, 137, 9808–9811. [DOI] [PubMed] [Google Scholar]
- 16. Hori Y., Takahashi R., Yoshinami Y., Murata A., J. Phys. Chem. B 1997, 101, 7075–7081. [Google Scholar]
- 17. Montoya J. H., Shi C., Chan K., Nørskov J. K., J. Phys. Chem. Lett. 2015, 6, 2032–2037. [DOI] [PubMed] [Google Scholar]
- 18. Hori Y., Takahashi I., Koga O., Hoshi N., J. Phys. Chem. B 2002, 106, 15–17. [Google Scholar]
- 19. Heinen M., Jusys Z., Chen Y. X., Behm R. J., J. Phys. Chem. C 2010, 114, 9850–9864. [Google Scholar]
- 20. Nørskov J. K., Peterson A. A., Montoya J. H., ChemCatChem 2013, 5, 737–742. [Google Scholar]
- 21. Calle-Vallejo F., Koper M. T. M., Angew. Chem. Int. Ed. 2013, 52, 7282–7285; [DOI] [PubMed] [Google Scholar]; Angew. Chem. 2013, 125, 7423–7426. [Google Scholar]
- 22. Hong J., Zhang W., Ren J., Xu R., Anal. Methods 2013, 5, 1086–1097. [Google Scholar]
- 23. Harrison R. D., Revised Nuffield Advanced Science Book of Data, Longman, Harlow, 1984. [Google Scholar]
- 24. Kwon Y., Lai S. C. S., Rodriguez P., Koper M. T. M., J. Am. Chem. Soc. 2011, 133, 6914–6917. [DOI] [PubMed] [Google Scholar]
- 25. Čolić V., Bandarenka A. S., Tymoczko J., Maljusch A., Ganassin A., Schuhmann W., ChemElectroChem 2015, 2, 143–149. [Google Scholar]
- 26. Bahn S. R., Jacobsen K. W., Comput. Sci. Eng. 2002, 4, 56–66. [Google Scholar]
- 27. Hammer B., Hansen L., Nørskov J., Phys. Rev. B 1999, 59, 7413–7421. [Google Scholar]
- 28. Peterson A. A., Abild-Pedersen F., Studt F., Rossmeisl J., Nørskov J. K., Energy Environ. Sci. 2010, 3, 1311–1315. [Google Scholar]
Associated Data
This section collects any data citations, data availability statements, or supplementary materials included in this article.
Supplementary Materials
As a service to our authors and readers, this journal provides supporting information supplied by the authors. Such materials are peer reviewed and may be re‐organized for online delivery, but are not copy‐edited or typeset. Technical support issues arising from supporting information (other than missing files) should be addressed to the authors.
Supplementary


