

Abstract
Objective
Endogenous acetone production is a by‐product of the fat metabolism process. Because of its small size, acetone appears in exhaled breath. Historically, endogenous acetone has been measured in exhaled breath to monitor ketosis in healthy and diabetic subjects. Recently, breath acetone concentration (BrAce) has been shown to correlate with the rate of fat loss in healthy individuals. In this review, the measurement of breath acetone in healthy subjects is evaluated for its utility in predicting fat loss and its sensitivity to changes in physiologic parameters.
Results
BrAce can range from 1 ppm in healthy non‐dieting subjects to 1,250 ppm in diabetic ketoacidosis. A strong correlation exists between increased BrAce and the rate of fat loss. Multiple metabolic and respiratory factors affect the measurement of BrAce. BrAce is most affected by changes in the following factors (in descending order): dietary macronutrient composition, caloric restriction, exercise, pulmonary factors, and other assorted factors that increase fat metabolism or inhibit acetone metabolism. Pulmonary factors affecting acetone exchange in the lung should be controlled to optimize the breath sample for measurement.
Conclusions
When biologic factors are controlled, BrAce measurement provides a non‐invasive tool for monitoring the rate of fat loss in healthy subjects.
Introduction
Measurements of endogenous acetone in breath have been made for over 50 years. Early studies examined the effect of caloric intake (fasting and calorie restriction diets), dietary macronutrient composition, and exercise on breath acetone 1, 2, 3, 4, 5. While people with and without obesity participated in these investigations, the focus was on the effects of fasting and diabetes. The breath acetone concentration (BrAce) was understood to be a non‐invasive measure of ketosis.
Ketosis describes the elevation of ketone bodies in the blood. A range of ketosis levels exists. Healthy individuals on standard mixed diets (i.e., moderate to high carbohydrate content) have a basal ketosis while individuals with uncontrolled diabetes have extremely elevated ketosis, ketoacidosis. In all cases, ketosis describes the quantity of circulating ketone bodies. Increases in ketosis correspond to increases in ketone bodies.
Ketone bodies are produced as a by‐product of the fat metabolism process. When the liver metabolizes circulating free fatty acids, these acids are transformed into acetyl‐CoA, a molecule used in the production of energy. Depending on the glucose level, acetyl‐CoA can be diverted to produce acetoacetate, the first of three ketone bodies. From acetoacetate, two other ketone bodies, β‐hydroxybutyrate (BOHB) and acetone, are produced by enzymatic degradation or spontaneous decarboxylation, respectively 6, 7. All three ketone bodies circulate in the bloodstream. Acetone, because of its small size, diffuses into the air spaces of the lung and appears in the exhaled breath.
Endogenous acetone production is closely related to fat metabolism through the intermediary acetoacetate. Efforts over the past 20 years have better elucidated the relationship between BrAce and fat loss. One overarching goal was to develop a tool to quickly quantify the rate of fat loss. This measurement could motivate weight loss participants whose daily weight fluctuations result primarily from variations in water content 8.
The goal of this article is to review the relationship between BrAce and the rate of fat loss. A cornerstone of this relationship, the correlation between breath acetone and BOHB, is described. The healthy ranges of BrAce corresponding to common ketotic and physiologic states are summarized. Multiple dietary, metabolic, and respiratory factors affecting BrAce are identified and their effects quantified, when possible. By understanding the physiologic conditions and factors affecting BrAce in healthy subjects, BrAce measurement and relationship to fat loss can be optimized.
Breath Acetone Spectrum
Acetone has a small molecular weight which allows easy movement from blood, into lung air and into exhaled breath 9. As a by‐product of fat metabolism, acetone is present in blood and breath of all humans. BrAce can be increased via a variety of factors including diet and exercise.
A literature review determined ranges of endogenous acetone for multiple conditions in blood or breath. Blood concentrations were converted to breath using the following relationship 10. Calculated values may overestimate measured breath values due to airway gas exchange.
Variable definitions are provided in Table 1. Acetone ranges for multiple conditions are presented in Figure 1. In normal healthy individuals, BrAce can range from 0.5 to 2.0 ppm 9, 12. Adults on ketogenic diets (e.g., high fat with low carbohydrate) can have elevated levels of up to ∼40 ppm 2, 13, 14, 20. Children with epilepsy can be treated with ketogenic diets to reduce the incidence of seizures. In these children, studies have reported BrAce as high as 360 ppm 15, 16. Fasting can cause the body to primarily utilize fats for energy production. This change in energy substrate can elevate BrAce up to ∼170 ppm 1, 17. Poorly controlled diabetes can cause ketoacidosis which can increase BrAce up to 1,250 ppm 18, 19.
Table 1.
Description of abbreviations and variables
| Variable | Unit | Description |
|---|---|---|
| BOHB | mM | β‐hydroxybutyrate |
| BrAce | ppm, nM | Breath acetone concentration |
| Ca | ppm | Acetone concentration in air |
| Cb | μg l−1 | Acetone concentration in blood |
| λb:a | Blood to air partition coefficient for acetone, non‐dimensional (=341, Ref 11 | |
| MW | g mol−1 | Molecular weight of acetone (=58.08) |
| VM | l mol−1 | Molar volume of air at 37°C and 1 atm (=25.4) |
Figure 1.
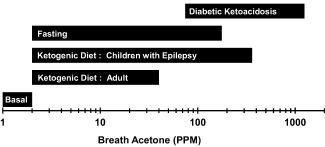
Breath acetone spectrum. The range of breath acetone concentration (BrAce) for a variety of physiologic states and ketosis ranges 1, 2, 9, 12, 13, 14, 15, 16, 17, 18, 19.
Breath Acetone and BOHB
BrAce can be related to ketosis levels via blood BOHB. Multiple studies have reported strong correlations between BrAce and BOHB with an average R 2 = 0.77 [Range: 0.54 to 0.94] 5, 16, 17, 21, 22, 23. To demonstrate this relationship, blood‐breath data from multiple studies were captured and plotted (Figure 2) 5, 17, 21, 22, 23. The data was fit with an exponential relationship 21. Although data was taken from multiple sources and experimental conditions, the non‐linear relationship between BrAce and BOHB appears to correlate well. BrAce is most sensitive to changes in BOHB between 0 and 1 mM. Note that Figure 2 is demonstrative; readers are referred to the primary references for further details.
Figure 2.
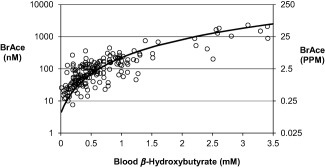
Breath acetone concentration (BrAce) has a non‐linear relationship with blood β‐hydroxybutyrate. Experimental data (open circles) were captured from multiple studies 5, 17, 21, 22, 23 and fit (black line) using an exponential relationship 21. 1 ppm = 39.7 nM (molar basis).
Breath Acetone and Fat Loss
As a by‐product of fat metabolism, acetone in blood and breath is known to increase with fasting and caloric restriction as stored fat is mobilized to meet energy demands 1, 4, 8, 24, 25. This relationship has been known for more than 50 years. In the last 25 years, studies that better quantified the relationship between BrAce and the rate of fat loss have been performed. The review below focuses on studies correlating and quantifying the relationship between BrAce and fat loss.
An initial report mentioned that maintaining an average BrAce of 500 nM (12.6 ppm) should result in a weight loss of 227 g (0.5 lbs) per week 26. This report appeared to be the first to attempt to quantify the relationship between BrAce and fat loss. However, it was difficult to discern how the authors arrived at this conclusion because the methodological details and resultant data supporting this statement were not provided.
More than a decade later, Kundu et al. performed two pilot studies examining BrAce and fat loss during caloric restriction 27. In both studies, volunteers were placed on a 1,200 kcal, low‐fat (≤40 g), low‐carbohydrate (≤40 g) diet. The number of calories consumed was less than the basal energy requirements. BrAce and body weight were measured daily before breakfast. In the first study, 170 healthy volunteers, 0 to 100 lbs overweight, followed diet and measurement protocols for 2 weeks. In the first week, all subjects lost between 5 and 10 lbs of body weight with more than 50% due to water loss. During the second week, weight loss from water decreased. Fat loss correlated and increased with BrAce. For example, 1 lb week−1 of fat loss corresponded to BrAce = 67 nM (1.7 ppm). Every ∼40% increase in BrAce (e.g., from 67 to 94 nM) corresponded to an additional ∼0.5 lb of weekly fat loss. In the second study, 30 volunteers, 40 to 100 lbs overweight, followed the same protocol for 4 weeks. Of the initial weight loss, a significant fraction was water loss; the duration of its impact depended on initial obesity. From the second week forward, BrAce was directly proportional to fat loss.
Following these studies, Kundu et al. performed a confirmative study. BrAce was measured in humans (n = 58) on a 30 day calorie restriction diet 8. Initial body weights were 10‐30% over the ideal weight (a body mass index, BMI, range of 27.5‐32.5 with ideal BMI = 25 kg m−2). The composition of the diet was high carbohydrate, moderate protein, and low fat. Breath samples, collected upon awakening, sampled the first 380ml of exhaled breath after a 5 s breath hold. On average, BrAce increased over the first 8 days and reached a relative stable plateau after day 7. Fat loss (g day−1) increased with the average BrAce after day 7. Fat loss and BrAce were greater for experimental subjects than controls. Maintaining a BrAce= 85 nM (∼2.1 ppm) corresponded to a fat loss of 227 g week−1 (0.5 lbs week−1).
More recently, the effect of diet and exercise on BrAce and weight loss was studied over 4 weeks 24 in 12 subjects. After a 1‐week baseline, subjects reduced caloric intake by 500 kcal day−1 during week 2, added 200 kcal day−1 of exercise during week 3, and returned to baseline living during week 4. The subtraction of 500 kcal/d of food doubled BrAce over baseline (1.1 ppm vs. 0.5 ppm). With the reduced diet and added exercise, BrAce tripled relative to baseline (1.6 ppm vs. 0.5 ppm). Increased BrAce correlated to weight loss (R 2 = 0.77) and trended with increased fat loss (R 2 = 0.32).
Triffoni‐Melo et al. 28 studied the effects of a 1‐week, high‐fat, low‐carbohydrate, and protein (HFLC) diet in female subjects with severe obesity [BMI > 40 kg m−2] who were preparing for bariatric surgery. The HFLC group's ratio of fat to carbohydrate‐plus‐protein was three times that of the controls, 0.45 versus 0.13. Both groups were on a calorie restriction diet consisting of 1,200 kcal day−1. At the end of the study, the experimental group lost more weight (4.4 vs. 2.6 kg) and had three times greater blood acetone levels (7.0 vs. 3.0 mg l−1) than the controls. These blood values should correspond to BrAce = 9.0 and 3.9 ppm, respectively.
Ross 25 described a patient who after oral surgery had his mouth “wired shut.” The patient consumed a liquid diet during the weeks following surgery. At 3 weeks post‐surgery, BrAce was almost four‐fold greater than the baseline value (∼0.5 ppm). During this time, the patient lost 18 lbs of body weight most likely due to caloric restriction from the imposed liquid diet. The proportion of this weight loss resulting from fat loss was not measured.
Toyooka et al. 29 measured BrAce in five subjects who controlled their caloric intake and performed light exercise each day. These subjects were all Japanese with an average BMI = 29.2 kg m−2 [range of 24.2‐39.4], and maintained this diet for 14 days. Dietary calories were equal to or slightly greater than the basal metabolic requirement. Breath and body composition was measured prior to breakfast. End‐exhaled breath was captured for acetone analysis. Over the second week, subjects lost an average of 60 g day−1 of fat (∼1 lb week−1) which corresponded to an average BrAce ∼1.8 ppm. BrAce at the end of the study was inversely proportional to the initial BMI. BrAce increased by 4 ppm (∼180 nM) in the lowest initial BMI subject (24 kg m−2) and by 1 ppm (∼40 nM) in the greatest initial BMI subject (39 kg m−2).
In Toyooka et al. 29, a second group only performed light exercise each day. BrAce did not increase but body fat decreased over the 2‐week study. Fat loss for this group was 25‐33% of that observed in subjects with a combined calorie control and light exercise.
Factors Affecting BrAce
BrAce can be affected on hourly and daily time scales by a variety of physiologic factors including diet, obesity, and exercise; chemical factors; and environmental factors. The physiology of acetone exchange in the lung affects BrAce in the breath sample. Understanding these factors and their impact on an individual's BrAce will improve the utility of BrAce for use in monitoring fat loss.
Dietary step‐change and the time course of BrAce
A dietary step‐change, such as starting a calorie restriction diet, can increase fat metabolism which causes BrAce to increase. The time needed for BrAce to reach a new steady state depends on the dietary change. After initiating a calorie restriction diet, BrAce rises for 3‐8 days (in subjects that were losing fat) before achieving a new steady state 1, 8, 24, 29, 30. A similar time course appears to apply for fasting subjects 1, 17. One study on fasting noted that the rate of BrAce increase appeared to have two phases. BrAce increases slowly over the first 2‐3 days of starvation. With continued fasting, BrAce rises rapidly, an indication (hypothesized) that liver glycogen is exhausted 1. The time and path BrAce takes to achieve a new steady state is similar to the onset of fasting ketosis which balances changing rates of glycogenolysis, gluconeogenesis, lipolysis, and ketogenesis 31, 32.
While it takes several days for acetone levels to increase, BrAce returned to baseline within hours of eating a high‐calorie meal. This was true in fasting subjects. After a 12 h, overnight fast, a protein rich meal caused BrAce to return to pre‐fasting levels within 4‐5 h 33. In a subject fasting for 66 h, a large meal caused BrAce to drop 16% within 3 h and 66% within 5 h after the meal 34. The termination of a prolonged fast with a heavy meal caused BrAce to return to baseline within 16 h 4.
For individuals on a calorie restriction diet, eating a small high‐calorie, high‐carbohydrate snack or meal can cause BrAce to drop within hours. In a pilot study 27, subjects who were on a 1,000 kcal diet for 2 weeks or on a 12 h fast terminated their diet regimen by consuming a high‐calorie snack or meal. An 8 oz high‐calorie, high‐carbohydrate snack drink caused BrAce to drop 20% in 1 h and 30% within 3 h after the snack. An 800 kcal high‐carbohydrate meal caused a ∼40% decrease in BrAce over 5 h 27. BrAce returned to pre‐diet levels within 24‐36 h 1, 27.
Hourly variations in BrAce
During overnight sleep, BrAce can increase more than twofold because food intake ceases 35. The effect of sleep deprivation on this relationship is unknown 36, 37. During the day, BrAce appears to remain relatively stable in subjects provided their ingested macronutrient composition does not dramatically change during the day 5, 16, 38. Dietary macronutrient composition (i.e., fat, carbohydrate, or protein) is likely to affect the magnitude and time course of BrAce in the postprandial state. However, hourly changes in BrAce following a mixed composition meal have not been reported. Initial BrAce data (n = 1) and blood ketone data (n = 8) suggest that BrAce may decrease and then recover within a few hours following the consumption of a meal 4, 39. A step‐change in dietary composition over 12 h can change BrAce. Subjects, who habitually ate a mixed composition diet, ate a series of a high‐fat meals (>80% fat) over the course of 12 h. BrAce increased fourfold over those hours 2, 21, 22. In addition to diet, exercise will likely affect the intraday variations in BrAce (see below). To monitor long term (e.g., day‐to‐day) changes in BrAce, measurements soon after consumption of a meal or completion of exercise should be avoided.
Obesity
Obesity affects both BrAce and fat loss. BrAce appears to be inversely proportional to BMI 4, 29, 40, 41 causing subjects with obesity to have lower BrAce; however, some disagreement remains 42. If true, caloric restriction may result in smaller BrAce increases for overweight subjects relative to thinner subjects. Additionally, individuals with obesity become ketotic at slower rates, experience a lower rate of fat loss, and exhale lower BrAce when starting a calorie restriction diet 27, 29, 40, 43. It is speculated that as the weight of these individuals decreases, BrAce and the rate of fat loss will increase.
Exercise
Just as a reduced calorie diet can increase BrAce, exercise can increase BrAce levels. In multiple studies, BrAce was twofold greater at the end than the beginning of exercise 44, 45, 46. BrAce is expected to increase during exercise. In some subjects, BrAce fell at the onset of exercise and then increased with continued exercise 45. During graded exercise tests, BrAce increased (∼twofold) with exercise intensity 44, 46, 47, maximum BrAce corresponded to the onset of the lactate threshold 48, and the fat oxidation rate was shown to be logarithmically related to BrAce 44. Additionally, the fat oxidation rate and BrAce were shown to have parallel increases over 2 h of steady treadmill exercise 44.
Exercise can affect day‐to‐day measurements of BrAce. Subjects submitting to caloric restriction and daily exercise had greater daily BrAce than caloric restriction alone 24, 27. In one study, exercise alone (no caloric restriction) increased day‐to‐day BrAce 29.
While few studies have investigated the impact of exercise on BrAce, multiple investigations have shown the effect of exercise on ketosis and fat oxidation. Because BrAce has been shown to correlate with ketosis and fat oxidation 17, 21, 44, it is expected that exercise will impact BrAce in a similar fashion to its effect on ketosis (i.e., BOHB) and fat oxidation. A few of these relationships are reviewed below. Further research will be needed to confirm that these results apply to BrAce.
Changes in exercise intensity affect ketosis, as measured by BOHB levels, and fat oxidation. In one study, subjects exercised (rapid walking) at different intensities (i.e., VO2‐max= 40%, 50%, or 60%) over 2 h 49. During exercise, BOHB increased with exercise duration and intensity. BOHB continued to increase for 30 min post‐exercise regardless of intensity. More than 30 min after exercise, BOHB was observed to increase (VO2 = 60%), remain constant (VO2 = 50%), or decrease (VO2 = 40%) depending on exercise intensity. Fat oxidation increased with exercise intensity and reached a maximum between 40% and 65% of VO2‐max 50, 51. The maximum fat oxidation rate was ∼0.6 g min−1 for overnight fasted subjects eating a standard mixed diet (i.e., moderate to high carbohydrate content). Increasing exercise intensity beyond 65% VO2‐max caused fat oxidation to decrease 50.
Studies showed the initial state of ketosis affected BOHB changes during exercise 52. In subjects on a standard moderate‐ to high‐carbohydrate diet, exercise caused increased BOHB throughout exercise 49. Two groups fasted for 2.5 or 4.5 days, which caused proportionally elevated baseline BOHB levels. Exercise caused BOHB levels to drop during the first 30 min of exercise. With continued exercise, ketone levels rose, exceeding (2.5‐day fasted) or reaching (4.5‐day fasted) their corresponding baseline BOHB levels.
Carbohydrate consumption at the time of exercise can affect fat oxidation and ketosis. Consumption of carbohydrate within the hours preceding exercise significantly suppressed fat oxidation during exercise over a wide range of exercise intensities 50. A high‐carbohydrate snack just prior to exercise appeared to prevent the onset of post‐exercise ketonaemia 53. Ingesting carbohydrate in the minutes after the start of exercise reduced fat oxidation for low‐ to moderate‐intensity exercise but did not appear to impact fat oxidation for high‐intensity exercise 50.
Additional factors
In addition to the primary factors reviewed above, other factors may affect ketonemia, fat oxidation, or BrAce directly. These factors are secondary due to minimal supporting data, smaller impact on BrAce, or smaller duration of effect. While some data exists on changes to BrAce, most available data describes the impact of these factors on fat oxidation, fat mobilization, or ketosis. Changes in these three outcomes may alter BrAce but confirmatory studies are needed.
While multiple substances may increase breath acetone, data was available for a few. Ingesting a large amount of garlic (38 g) increased BrAce 24‐30 h later 54, 55. Increased BrAce correlated with elevated allyl methyl sulfide, a product of garlic metabolism, which may increase BrAce by inhibiting hepatic acetone metabolism 54. Another chemical, disulfiram, an acetaldehyde dehydrogenase inhibitor, blocked acetone metabolism which caused BrAce to increase 10‐ to 15‐fold over baseline values 56, 57.
Caffeine and green tea are considered “fat burners” for their potential to promote fat metabolism 58. Caffeine increases circulating fatty acids and fat oxidation through its effect on the sympathetic nervous system 58, 59. The impact of caffeine on fat metabolism is expected to be small (<20%) and diminish with habitual ingestion 58. Green tea contains large amounts of catechin polyphenols including epigallocatechin‐3‐gallate which appears to promote lipolysis and increase fat oxidation 58, 60, 61. Green tea consumption (>100 mg) can increase fat oxidation both acutely and chronically but its effects can be modulated by caffeine intake 58. In a pilot study, subjects on a calorie restriction diet who consumed excessive coffee or tea had enhanced BrAce 27.
Exposure to high and low ambient temperatures may increase BrAce or cause ketonaemia. After a dry sauna (T ≥ 60C), BrAce increased in overweight subjects on a weight loss diet 34. Exposure to extreme cold environments appeared to increase ketosis 3, 62, 63. Two weeks of exercise in a −40C environment caused large decreases in weight and fat 64, 65. Not all subjects experienced this effect 63.
Breath sample
Measurement of acetone in breath requires both an accurate and reliable measurement device and a well‐controlled breath sample. Many instruments (e.g., mass spectrometers, gas chromatographs, UV or near‐IR light detection, and metal oxide sensors) can measure parts‐per‐million concentrations of acetone in breath under laboratory conditions 1, 9, 66, 67. Like the variety of instruments, a breath sample can be provided via a variety of breathing maneuvers (e.g., tidal breathing, vital capacity exhalation, and rebreathing). However, the chosen breathing maneuver affects BrAce in the breath sample. Additionally, the portion of exhaled air captured (e.g., early or late in exhalation) and human factors affect BrAce.
Multiple factors affect BrAce, primarily, because acetone exchanges predominately in the lung airways and not in the alveoli like oxygen and carbon dioxide 9, 68, 69, 70, 71. Airway gas exchange requires highly blood soluble chemicals, has a temporal and spatial exchange pattern, and is affected by energy exchange in the lung 68, 72. As a result, breath tests involving chemicals that exchange in the airways (e.g., acetone) must be designed and interpreted differently from breath tests of chemicals participating in alveolar exchange.
Human factors such as exhaled air volume, breathing pattern, and breath temperature affect chemical exchange in the lung airways. These factors should be accounted for when sampling, measuring, and interpreting BrAce. During a single exhalation, BrAce increases with exhaled volume. Thus, the more air volume exhaled, the greater the acetone concentration 9. The breathing pattern prior to breath sampling can affect the concentration. It is expected that BrAce will increase with breath holding and decrease with hyperventilation in a manner similar to ethanol 72, 73, 74. Breath temperature causes increases in BrAce 11. These factors impact BrAce differently depending on the breathing maneuver and portion of exhaled air captured.
A tidal breath (typical ∼500 ml; large ∼1,000 ml) is a commonly used breathing maneuver for providing a breath sample. Based on a normal breathing pattern, a tidal breath requires minimal effort, inhalation from and exhalation to functional residual capacity, and 5‐8 s to complete. The maximum BrAce (end‐exhalation) is at most two‐thirds of the blood acetone value (Figure 3) but when captured in a bag, the mixed‐exhaled sample is less than end‐exhaled BrAce. BrAce from tidal breaths can be altered by human factors and typically provides the poorest representation of blood acetone of the maneuvers reviewed. BrAce measurements from tidal breaths are generally repeatable 75.
Figure 3.
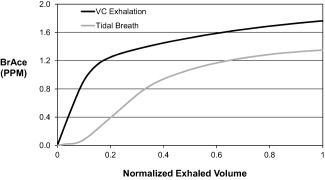
Acetone expirograms for vital capacity (VC, black) and tidal (gray) exhalation. Exhaled volume is ∼10‐fold greater for VC versus tidal exhalation.
The vital capacity maneuver (∼5000 ml), typically requested for alcohol breath testing, requires inhalation to total lung capacity and exhalation for 10 to 25 s against a fixed resistance until subjects are unable to exhale, stopping at residual volume. While this maneuver provides a better representation of blood acetone than the tidal maneuver, end‐exhaled BrAce is ∼85% of that in the blood (Figure 3). This maneuver is more sensitive to human factors because of the greater exhaled volume needed and the need to sample the end‐exhaled air 9, 11, 73, 76. If human factors go unaccounted, the measured BrAce can vary significantly, causing large measurement uncertainty. This maneuver can provide better accuracy than tidal breathing. However, accuracy and repeatability may suffer unless human factors are controlled.
For rebreathing, subjects breathe ∼1,000 ml into and out of a sealed bag over six breath cycles 9, 77, 78. This maneuver typically lasts from 30 to 50 s and, for some subjects, can become uncomfortable because carbon dioxide buildup build‐up throughout the maneuver increases respiratory drive. With rebreathing, air is in close contact with blood for up to 10 times longer than with other breathing maneuvers. Thus, acetone exchange is more complete which minimizes the effects of human factors and causes BrAce to more closely resemble blood acetone. Although rebreathing may be difficult for some subjects, it provides the best accuracy and repeatability of the three maneuvers.
Discussion
Like carbon dioxide, acetone is a by‐product of metabolism. By itself, the presence of acetone in exhaled breath does not indicate underlying disease. Low concentrations (1 to 2 ppm) of breath acetone represent a basal level of ketosis. High levels of breath acetone (75 to 1,250 ppm), associated with diabetic ketoacidosis, represent the other end of the breath acetone spectrum. Between these extremes lie healthy individuals participating in high‐fat, low‐carbohydrate (HFLC) diets, calorie restriction diets, and fasting. Their BrAce can span two orders of magnitude (Figure 1).
Within that intermediate group are individuals on HFLC diets in which the macronutrient composition (i.e., fat, carbohydrate, and protein) is altered relative to the standard mixed diet. In non‐diabetic subjects, the dietary composition appears to have the greatest impact on BrAce relative to the other factors reviewed. This factor has the greatest impact because acetone is produced when fat is metabolized; increased fat metabolism causes increased acetone production. Eating a standard mixed diet will result in a basal ketosis and BrAce of 1 to 2 ppm. Changing to a HFLC diet (carbohydrate intake <50 g day−1) causes the body to shift from using carbohydrates to using fats as its primary energy source. Relying on fats as the primary energy source increases ketosis levels to what has been termed “nutritional ketosis.” Adults in nutritional ketosis have BOHB ranging from 0.5‐3.0 mM 13, 14, 20, which corresponds to a breath acetone range of 4 to 30 ppm (Figure 2). As important, nutritional ketosis resulting from a HFLC diet increases fat oxidation rates as compared to a standard mixed diet because the primary energy substrate is fat 50.
The amount of caloric restriction has the next greatest impact on BrAce. Fasting, the extreme form of caloric restriction, can elevate BrAce, up to 170 ppm over the course of weeks, more than macronutrient changes in adults (Figure 1). However, fasting is not a sustainable lifestyle whereas a HFLC diet can be a lifestyle that leads to long term elevated acetone levels.
Less extreme than fasting is moderate caloric restriction which allows some food intake and appears to cause modest changes in breath acetone. Breath acetone levels rise as stored fat is metabolized to make up the difference between basal energy requirements and caloric intake. Using caloric restriction, multiple studies have shown a correlation between fat loss and increases in breath acetone 8, 24, 25, 27, 29. Specifically, individuals that maintain a breath acetone of 2 ppm should realize a fat loss rate of at least 114‐227 g week−1, based on the scientific literature 8, 27, 29. On the high end, BrAce could reach 8 ppm which could correspond to a fat loss of 1,200 g week−1 8.
While not as powerful as caloric restriction, exercise affects breath acetone near the time of exercise and over the course of days. During exercise, breath acetone can increase by approximately 1 ppm depending on the initial state of ketosis, intensity, and duration 44, 45, 46, 50. In the hours following exercise, breath acetone is expected to increase based on the behavior of BOHB 49; however, confirmatory studies are needed. Acutely, exercise‐induced increases in fat metabolism are expected to drive BrAce 44, 50. Over days, daily exercise can elevate breath acetone because exercise consumes calories of energy. If the daily caloric intake remains constant, exercise increases the number of calories required to maintain current body weight. Thus, exercise can cause calorie restriction which will lead to increases in BrAce as stored fat is metabolized to make‐up the energy deficit 24, 25, 29. It is assumed that the effects of exercise on BOHB would represent the effects of exercise on BrAce since both BOHB and BrAce are closely correlated ketone bodies. However, more investigations are needed to confirm the direct impact of exercise on breath acetone.
A variety of other factors affect breath acetone such as obesity, garlic, disulfiram, caffeine, green tea extract, and ambient temperature. Factors such as garlic, disulfiram, and dry sauna could cause a 1‐4 ppm increase in breath acetone 34, 55, 56, 57. Other factors may have a smaller effect. Additional studies are needed to better understand the importance of these variables relative to dietary macronutrient composition, caloric restriction, and exercise.
BrAce is affected by how the subject provides their breath sample to the measuring device. Because acetone exchanges in the airways of the lung, BrAce is expected to be affected by human factors, including breathing pattern, exhaled volume, and breath temperature. Furthermore, the impact of these factors depends on the chosen breathing maneuver (e.g., tidal breath). To minimize the impact of human factors on BrAce measurement, a standardized breathing maneuver should be developed like that used for pulmonary function and nitric oxide tests 79, 80.
Conclusion
Endogenous breath acetone is correlated with and can be used to understand the rate of fat loss in healthy subjects. Maintaining a 2 ppm BrAce while on a calorie restriction diet should cause a fat loss rate of ∼227 g week−1. Acetone is correlated with fat loss because it and two other ketone bodies are the by‐products of fat metabolism. Breath acetone is strongly correlated with the blood ketone body BOHB. Breath acetone can range in concentration from 1 ppm in healthy non‐dieting subjects to 1,250 ppm in diabetic ketoacidosis. In healthy individuals, breath acetone is affected by multiple factors. Dietary macronutrient composition has the greatest impact followed, in rank order, by caloric restriction, exercise, pulmonary factors, and other factors. Because of its relationship to fat metabolism, a high‐fat, low‐carbohydrate diet will generate more breath acetone than a standard mixed diet. A reduction in consumed calories relative to that needed for weight maintenance can increase breath acetone and fat loss. Exercise can promote caloric restriction. Additionally, exercise can cause breath acetone elevation during a workout. Human respiratory factors can affect the acetone concentration in the breath sample. Other foods (e.g., garlic), drugs (e.g., disulfiram), and environmental conditions can increase breath acetone due to their ability to increase fat metabolism or block acetone metabolism. While the relationship between breath acetone and fat loss is well established, additional research is needed to better understand these factors and advance this area of integrative physiology.
Funding agencies: This work was supported by Medamonitor Corp, Seattle, Washington.
Disclosure: The author consults for Medamonitor Corp.
References
- 1. Freund G. The calorie deficiency hypothesis of ketogenesis tested in man. Metabolism 1965;14:985–990. [DOI] [PubMed] [Google Scholar]
- 2. Freund G, Weinsier RL. Standardized ketosis in man following medium chain triglyceride ingestion. Metabolism 1966;15:980–991. [DOI] [PubMed] [Google Scholar]
- 3. Passmore R. On ketosis. Lancet 1961;1:839–843. [DOI] [PubMed] [Google Scholar]
- 4. Rooth G, Ostenson S. Acetone in alveolar air, and the control of diabetes. Lancet 1966;2:1102–1105. [DOI] [PubMed] [Google Scholar]
- 5. Tassopoulos CN, Barnett D, Fraser TR. Breath‐acetone and blood‐sugar measurements in diabetes. Lancet 1969;1:1282–1286. [DOI] [PubMed] [Google Scholar]
- 6. Kalapos MP. On the mammalian acetone metabolism: from chemistry to clinical implications. Biochim Biophys Acta Gen Subj 2003;1621:122–139. [DOI] [PubMed] [Google Scholar]
- 7. Laffel L. Ketone bodies: a review of physiology, pathophysiology and application of monitoring to diabetes. Diabetes Metab Res Rev 1999;15:412–426. [DOI] [PubMed] [Google Scholar]
- 8. Kundu SK, Bruzek JA, Nair R, Judilla AM. Breath acetone analyzer: diagnostic tool to monitor dietary fat loss. Clin Chem 1993;39:87–92. [PubMed] [Google Scholar]
- 9. Anderson JC, Lamm WJE, Hlastala MP. Measuring airway exchange of endogenous acetone using a single exhalation breathing maneuver. J Appl Physiol 2006;100:880–889. [DOI] [PubMed] [Google Scholar]
- 10. Jones AW. Measuring and reporting the concentration of acetaldehyde in human breath. Alcohol Alcohol 1995;30:271–285. [PubMed] [Google Scholar]
- 11. Wagner PD, Naumann PF, Laravuso RB. Simultaneous measurement of eight foreign gases in blood by gas chromatography. J Appl Physiol 1974;36:600–605. [DOI] [PubMed] [Google Scholar]
- 12. Jones AW. Driving under the influence of isopropanol. J Toxicol Clin Toxicol 1992;30:153–155. [DOI] [PubMed] [Google Scholar]
- 13. Saslow LR, Kim S, Daubenmier JJ, et al. A randomized pilot trial of a moderate carbohydrate diet compared to a very low carbohydrate diet in overweight or obese individuals with type 2 diabetes mellitus or prediabetes. PLoS One 2014;9:e91027. [DOI] [PMC free article] [PubMed] [Google Scholar]
- 14. Phinney SD, Bistrian BR, Wolfe RR, Blackburn GL. The human metabolic response to chronic ketosis without caloric restriction: physical and biochemical adaptation. Metabolism 1983;32:757–768. [DOI] [PubMed] [Google Scholar]
- 15. Musa‐Veloso K, Rarama E, Comeau F, Curtis R, Cunnane S. Epilepsy and the ketogenic diet: assessment of ketosis in children using breath acetone. Pediatr Res 2002;52:443–448. [DOI] [PubMed] [Google Scholar]
- 16. Musa‐Veloso K, Likhodii SS, Rarama E, et al. Breath acetone predicts plasma ketone bodies in children with epilepsy on a ketogenic diet. Nutrition 2006;22:1–8. [DOI] [PubMed] [Google Scholar]
- 17. Rooth G, Carlstrom S. Therapeutic fasting. Acta Med Scand 1970;187:455–463. [DOI] [PubMed] [Google Scholar]
- 18. Jones AE, Summers RL. Detection of isopropyl alcohol in a patient with diabetic ketoacidosis. J Emerg Med 2000;19:165–168. [DOI] [PubMed] [Google Scholar]
- 19. Sulway MJ, Malins JM. Acetone in diabetic ketoacidosis. Lancet 1970;2:736–740. [DOI] [PubMed] [Google Scholar]
- 20. Volek J, Phinney SD. The Art and Science of Low Carbohydrate Performance: A Revolutionary Program to Extend your Physical and Mental Performance Envelope. Beyond Obesity; Miami, FL; 2012. [Google Scholar]
- 21. Musa‐Veloso K, Likhodii SS, Cunnane SC. Breath acetone is a reliable indicator of ketosis in adults consuming ketogenic meals. Am J Clin Nutr 2002;76:65–70. [DOI] [PubMed] [Google Scholar]
- 22. Prabhakar A, Quach A, Wang D, et al. Breath acetone as biomarker for lipid oxidation and early ketone detection. Global J Obes Diabet Metab Syndrome 2014;1:8. [Google Scholar]
- 23. Qiao Y, Gao Z, Liu Y, et al. Breath ketone testing: a new biomarker for diagnosis and therapeutic monitoring of diabetic ketosis. Biomed Res Int 2014;2014:5. [DOI] [PMC free article] [PubMed] [Google Scholar]
- 24. Landini BE, Cranley P, McIntyre J. Diet and exercise effects on breath acetone concentration measured using an enzymatic electrochemical sensor. Obesity Society Annual Scientific Meeting. Obestiy Society: New Orleans, LA, 2007, pp 719. [Google Scholar]
- 25. Ross BM. Changes in oral trace gas concentrations following orthognathic surgery and intermaxillary fixation: a case study using selected ion flow tube mass spectrometry. Int J Oral Sci 2011;3:160–164. [DOI] [PMC free article] [PubMed] [Google Scholar]
- 26. Crofford OB, Mallard RE, Winton RE, Rogers NL, Jackson JC, Keller U. Acetone in breath and blood. Trans Am Clin Climatol Assoc 1977;88:128–139. [PMC free article] [PubMed] [Google Scholar]
- 27. Kundu SK, George RW, March SC, Rutnarak S. Method and device for ketone measurement. United States Patent #5,071,769, 1991.
- 28. Triffoni‐Melo AT, Dick‐de‐Paula I, Portari GV, Jordao AA, Garcia Chiarello P, Diez‐Garcia RW. Short‐term carbohydrate‐restricted diet for weight loss in severely obese women. Obes Surg 2011;21:1194–1202. [DOI] [PubMed] [Google Scholar]
- 29. Toyooka T, Hiyama S, Yamada Y. A prototype portable breath acetone analyzer for monitoring fat loss. J Breath Res 2013;7:036005. [DOI] [PubMed] [Google Scholar]
- 30. Spanel P, Dryahina K, Rejskova A, Chippendale TW, Smith D. Breath acetone concentration: biological variability and the influence of diet. Physiol Meas 2011;32:N23–N31. [DOI] [PubMed] [Google Scholar]
- 31. Cahill GF, Jr. Starvation in man. Clin Endocrinol Metab 1976;5:397–415. [DOI] [PubMed] [Google Scholar]
- 32. Kerndt PR, Naughton JL, Driscoll CE, Loxterkamp DA. Fasting: the history, pathophysiology and complications. West J Med 1982;137:379. [PMC free article] [PubMed] [Google Scholar]
- 33. Smith D, Spanel P, Davies S. Trace gases in breath of healthy volunteers when fasting and after a protein‐calorie meal: a preliminary study. J Appl Physiol 1999;87:1584–1588. [DOI] [PubMed] [Google Scholar]
- 34. Yamamoto H, Uenoyama H, Ueda H, et al. A breath ketone determination method as a noninvasive test for the metabolic indicator in diabetes and obesity. In: Baba S, Kaneko T, editors. Diabetes 1994: Proceedings of the 15th International Diabetes Federation Congress, Kobe, 6‐11 November 1994 Kobe: Elsevier; 1995, pp 617‐621.
- 35. King J, Kupferthaler A, Frauscher B, et al. Measurement of endogenous acetone and isoprene in exhaled breath during sleep. Physiol Meas 2012;33:413–428. [DOI] [PubMed] [Google Scholar]
- 36. St‐Onge MP. The role of sleep duration in the regulation of energy balance: effects on energy intakes and expenditure. J Clin Sleep Med Off Publ Am Acad Sleep Med 2013;9:73–80. [DOI] [PMC free article] [PubMed] [Google Scholar]
- 37. Cizza G, Requena M, Galli G, de Jonge L. Chronic sleep deprivation and seasonality: implications for the obesity epidemic. J Endocrinol Investig 2011;34:793–800. [DOI] [PMC free article] [PubMed] [Google Scholar]
- 38. Sun M, Chen Z, Gong Z, et al. Determination of breath acetone in 149 Type 2 diabetic patients using a ringdown breath‐acetone analyzer. Anal Bioanal Chem (in press). [DOI] [PubMed] [Google Scholar]
- 39. Walsh CO, Ebbeling CB, Swain JF, Markowitz RL, Feldman HA, Ludwig DS. Effects of diet composition on postprandial energy availability during weight loss maintenance. PLoS One 2013;8:e58172. [DOI] [PMC free article] [PubMed] [Google Scholar]
- 40. Kinoyama M, Nitta H, Watanabe A, Ueda H. Acetone and isoprene concentrations in exhaled breath in healthy subjects. J Health Sci 2008;54:471–477. [Google Scholar]
- 41. Reichard GA, Jr , Haff AC, Skutches CL, Paul P, Holroyde CP, Owen OE. Plasma acetone metabolism in the fasting human. J Clin Invest 1979;63:619–626. [DOI] [PMC free article] [PubMed] [Google Scholar]
- 42. Schwarz K, Pizzini A, Arendacka B, et al. Breath acetone‐aspects of normal physiology related to age and gender as determined in a PTR‐MS study. J Breath Res 2009;3:027003. [DOI] [PubMed] [Google Scholar]
- 43. Kekwick A, Pawan GL, Chalmers TM. Resistance to ketosis in obese subjects. Lancet 1959;2:1157–1159. [DOI] [PubMed] [Google Scholar]
- 44. Sasaki H, Ishikawa S, Ueda H, Kimura Y. Response of acetone in expired air during graded and prolonged exercise. Adv Exerc Sports Physiol 2011;16:97–100. [Google Scholar]
- 45. Senthilmohan ST, Milligan DB, McEwan MJ, Freeman CG, Wilson PF. Quantitative analysis of trace gases of breath during exercise using the new SIFT‐MS technique. Redox Rep 2000;5:151–153. [DOI] [PubMed] [Google Scholar]
- 46. Yamai K, Ohkuwa T, Itoh H, Yamazaki Y, Tsuda T. Influence of cycle exercise on acetone in expired air and skin gas. Redox Rep 2009;14:285–289. [DOI] [PubMed] [Google Scholar]
- 47. King J, Kupferthaler A, Unterkofler K, et al. Isoprene and acetone concentration profiles during exercise on an ergometer. J Breath Res 2009;3:027006. [DOI] [PubMed] [Google Scholar]
- 48. Schubert R, Schwoebel H, Mau‐Moeller A, et al. Metabolic monitoring and assessment of anaerobic threshold by means of breath biomarkers. Metabolomics 2012;8:1069–1080. [Google Scholar]
- 49. Balasse EO, Fery F. Ketone body production and disposal: effects of fasting, diabetes, and exercise. Diabet Metab Rev 1989;5:247–270. [DOI] [PubMed] [Google Scholar]
- 50. Achten J, Jeukendrup AE. Optimizing fat oxidation through exercise and diet. Nutrition 2004;20:716–727. [DOI] [PubMed] [Google Scholar]
- 51. Venables MC, Achten J, Jeukendrup AE. Determinants of fat oxidation during exercise in healthy men and women: a cross‐sectional study. J Appl Physiol 2005;98:160–167. [DOI] [PubMed] [Google Scholar]
- 52. Koeslag JH. Post‐exercise ketosis and the hormone response to exercise: a review. Med Sci Sports Exerc 1982;14:327–334. [PubMed] [Google Scholar]
- 53. Koeslag JH, Noakes TD, Sloan AW. Post‐exercise ketosis. J Physiol 1980;301:79–90. [DOI] [PMC free article] [PubMed] [Google Scholar]
- 54. Lawson LD, Wang ZJ. Allicin and allicin‐derived garlic compounds increase breath acetone through allyl methyl sulfide: use in measuring allicin bioavailability. J Agric Food Chem 2005;53:1974–1983. [DOI] [PubMed] [Google Scholar]
- 55. Taucher J, Hansel A, Jordan A, Lindinger W. Analysis of compounds in human breath after ingestion of garlic using proton‐transfer‐reaction mass spectrometry. J Agric Food Chem 1996;44:3778–3782. [Google Scholar]
- 56. Bloor RN, Spanel P, Smith D. Quantification of breath carbon disulphide and acetone following a single dose of disulfiram (Antabuse) using selected ion flow tube mass spectrometry (SIFT‐MS). Addict Biol 2006;11:163–169. [DOI] [PubMed] [Google Scholar]
- 57. DeMaster EG, Nagasawa HT. Disulfiram‐induced acetonemia in the rat and man. Res Commun Chem Pathol Pharmacol 1977;18:361–364. [PubMed] [Google Scholar]
- 58. Jeukendrup AE, Randell R. Fat burners: nutrition supplements that increase fat metabolism. Obes Rev 2011;12:841–851. [DOI] [PubMed] [Google Scholar]
- 59. Jeukendrup AE, Saris WH, Wagenmakers AJ. Fat metabolism during exercise: a review—part III: effects of nutritional interventions. Int J Sports Med 1998;19:371–379. [DOI] [PubMed] [Google Scholar]
- 60. Hodgson AB, Randell RK, Boon N, et al. Metabolic response to green tea extract during rest and moderate‐intensity exercise. J Nutr Biochem 2013;24:325–334. [DOI] [PubMed] [Google Scholar]
- 61. Wang S, Moustaid‐Moussa N, Chen L, et al. Novel insights of dietary polyphenols and obesity. J Nutr Biochem 2014;25:1–18. [DOI] [PMC free article] [PubMed] [Google Scholar]
- 62. Johnson RE, Passmore R Sargent F, II . Multiple factors in experimental human ketosis. Arch Intern Med 1961;107:43–50. [DOI] [PubMed] [Google Scholar]
- 63. Murray SJ, Shephard RJ, Greaves S, Allen C, Radomski M. Effects of cold stress and exercise on fat loss in females. Eur J Appl Physiol Occup Physiol 1986;55:610–618. [DOI] [PubMed] [Google Scholar]
- 64. O'Hara WJ, Allen C, Shephard RJ. Treatment of obesity by exercise in the cold. Can Med Assoc J 1977;117:773–778; 786. [PMC free article] [PubMed] [Google Scholar]
- 65. O'Hara WJ, Allen C, Shephard RJ, Allen G. Fat loss in the cold—a controlled study. J Appl Physiol Respir Environ Exerc Physiol 1979;46:872–877. [DOI] [PubMed] [Google Scholar]
- 66. Righettoni M, Tricoli A, Pratsinis SE. Si: WO3 sensors for highly selective detection of acetone for easy diagnosis of diabetes by breath analysis. Anal Chem 2010;82:3581–3587. [DOI] [PubMed] [Google Scholar]
- 67. Wang CJ, Scherrer ST, Hossain D. Measurements of cavity ringdown spectroscopy of acetone in the ultraviolet and near‐infrared spectral regions: potential for development of a breath analyzer. Appl Spectrosc 2004;58:784–791. [DOI] [PubMed] [Google Scholar]
- 68. Anderson JC, Babb AL, Hlastala MP. Modeling soluble gas exchange in the airways and alveoli. Ann Biomed Eng 2003;31:1402–1422. [DOI] [PubMed] [Google Scholar]
- 69. Kumagai S, Oda H, Matsunaga I, Kosaka H, Akasaka S. Uptake of 10 polar organic solvents during short‐term respiration. Toxicol Sci 1999;48:255–263. [DOI] [PubMed] [Google Scholar]
- 70. Schrikker AC, de Vries WR, Zwart A, Luijendijk SC. Uptake of highly soluble gases in the epithelium of the conducting airways. Pflugers Arch Eur J Physiol 1985;405:389–394. [DOI] [PubMed] [Google Scholar]
- 71. Schrikker AC, de Vries WR, Zwart A, Luijendijk SC. The excretion of highly soluble gases by the lung in man. Pflugers Arch Eur J Physiol 1989;415:214–219. [DOI] [PubMed] [Google Scholar]
- 72. Anderson JC, Hlastala MP. Breath tests and airway gas exchange. Pulm Pharmacol Ther 2007;20:112–117. [DOI] [PubMed] [Google Scholar]
- 73. Jones AW. How breathing technique can influence the results of breath‐alcohol analysis. Med Sci Law 1982;22:275–280. [DOI] [PubMed] [Google Scholar]
- 74. George SC, Babb AL, Hlastala MP. Modeling the concentration of ethanol in the exhaled breath following pretest breathing maneuvers. Ann Biomed Eng 1995;23:48–60. [DOI] [PubMed] [Google Scholar]
- 75. Sukul P, Trefz P, Schubert JK, Miekisch W. Immediate effects of breath holding maneuvers onto composition of exhaled breath. J Breath Res 2014;8:037102. [DOI] [PubMed] [Google Scholar]
- 76. Hlastala MP, Anderson JC. The impact of breathing pattern and lung size on the alcohol breath test. Ann Biomed Eng 2007;35:264–272. [DOI] [PubMed] [Google Scholar]
- 77. Jones AW. Role of rebreathing in determination of the blood‐breath ratio of expired ethanol. J Appl Physiol 1983;55:1237–1241. [DOI] [PubMed] [Google Scholar]
- 78. Ohlsson J, Ralph DD, Mandelkorn MA, Babb AL, Hlastala MP. Accurate measurement of blood alcohol concentration with isothermal rebreathing. J Stud Alc 1990;51:6–13. [DOI] [PubMed] [Google Scholar]
- 79. American Thoracic Society. Standardization of spirometry, 1994 update. Am J Respir Crit Care Med 1995;152:1107–11136. [DOI] [PubMed] [Google Scholar]
- 80. American Thoracic Society . ATS/ERS recommendations for standardized procedures for the online and offline measurement of exhaled lower respiratory nitric oxide and nasal nitric oxide, 2005. Am J Respir Crit Care Med 2005;171:912–930. [DOI] [PubMed] [Google Scholar]