Abstract
Intracranial hypertension due to brain edema and associated astrocyte swelling is a potentially lethal complication of acute liver failure (ALF). Mechanisms of edema formation are not well understood but elevated levels of blood and brain ammonia and its byproduct glutamine have been implicated in this process. We examined mRNA and protein expression of the water channel protein aquaporin-4 (AQP4) in cerebral cortex in a rat model of ALF induced by the hepatotoxin thioacetamide. Rats with ALF showed increased AQP4 protein in the plasma membrane (PM). Total tissue levels of AQP4 protein and mRNA levels were not altered indicating that increased AQP4 is not transcriptionally mediated but is likely due to a conformational change in the protein, i.e. a more stable anchoring of AQP4 to the PM and/or interference with its degradation. By immunohistochemistry there was an increase in AQP4 immunoreactivity in the PM of perivascular astrocytes in ALF. Rats with ALF showed increased levels of α-syntrophin, a protein involved in the anchoring of AQP4 to perivascular astrocytic end-feet. Increased AQP4 and α-syntrophin levels were inhibited by L-histidine, an inhibitor of glutamine transport into mitochondria, suggesting a role for glutamine in the increase of PM levels of AQP4. These results indicate that increased AQP4 PM levels in perivascular astrocytic end-feet are likely critical to the development of brain edema in ALF.
Keywords: α-Syntrophin, Astrocyte swelling, Aquaporin-4, Brain edema, Glutamine, Histidine
INTRODUCTION
Acute liver failure (ALF) is a life-threatening condition with approximately 80% mortality (1, 2). This high mortality is in part due to the development of severe brain edema that leads to increased intracranial pressure and brain herniation. Currently, there is no effective treatment for the brain edema in ALF other than emergency liver transplantation (2–4).
Cytotoxic brain edema, principally due to astrocyte swelling, is the major neuropathological finding in ALF (5–7). Several lines of evidence indicate that elevated blood and brain ammonia levels play major roles in the development of brain edema in ALF (6, 8–12). Moreover, ammonia is known to cause astrocyte swelling in cell culture (13–15), brain slices (16), and in vivo (17–19).
Various studies strongly suggest that the effect of ammonia on astrocyte swelling/cytotoxic edema is mediated by glutamine, a product of ammonia metabolism (20–23). Accordingly, high levels of glutamine in brain and cerebrospinal fluid correlate with the degree of encephalopathy and brain edema in ALF (24–28). It has additionally been proposed that glutamine transport into mitochondria and its subsequent hydrolysis results in high levels of ammonia in this organelle which ultimately results in brain edema (23, 29–31). Consistent with these observations, L-histidine, an inhibitor of mitochondrial glutamine transport, was recently shown to block the brain edema in a rat model of ALF (32).
While mechanisms by which ammonia/glutamine lead to astrocyte swelling are not completely clear, ALF ultimately results in altered ion homeostasis leading to an extra- intracellular osmolar imbalance (33). Restoration of osmotic balance is accompanied by the entry of water into cells, a process accomplished by the water channels aquaporins (AQPs) (34). Among several aquaporins, AQP4 has been shown to be particularly enriched in brain, especially in astrocytes (35). However, such restoration of osmotic imbalance by AQP4 contributes to the development of brain edema in various neurological conditions, including ischemic stroke, trauma and neoplasms (36–39). Moreover, mice deficient in brain AQP4 are resistant to the development of brain edema in ischemic stroke (40). Conversely, mice that over-express AQP4 in astrocytes show accelerated development of brain edema under hypo-osmotic conditions (41).
We previously documented that treatment of cultured astrocytes with ammonia resulted in increased levels of AQP4 in a time-dependent manner, and that this increase correlated with the degree of cell swelling (42). These studies strongly suggested a role of AQP4 in ammonia-induced astrocyte swelling but this potential involvement has not been investigated in vivo. Here, we examined AQP4 protein and mRNA levels and its immunohistochemical localization in brain in experimental ALF. We also examined whether silencing the AQP4 gene by siRNA in cultured astrocytes results in a diminution of cell swelling by ammonia, the principal neurotoxin implicated in the brain edema of ALF.
MATERIALS AND METHODS
Induction of ALF
ALF was induced by a single daily i.p. injection of the hepatotoxin thioacetamide (TAA; 300 mg/kg) to Fisher 344 rats (200–250 gm, Charles River Laboratories, MA) for 24, 48 and 72 hours, as previously described (32, 43). Rats were killed 24 hours after the last injection, except for the 72-hour group, which was killed 4 hours later (76 hours). To prevent hypoglycemia, rats were given 12.5 ml/kg of isotonic solution containing 5% dextrose and 0.45% saline with 20 mEq/l of potassium chloride s.c. every 12 hours, as described earlier (44). Normal controls received saline (vehicle used for TAA). Rats treated with TAA were clinically monitored daily, and stages of encephalopathy were graded according to the criteria of Gammal et al (45) as follows: Grade I: generalized reduction in spontaneous activity; Grade II: mild ataxia; Grade III: lack of spontaneous movement but with intact righting reflexes; Grade IV: loss of righting reflex but with an intact pain reflex (as determined by the reaction to tail pinch); Grade V: coma (unresponsive to sensory stimuli) and loss of corneal reflexes. This model has been used for more than 25 years and shares morphological and clinical abnormalities that are similar to those in humans (43–48). Additionally, the TAA model of ALF does not result in a breakdown of the blood-brain barrier as assessed by the Evans blue extravasation method (unpublished observations).
Animals were killed by decapitation and cerebral cortices were rapidly dissected and frozen at −80°C for subsequent biochemical and Western blot studies. All experimental procedures followed guidelines established by National Institute of Health Guide for the Care and Use of Laboratory animals and were approved by the Institutional Animal Care and Use Committee (IACUC).
Preparation of Cerebral Cortex Lysates
Cell lysates from frozen cerebral cortex were prepared by homogenizing the tissue in lysis buffer containing 50 mM Tris-HCl (pH 7.4), 150 mM NaCl, 1 mM sodium orthovanadate, 1 mM sodium fluoride, 10% glycerol and 1% Non-iodet P40. Homogenates were kept on ice for 30 minutes and centrifuged at 10,000 g for 20 minutes; the pellet was discarded and the supernatant was saved for immunoblotting.
Preparation of Plasma Membranes from Cerebral Cortex
Plasma membrane (PM) enriched fractions were isolated following the method of Marples et al (49), except that high speed centrifugation (200,000 g) was omitted. In brief, cortical tissue was homogenized in 0.32 M sucrose-EDTA buffer containing a protease inhibitor cocktail (PIC, Roche Diagnostics) and then centrifuged at 3,000 g for 5 minutes; the supernatant was frozen at −80°C for 1 hour to fracture the cells and then thawed and homogenized in 50 mM Tris-HCl (pH 8) containing PIC. Homogenates were centrifuged at 17,500 g for 30 minutes and the pellets were rehomogenized 2X in 50 mM Tris-HCl buffer. The final pellet containing the PM enriched fraction was dissolved in 0.25 ml of radioimmunoprecipitation assay buffer containing 50 mM Tris-HCl (pH 7.4), 150 mM NaCl, 10% SDS, 1% NP-40, 5% sodium-deoxycholate and PIC.
The purity of the PM was assessed by determining the activity of Na+,K+-ATPase following the method of Bonting (50). The Na+,K+-ATPase activity was enriched 5-fold in PM vs. total homogenates (4.99 ± 0.5 μmoles/mg protein/min in PM vs. 0.91 ± 0.2 μmoles/mg protein/minute in total homogenates). This enrichment of enzyme activity is consistent with earlier reports showing 4-to 5-fold higher activities of Na+,K+-ATPase in brain PM vs. homogenates (51–53). We also examined for potential cytosolic contamination of the PM fraction by determining the activity of glutamine synthetase and found very low activity in the PM fraction (0.044 ± 0.002 μmoles/mg protein/hour) vs. total homogenates (0.63 ± 0.03 μmoles/mg protein/hour).
Immunoblotting
Protein concentration of PM fraction and cortical lysates were determined by the bicinchoninic acid method (BioRad, Hercules, CA). Equal quantities of PM fraction and tissue lysates were subjected to SDS-PAGE using 12% gels (Tris-HCl, pH 7.4) and then electrophoretically transferred to PVDF membranes. Blots were blocked with 5% nonfat dry milk in tris-buffered saline (TBS) containing Tween 20 (20 mM Tris-HCl, 150 mM NaCl, pH 7.4, and 0.05% Tween 20) for 2 hours at room temperature (RT) and then incubated with rabbit anti-AQP4 antibody (1:3000, Millipore), goat anti-α-syntrophin antibody (1:1000), rabbit anti-Na+,K+-ATPase (1:1000) overnight (ON) at 4°C. PVDF membranes were washed with TBS-T and incubated with HRP-conjugated secondary antibodies for 2 hours at RT. After washing, membranes were visualized using enhanced chemiluminescence (ECL-plus; Amersham Biosciences, Piscataway, NJ). Optical densities of the bands were measured with the Chemi-Imager digital imaging system (Alpha Innotech, San Leandro, CA) and results were quantified with the Sigma Scan Pro program (Sigma, St. Louis, MO) as a proportion of the signal of Na+,K+-ATPase for PM fractions and α-tubulin for total tissue lysates.
RNA Isolation and cDNA Synthesis
RNA was isolated from adult rat brain cortex samples. Frozen samples were homogenized using the QIAshredder™ (Qiagen #79654, Qiagen, Valencia, CA) and centrifuged at 15,000 rpm for 30 seconds at 4°C. RNA isolation was done using the RNAqueous®-4PCR kit (Ambion #AM1914, Applied Biosystems, Foster City, CA). RNA was quantified with a spectrophotometer (Nanodrop ND-1000, Thermo Scientific, DE). Reverse transcription of RNA to cDNA was done using 2 μg of total RNA with random hexamer primers using the High Capacity cDNA Reverse Transcription Kit (Applied Biosystems #4368814). Only RNA with a 260/280 ratio between 1.9 and 2.0 was used for cDNA synthesis and polymerase chain reaction (PCR) analysis.
Quantitative Real-Time PCR
Quantitative real-time PCR was done using 10 μl of 1:20 diluted cDNA on the Mx3005P Multiplex Quantitative PCR System (Stratagen #401513) using quantitative PCR SYBR GREEN Reagents (Brilliant® II SYBR® Green QPCR Master Mix, Agilent Technologies, Santa Clara, CA) with ROX reference dye used as a loading control. Rat-specific primer pair sequences were constructed using NCBI Primer-BLAST. Primer pairs were obtained from Operon Biotechnologies (Huntsville, AL). For elongation factor RPL13a, the forward sequence was 5′-GGCTGAAGCCTACCAGAAAG-3′, and the reverse sequence was 5′-CTTTGCCTTTTCCTTCCGTT-3′; for glyceraldehyde 3-phosphate dehydrogenase (GAPDH); the forward sequence was 5′-GACAATGCCTGGATCCCTAA-3′, and the reverse sequence was 5′-TGGGGTATCATTTAGGCCAG-3′. Primer pairs specific for AQP4 (NM_001142366 & NM_012825) were obtained from Qiagen (QuantiTect Primer Assay: Rn_Aqp4_1_SG). Quantitative PCR cycling conditions were as follows: an initial 95°C for 10 minutes, followed by 40 cycles of 95°C for 30 seconds; 58°C for 30 seconds; and 72°C for 15 seconds. The MxPro-Mx3005P v4.10 software was used to determine the crossing point for each amplification reaction. Results were exported to Microsoft Excel for analysis. All corresponding quantitative PCR data were analyzed using the ΔΔCP method (54) and normalized against 1 negative control, and the housekeeping gene GAPDH (NM_017008). The ‘Fit Point Method’ was used to determine the crossing points for each reaction.
Immunohistochemistry
Rats (3 animals each from control and TAA-treated for 72 hours) were anesthetized and transcardially perfused with heparinized saline for 1 minute, followed by fixation in 4% paraformaldehyde for 15 minutes. Animals were decapitated and heads were left in the same fixative for an additional 24 hours at 5°C and cryoprotected with 30% sucrose in PBS. Coronal sections of brain were obtained and 20-μm-thick sections were prepared with a cryostat. Frozen sections were blocked with 10% goat serum and incubated with specific antibodies to glutamate transporter −1 (GLT-1, 1:200, Santa Cruz Biotechnology, Inc., Santa Cruz, CA), α-syntrophin (1:100, Santa Cruz Biotechnology Inc) and AQP4 (1:250) (Chemicon, Temecula, CA) ON at 4°C. Sections were washed with TBS containing 0.1% Triton X-100 and then incubated with fluorescent HRP-conjugated secondary antibodies (1:500) AlexaFlour-Rhodamine for GLT-1 and α-syntrophin, and AlexaFlour-FITC for AQP4 for 2 hours; mounted with commercial mounting media (Vector Laboratories), and examined with a laser scanning confocal microscope (Olympus, Japan). Fluorescent images for GLT-1, α-syntrophin and AQP4 were captured, and the images were merged to identify co-localization of AQP4 and GLT-1, as well as AQP4 and α-syntrophin. The specificity of antibodies corresponding to AQP4, α-syntrophin and GLT-1 was determined by performing immunohistochemistry procedures in the absence of primary antibody (negative controls), and using “absorption controls” by precipitating the antibody using synthetic polypeptides supplied by the manufacturer.
Measurement of Brain Edema
Brain water content was determined by the wet/dry weight method. Approximately 10 mg tissue (3–4 pieces from each rat) of cerebral cortex was dissected and wet weights of tissue were determined. The tissue was dried ON in an oven at 120°C and dry weights were determined. The difference in wet/dry weights was expressed as percent water content.
Astrocyte Cultures
Primary cultures of astrocytes were prepared from cerebral cortices of 1-to 2-day-old rats, as described earlier (55). Briefly, cortices were freed of meninges, minced and dissociated by trituration, passed through sterile nylon sieves and then placed in Dulbecco’s modified Eagle medium containing penicillin, streptomycin, and 15% fetal bovine serum. Approximately 0.5 X 10⁶ cells were seeded in 35-mm culture plates and maintained at 37°C in an incubator equilibrated with 5% CO2 and 95% air. Cultures consisted of 95% to 99% astrocytes based on immunohistochemistry staining for glial fibrillary acidic protein. After 14 days, cultures were treated and maintained with dibutyryl cAMP to enhance cell differentiation (56). Three- to 4-week-old cells were used for experiments.
Transfection of AQP4 siRNA
AQP4 siRNA (ON-TARGETplus SMARTpool) and non-targeting siRNA control (ON-TARGETplus Non-targeting Pool) were obtained from Dharmacon, Inc. (Lafayette, CO). Transfection of siRNA was carried out using Lipofectamine™ 2000 (Invitrogen, Carlsbad, CA) following the manufacturer’s protocol. In brief, Lipofectamine was diluted 1:50 (v/v) in OPTIMEM low serum medium (Invitrogen) and incubated at RT for 5 minutes. AQP4 siRNA and non-targeting control siRNA (50 nM) were diluted in OPTIMEM medium, added separately to Lipofectamine, and incubated at RT for 20 minutes. A 0.5 ml of the mixture containing Lipofectamine and siRNA was then added to each culture plate containing 2 ml of media and the transfection was carried out for 48 hours. Specific silencing of AQP4 was confirmed by Western blots and by quantitative real-time PCR as described above.
Cell Volume Determination
Cell volume (intracellular water space) was determined using the 3-O-methyl-[3H]-glucose (OMG) method described by Kletzien et al (57), and modified for astrocyte cultures by Norenberg et al (13). In brief, cultured astrocytes at different time points after manganese treatment were incubated with [3H]OMG (1 mM containing 1 μCi of radioactive OMG, Sigma), and at the end of incubation a small aliquot of medium was saved for specific activity determination. Cultures were washed 3X with ice-cold buffer containing 290 mM sucrose, 1 mM Tris-nitrate (pH 7.4), 0.5 mM calcium nitrate and 0.1 mM phloretin. Cells were harvested in 0.5 ml of 1 N NaOH. Radioactivity was converted to intracellular water space and expressed as μl/mg cell protein. Protein content was determined by the BCA method (BioRad).
Statistical Analysis
Data were presented as mean ± SEM of 5 rats each from control and experimental groups. The data were subjected to analysis of variance followed by Newman-Keuls post-hoc analysis. A p < 0.05 value was considered significant.
RESULTS
Clinical Assessment of ALF
TAA-treated rats appeared normal during the first 40 hours after the initial administration of TAA. Between 40 and 60 hours the rats gradually developed Grade I encephalopathy. These signs progressively worsened over time and by approximately 60 to 72 hours, the rats evolved into Grade II–III encephalopathy. This was followed by a rapid progression into Grade IV stage (at approximately 80 hours). Loss of righting reflexes and unresponsiveness to pain was followed by reduced corneal reflexes. At this stage, the body temperatures significantly dropped (37.9 ± 0.5 in control vs. 33.4 ± 0.8 in TAA). Such decreases have been documented by other investigators and appear to represent an adaptive response; correction of the hypothermia leads to a worsening of the clinical outcome (7).
The extent of liver injury was assessed by serum levels of alanine aminotransferase (ALT) and aspartate aminotransferase (AST) using a Cobes 0501 automatic analyzer (Roche Diagnostics, IN), and by brain ammonia and glutamine levels, as determined by commercial assay kits (Sigma-Aldrich) (Table). There was a 60-fold increase in ALT activity and a 5-fold increase AST activity in TAA-treated animals vs. controls. Similarly, brain ammonia and glutamine levels were significantly elevated in TAA-treated rats vs. controls (Table).
Table.
Assessment of Acute Liver Failure in Rats Treated with Thioacetamide
| Experimental Group | Serum ALT (Units/L) | Serum AST (Units/L) | Brain Ammonia μmoles/gram wt | Brain Glutamine μmoles/gram wt |
|---|---|---|---|---|
| Control | 109 ± 26 | 221 ± 45 | 2.5 ± 0.3 | 9.5 ± 1.2 |
| TAA | 6,700 ± 30 | 1,235 ± 180 | 6.7 ± 0.36 | 28 ± 5.0 |
Abbreviations: TAA, thioacetamide, ALT, alanine aminotransferase; AST, aspartate aminotransferase. Assays were determined 72 h after the final injection of TAA.
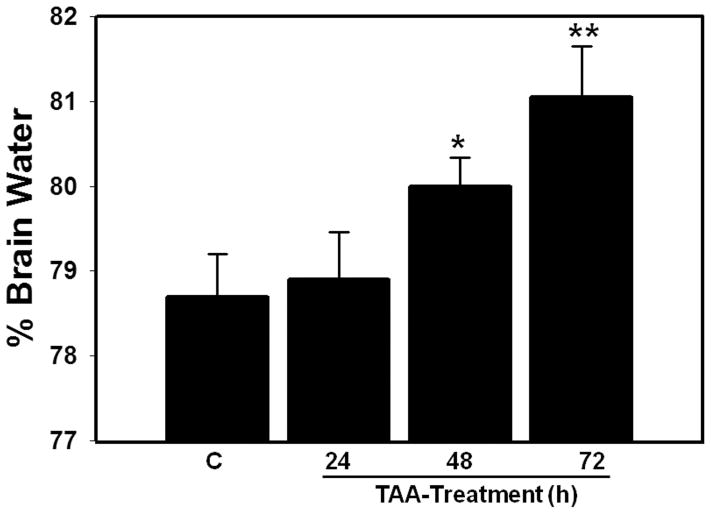
Brain Water Content
Rats treated with TAA for 24 hours did not display an increase in brain water content but after 48 hours a 1.3%-increase was identified (p < 0.05), which further increased by 72 hours (2.9%, p < 0.01) vs. saline-treated controls (controls and 48 hour and 72 hour TAA-treated rats were 78.7 ± 1.2%, 80 ±1.5% and 81.05 ±1%, respectively) (Fig. 1).
Figure 1.
Time-course of brain water content in thioacetamide (TAA)-treated rats killed at 24, 48 and 72 hours after last TAA injection. Values are mean ± SEM of 5 rats per group. *vs. control, p < 0.05–0.01; ** vs. 48 hours.
AQP4 Protein and mRNA Contents
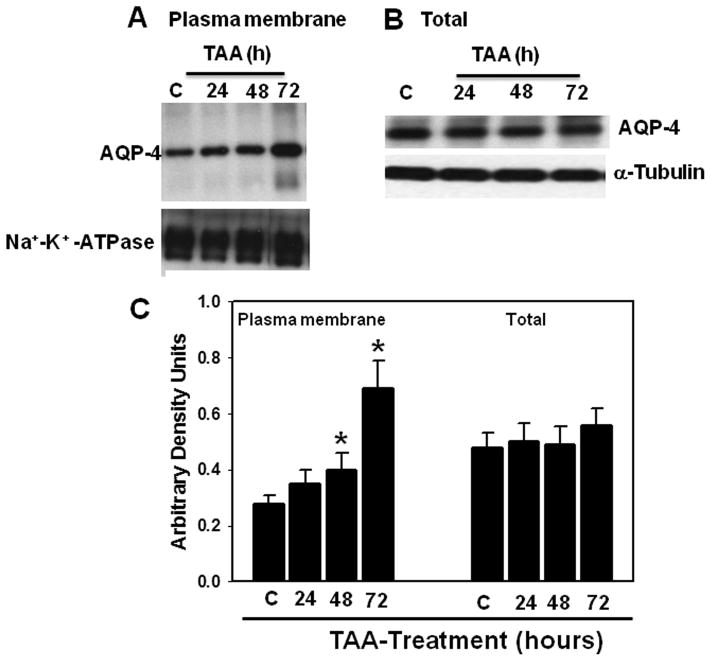
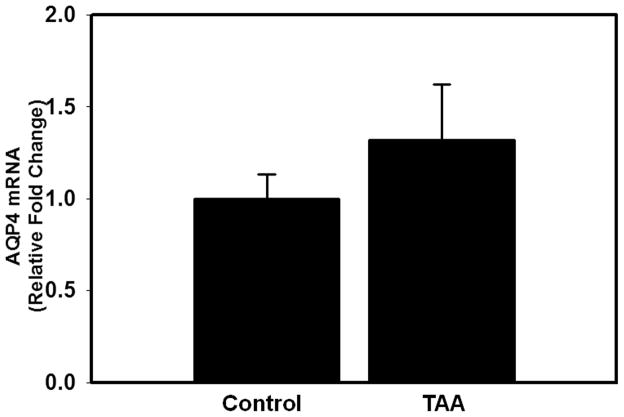
AQP4 protein content was determined in PM and total tissue fractions 24, 48 and 72 hours after the first injection of TAA. Increased AQP4 protein levels (30%, p < 0.05) in the PM were first detected at 48 hours and further increased (75%, p < 0.01) by 72 hours (Fig. 2A, C). AQP4 protein content did not change in the total tissue fraction at any time point studied (Fig. 2B), indicating that the increase in AQP4 content in the PM is not due to its neo-synthesis. Likewise, mRNA levels of AQP4 were unaltered in rats treated with TAA (72 hours) vs. controls (Fig. 3). The increase in AQP4 protein levels correlated with the extent of brain edema in rats with ALF (r2 = 0.8).
Figure 2.
(A) Time-course of aquaporin-4 (AQP4) protein expression in plasma membranes. (B) Total tissue fraction following thioacetamide (TAA) treatment. (C) Quantitation of AQP4 protein. Values are mean ± SEM of 5 rats per group. * vs. control, p < 0.05–0.01.
Figure 3.
Aquaporin-4 (AQP4) mRNA levels in cerebral cortex of control and thioacetamide (TAA)-treated (72 hours) rats. No significant changes in AQP4 mRNA were identified in TAA-treated rats vs. controls. Values are mean ± SEM of 4 rats per group.
Immunohistochemistry of AQP4
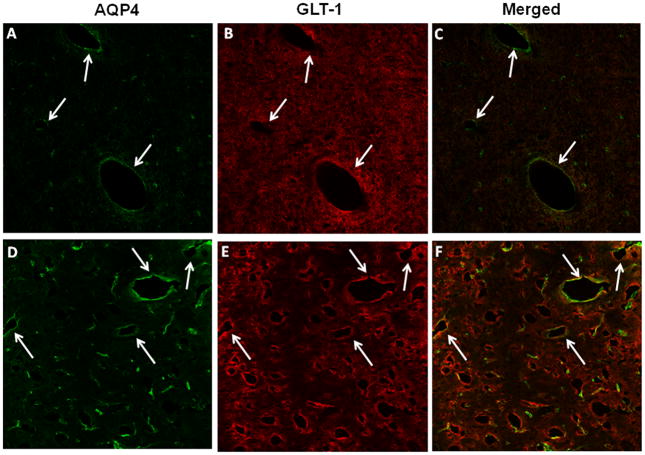
Immunofluorescence analysis of AQP4 in cortical sections in control and TAA-treated (72 hours) rats displayed AQP4 fluorescence immediately peripheral to capillaries (i.e. perivascular) and small blood vessels, consistent with localization to the perivascular astrocytic end-feet; there was lesser staining in the neuropil (Fig. 4A). Double labeling of sections with GLT-1, an astrocyte PM protein, showed colocalization with AQP4 (Fig. 4C), indicating that AQP4 staining is localized to the astrocyte PM. Sections from rats with ALF displayed intense AQP4 fluorescence adjacent to the blood vessels (Fig. 4D), consistent with its localization in perivascular astrocytic end-feet.
Figure 4.
Immunohistochemistry of aquaporin-4 (AQP4) and glutamate transporter -1 (GLT-1) in cerebral cortex of control (A–C) and thioacetamide (TAA)-treated (D–F) rats. (A) Control section showing AQP4 fluorescence (green) around the lumen of blood vessel (arrows indicate vascular structures). Panels B and E show GLT-1 immunoreactivity in control (B) and TAA-treated rats (E), respectively. A section from a TAA-treated rat (D) shows a marked increase in perivascular fluorescence. Immunofluorescence studies were done on sections from 3 control and 3 ALF animals treated with TAA for 72 hours. Scale bar = 50 μm.
Effect of AQP4 Gene Silencing on Cell Swelling in Cultured Astrocytes Treated with Ammonia
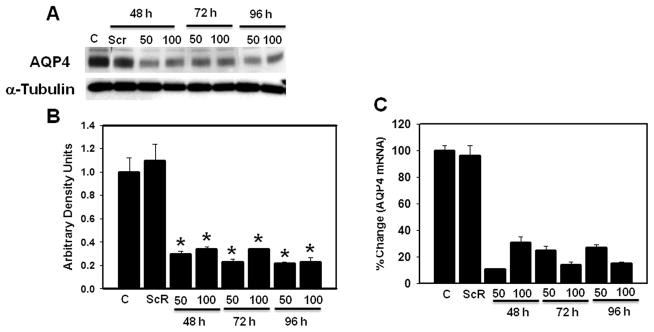
Ammonia is the principal neurotoxin implicated in the cytotoxic brain edema in ALF (11, 12, 58). Our previous studies documented that exposure of cultured astrocytes to ammonia (5 mM), a concentration found in brain in experimental ALF (59), results in astrocyte swelling (13, 60); such swelling was associated with increased AQP4 expression (42). To establish the potential contribution of AQP4 to ammonia-induced astrocyte swelling, astrocyte cultures were transfected with siRNA targeted to AQP4. Preliminary transfection experiments were performed using 2 different concentrations (50 and 100 nM) of AQP4 siRNA for 48 to 96 hours. An 85 ± 5% and 60–73 ± 4% reduction in mRNA and protein levels of AQP4, respectively, were identified 48 hours following transfection and persisted for up to 96 hours (Fig. 5). Transfection of cultures with non-targeting control siRNA (scrambled) did not show a reduction in AQP4 mRNA or in protein levels (Fig. 5). Transfection of cultures with either AQP4 siRNA or control siRNA did not cause morphological changes or cytotoxicity (data not shown).
Figure 5.
Effect of different concentrations of aquaporin-4 (AQP4) siRNA on the time-course of AQP4 protein and mRNA levels. (A) Immunoblots showing a reduction of AQP4 protein content in cultures transfected with AQP4 siRNA (siR) as compared to non-transfected control ([C] in figure). Cultures transfected with non-targeting siRNA (scrambled, Scr) showed no reduction in AQP4 protein. (B) Quantification of AQP4 protein bands showing a 65% to 72% reduction in AQP4 protein in cultures transfected with AQP4 siRNA. (C) Levels of AQP4 mRNA in cultures transfected with scrambled siRNA (Scr) and AQP4 siRNA (siR). Values are mean ± SEM of 3 individual plates taken from 3 separate seedings. * vs. C and Scr, p < 0.01.
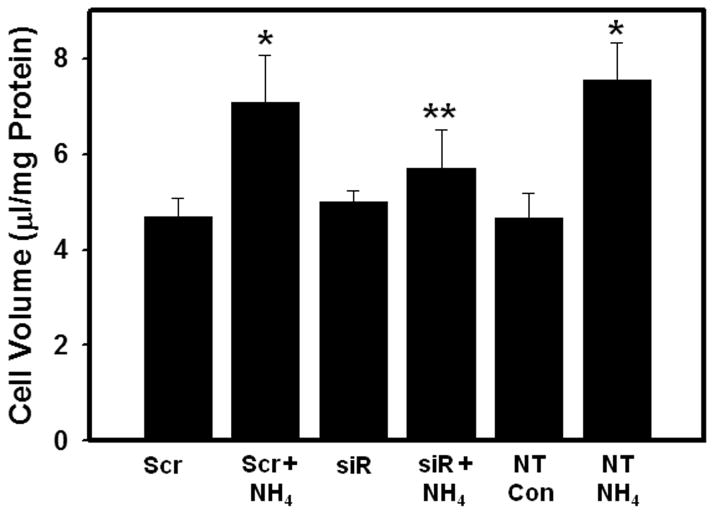
We next examined the effect of transfection of cultures with AQP4 siRNA on ammonia-induced astrocyte swelling. Cultures were separately transfected with AQP4 siRNA and with control siRNA (50 nM each). At 48 hours after transfection, the cells were treated with ammonia (5 mM NH4Cl) and cell volume was determined 24 hours later. In cultures transfected with control siRNA, ammonia caused significant cell swelling (60 ± 3%), whereas cultures transfected with AQP4 siRNA showed a marked reduction (75 ± 5%) in astrocyte swelling after ammonia treatment (Fig. 6).
Figure 6.
Effect of aquaporin-4 (AQP4) gene silencing on ammonia-induced cell swelling in cultured astrocytes. Cultures were transfected with 50 nM each of scrambled siRNA (Scr) and AQP4 siRNA (siR) for 48 hours and cell volume was determined in cultures 24 hours after treatment with ammonia (NH4Cl, 5 mM). Values are mean ± SEM of 5 individual plates taken from 2 separate seedings. * vs. non-transfected control (NT Con) and Scr. p < 0.01; ** vs. Scr+NH4 and non-transfected cultures treated with ammonia (NT NH4). p < 0.01.
α-Syntrophin Protein Content
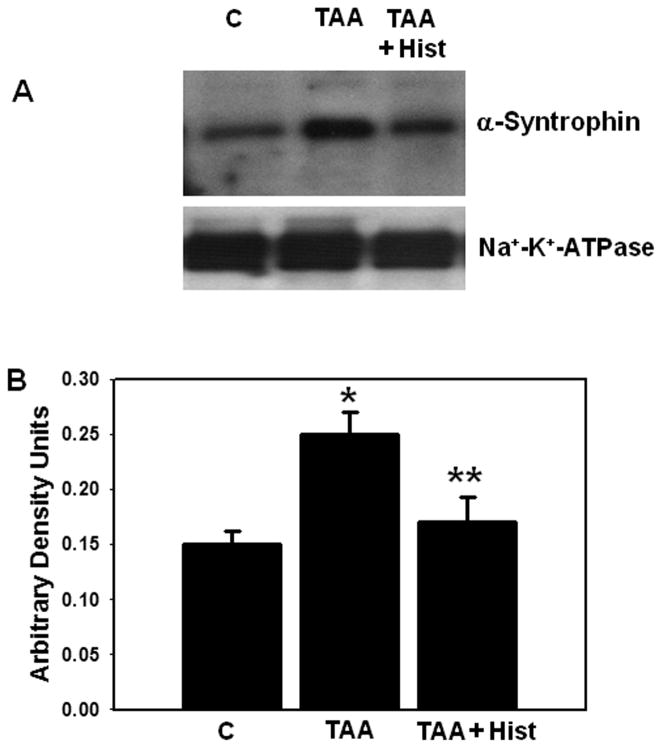
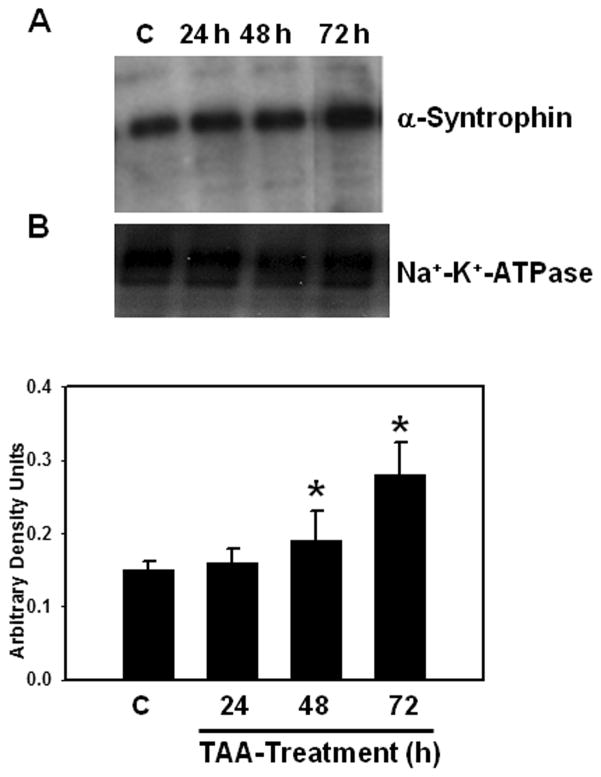
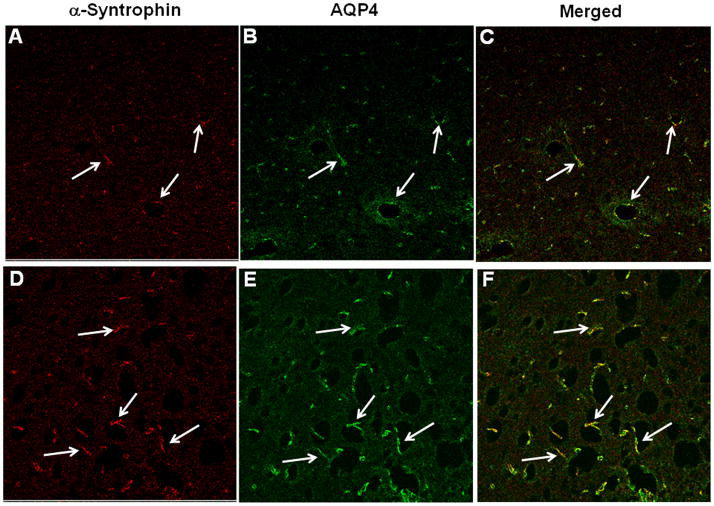
α-Syntrophin is an anchoring protein involved in polarizing AQP4 to perivascular astrocytic end-feet. α-Syntrophin protein content was significantly increased in the PM fraction (35%) at 48 hours after TAA treatment and it further rose to 86% at 72 hours after treatment (Fig. 7).
Figure 7.
(A) Time-course of α-syntrophin protein expression in plasma membranes following thioacetamaide (TAA) treatment. (B) Quantitation of α-syntrophin protein. Values are mean ± SEM of 5 animals in each experimental group. * vs. control, p < 0.05–0.01.
Immunohistochemistry of α-Syntrophin
Cortical sections of control rats displayed α-syntrophin immunofluorescence in perivascular astrocytic end-feet (Fig. 8A). Double labeling of sections with AQP4 showed colocalization of α-syntrophin with AQP4 (Fig. 8C). Sections obtained from rats treated with TAA (72 hours) displayed an increase in immunofluorescence in both α-syntrophin and AQP4 in perivascular astrocytic end-feet (Fig. 8D–F).
Figure 8.
Immunohistochemistry of α-syntrophin and aquaporin-4 (AQP4) in cerebral cortex of control and thioacetamide (TAA)-treated rats. (A–C) Control sections (A, B) show α-syntrophin (red) and AQP4 (green) fluorescence in perivascular astrocytes; there is colocalization in the merged image (C). (D–F) Sections from a TAA-treated rat (D, E) show a marked increase in perivascular fluorescence and a colocalization of AQP4 and α-syntrophin (F). Immunofluorescence studies were done on sections from 3 control and 3 rats treated with TAA for 72 hours. Scale bar = 50 μm.
Effect of L-Histidine on AQP4 and α-Syntrophin Protein Content
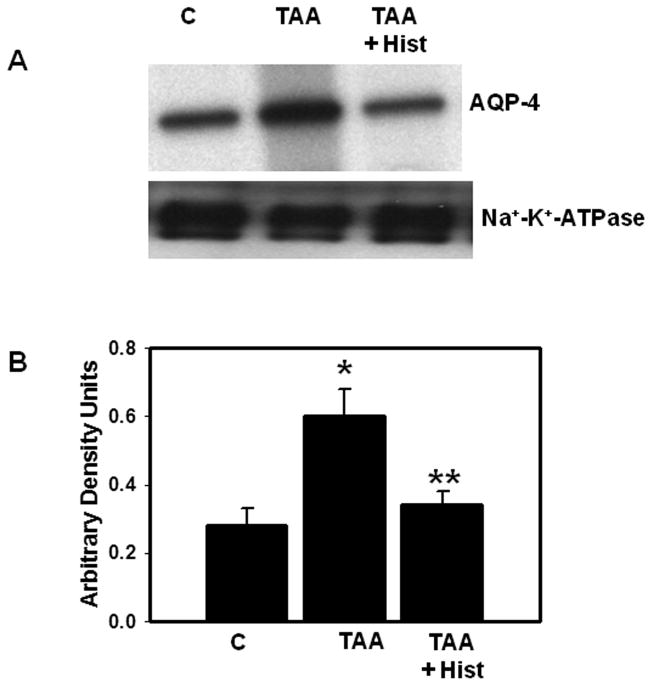
We recently documented that L-histidine completely blocked the formation of brain edema in rats with ALF (32). Therefore, we examined the effect of L-histidine on AQP4 and α-syntrophin levels. Rats were treated with TAA (300 mg/kg, i.p.) and L-histidine (100 mg/kg, dissolved in saline, i.p.) daily for 3 days. L-histidine was administered 2 hours before each TAA injection. Protein levels of AQP4 and α-syntrophin in PM were determined by immunoblots. TAA-treated rats given L-histidine showed no increase in AQP4 or α-syntrophin protein levels in PM vs. controls (Figs. 9, 10).
Figure 9.
(A) Effect of L-histidine (Hist, 100 mg/kg, i.p.) on aquaporin-4 (AQP4) protein content in plasma membranes of thioacetamide (TAA)-treated rats. (B) Quantitation of AQP4 protein. Values are mean ± SEM of 5 rats in each group. * vs. control (p < 0.05); ** vs. TAA (p < 0.01).
Figure 10.
(A) Immunoblots showing the effect of L-histidine (Hist) on α-syntrophin protein in plasma membranes of thioacetamide (TAA)-treated rats. (B) Quantitation of α-syntrophin protein. Values are mean ± SEM of 5 rats in each group. * vs. control (p < 0.05); ** vs. TAA (p < 0.01).
DISCUSSION
Brain edema in ALF is largely “cytotoxic” due largely to swelling of astrocytes (5–7) and elevated blood and brain levels of ammonia have been shown to contribute to its development (11, 12). While mechanisms of astrocyte swelling/cytotoxic edema in ALF are not completely clear, alterations in the activity of various ion transporters and exchangers that are generally involved in cell volume regulation may contribute to astrocyte swelling. Changes in the activity of these ion transporters can result in altered ion homeostasis and associated cellular osmolar imbalances that ultimately lead to astrocyte swelling (33, 61,62).
Although a disturbance in ion homeostasis resulting from altered activities of ion transporters initiates the process of astrocyte swelling, such alterations must be accompanied by an excessive entry of water into cells to achieve osmotic equilibrium. AQP4 is abundantly expressed in astrocytes and is involved in water entry (34) and contributes to cytotoxic edema in various neurological conditions, including brain trauma, cerebral ischemia, brain tumors and hyponatremia (40, 63–68).
Here, we demonstrate that rats with TAA-induced ALF displayed an elevation of AQP4 in PM of cerebral cortex, whereas total cellular levels of AQP4 were unchanged. Additionally, mRNA levels of AQP4 in the cerebral cortex of rats with ALF were not altered, indicating that increased synthesis of AQP4 protein was not responsible for its increased content in the PM. A similar increase in AQP4 without a change in its net synthesis has also been reported in cultured astrocytes treated with hypoxia, lactic acid and in cerebral cortex of rats with hyponatremia (67, 69, 70).
Here, we found no changes in AQP4 mRNA levels but this may be at slight variance with a report showing a slight (57%) reduction in AQP4 mRNA expression in the sparse-fur mouse model of congenital hyperammonemia (71). The reason for this minor discrepancy in mRNA levels in these models is not known but the sparse-fur mouse model is associated with only moderate levels of fluctuating hyperammonemia (72), whereas rats with ALF consistently show sustained high levels of blood and brain ammonia (32, 43).
The mechanism by which ALF results in an apparent increase in PM levels of AQP4 in the absence of increase in its mRNA or total brain protein content are not known. In a model of hyponatremia, Vajda et al suggested that the increase in AQP4 PM levels might be due to conformational changes in AQP4 that result in its increased immunoreactivity(67). Such conformational changes presumably might also result in functional activation of AQP4.
Another mechanism for increased PM levels of AQP4 in ALF may be due to a reduction in its degradation. Precise mechanisms responsible for AQP4 degradation in brain have not been extensively examined, but AQP4 is ubiquitinated in retinal Müller cells and its ubiquitination is inhibited leading to an increase in its levels in the PM following retinal injury (76). Likewise, Leitch et al reported that AQP1 normally undergoes ubiquitination, followed by its degradation by the proteasomal system and that this was inhibited by osmotic stress, resulting in its increased expression in the PM (77). Therefore, it is possible that interference with the degradation of AQP4 (e.g. due to decreased ubiquitination) may result in its over-expression in the PM in ALF. It is of interest that oxidative/nitrosative stress (ONS) inhibits protein ubiquitination and subsequent proteasomal activity (80, 81), that ALF is associated with ONS (78, 79), and that ONS has been implicated in AQP4 over-expression in other neurological conditions (82, 83). Therefore, it is possible that ONS resulting from ALF may contribute to increased AQP4 PM levels.
α-Syntrophin, a member of dystrophin-associated proteins (74), anchors AQP4 to the PM of astrocytic end-feet (73). Neely et al have suggested that α-syntrophin tethers AQP4 at the C-terminal PDZ domain of AQP4, thereby promoting a greater anchoring (i.e. stability) of AQP4 in the PM (73). Because we found increased α-syntrophin levels in rats with ALF, it is possible that such increases might partially account for the increase in PM AQP4 content. Nevertheless, although all these possibilities may contribute to increases in AQP4 PM levels, the precise mechanisms by which ALF results in such increases remains to be determined.
α-Syntrophin also facilitates the polarization of AQP4 to the perivascular astrocytic end-feet (73). In the present study, TAA treatment resulted in a marked increase of AQP4 immunoreactivity in perivascular astrocytic end-feet. Additionally, our observation of increased α-syntrophin, as well as of AQP4, in the PM of cerebral cortex of rats with ALF supports the view that α-syntrophin contributes to the increased polarization of AQP4 to the perivascular astrocytic end-feet in ALF. These findings are consistent with reports showing increased AQP4 and α-syntrophin proteins in the PM of astrocytes in edematous tissue surrounding brain tumors (66, 75).
While increased PM expression of AQP4 in rats with ALF correlated with the formation of brain edema, we cannot implicate AQP4 definitively in brain edema formation in ALF. Nevertheless, the marked reduction in cell swelling observed in cultured astrocytes transfected with AQP4 siRNA following ammonia treatment supports the concept that AQP4 plays a critical role in the cytotoxic brain edema/astrocyte swelling in ALF, in which ammonia is the principal neurotoxin.
We recently documented that L-histidine, which can inhibit mitochondrial glutamine transport, completely abolished brain edema in TAA-treated rats (32), which is consistent with an important role for glutamine in the development of brain edema in ALF (84, 85). It was postulated that glial accumulation of glutamine leads to an osmotic shift of water into astrocytes resulting in their swelling (osmolyte hypothesis) (20), but more recently it has been proposed that glutamine is initially transported into mitochondria and subsequently hydrolyzed by phosphate-activated glutaminase, thus yielding high levels of ammonia in that organelle (30, 86, 87). Such high ammonia levels in mitochondria stimulate ONS and induce the mitochondrial permeability transition, i.e. processes known to cause astrocyte swelling (23). Consistent with this view, we recently demonstrated that L-histidine diminished ONS in rats with ALF (32) and the present study shows that L-histidine also completely blocked the increased AQP4 levels in the PM in TAA-treated rats. This suggests that the action of histidine in inhibiting AQP4 over-expression in ALF may be a consequence of its inhibition of ONS.
In summary, we demonstrate that brain edema in ALF is associated with increased brain levels of AQP4 in the PM, whereas total AQP4 protein and mRNA levels are unchanged. The basis for this increase is unknown, but may be due to conformational changes in AQP4 protein, interference with its degradation, or increased anchoring of AQP4 to the PM, possibly related to an increase in α-syntrophin. The latter may also be involved in the polarization of AQP4 to the perivascular astrocytic end-feet. L-histidine, an inhibitor of mitochondrial glutamine transport completely blocked the increase in AQP4 and α-syntrophin proteins, suggesting a key role of glutamine in the process by which AQP4 is over-expressed in PM. Taken together, the results suggest that AQP4 and/or α-syntrophin represent potential therapeutic targets to counteract brain edema associated with ALF.
Acknowledgments
This work was supported by the Department of Veterans Affairs Merit review grant, NIH grant DK063311 and the American Liver Foundation.
We are grateful to Alina Fernandez for the preparation of astrocyte cultures.
References
- 1.Capocaccia L, Angelico M. Fulminant hepatic failure. Clinical features, etiology, epidemiology, and current management. Dig Dis Sci. 1991;36:775–9. doi: 10.1007/BF01311236. [DOI] [PubMed] [Google Scholar]
- 2.Hoofnagle JH, Carithers RL, Jr, Shapiro C, et al. Fulminant hepatic failure: Summary of a workshop. Hepatology. 1995;21:240–52. [PubMed] [Google Scholar]
- 3.Bismuth H, Samuel D, Castaing D, et al. Liver transplantation in Europe for patients with acute liver failure. Semin Liver Dis. 1996;16:415–25. doi: 10.1055/s-2007-1007254. [DOI] [PubMed] [Google Scholar]
- 4.Vaquero J, Chung C, Cahill ME, et al. Pathogenesis of hepatic encephalopathy in acute liver failure. Semin Liver Dis. 2003;23:259–69. doi: 10.1055/s-2003-42644. [DOI] [PubMed] [Google Scholar]
- 5.Martinez A. Electron microscopy in human hepatic encephalopathy. Acta Neuropathol. 1968;11:82–6. doi: 10.1007/BF00692797. [DOI] [PubMed] [Google Scholar]
- 6.Kato M, Sugihara J, Nakamura T, et al. Electron microscopic study of the blood-brain barrier in rats with brain edema and encephalopathy due to acute hepatic failure. Gastroenterol Jpn. 1989;24:135–42. doi: 10.1007/BF02774187. [DOI] [PubMed] [Google Scholar]
- 7.Traber P, DalCanto M, Ganger D, et al. Effect of body temperature on brain edema and encephalopathy in the rat after hepatic devascularization. Gastroenterology. 1989;96:885–91. [PubMed] [Google Scholar]
- 8.Traber PG, Dal Canto M, Ganger DR, et al. Electron microscopic evaluation of brain edema in rabbits with galactosamine-induced fulminant hepatic failure: ultrastructure and integrity of the blood-brain barrier. Hepatology. 1987;7:1272–7. doi: 10.1002/hep.1840070616. [DOI] [PubMed] [Google Scholar]
- 9.Clemmesen JO, Larsen FS, Kondrup J, et al. Cerebral herniation in patients with acute liver failure is correlated with arterial ammonia concentration. Hepatology. 1999;29:648–53. doi: 10.1002/hep.510290309. [DOI] [PubMed] [Google Scholar]
- 10.Ong JP, Aggarwal A, Krieger D, et al. Correlation between ammonia levels and the severity of hepatic encephalopathy. Am J Med. 2003;114:188–93. doi: 10.1016/s0002-9343(02)01477-8. [DOI] [PubMed] [Google Scholar]
- 11.Blei AT. Brain edema and intracranial hypertension: A focus for the use of liver support systems. Artif Organs. 1997;21:1182–4. doi: 10.1111/j.1525-1594.1997.tb00472.x. [DOI] [PubMed] [Google Scholar]
- 12.Butterworth RF. Brain edema in acute liver failure. Indian J Gastroenterol. 2003;22(Suppl 2):S59–61. [PubMed] [Google Scholar]
- 13.Norenberg MD, Baker L, Norenberg LO, et al. Ammonia-induced astrocyte swelling in primary culture. Neurochem Res. 1991;16:833–6. doi: 10.1007/BF00965694. [DOI] [PubMed] [Google Scholar]
- 14.Olson JE, Evers JA, Holtzman D. Astrocyte volume regulation and ATP and phosphocreatine concentrations after exposure to salicylate, ammonium, and fatty acids. Metab Brain Dis. 1992;7:183–96. doi: 10.1007/BF01000245. [DOI] [PubMed] [Google Scholar]
- 15.Zwingmann C, Flogel U, Pfeuffer J, et al. Effects of ammonia exposition on glioma cells: Changes in cell volume and organic osmolytes studied by diffusion-weighted and high-resolution NMR spectroscopy. Dev Neurosci. 2000;22:463–71. doi: 10.1159/000017476. [DOI] [PubMed] [Google Scholar]
- 16.Ganz R, Swain M, Traber P, et al. Ammonia-induced swelling of rat cerebral cortical slices: implications for the pathogenesis of brain edema in acute hepatic failure. Metab Brain Dis. 1989;4:213–23. doi: 10.1007/BF01000297. [DOI] [PubMed] [Google Scholar]
- 17.Norenberg MD. A light and electron microscopic study of experimental portal-systemic (ammonia) encephalopathy. Progression and reversal of the disorder. Lab Invest. 1977;36:618–27. [PubMed] [Google Scholar]
- 18.Voorhies TM, Ehrlich ME, Duffy TE, et al. Acute hyperammonemia in the young primate: Physiologic and neuropathologic correlates. Pediatr Res. 1983;17:970–5. doi: 10.1203/00006450-198312000-00009. [DOI] [PubMed] [Google Scholar]
- 19.Willard-Mack CL, Koehler RC, Hirata T, et al. Inhibition of glutamine synthetase reduces ammonia-induced astrocyte swelling in rat. Neuroscience. 1996;71:589–99. doi: 10.1016/0306-4522(95)00462-9. [DOI] [PubMed] [Google Scholar]
- 20.Brusilow SW, Traystman R. Hepatic encephalopathy. N Engl J Med. 1986;314:786–7. [PubMed] [Google Scholar]
- 21.Norenberg MD, Bender AS. Astrocyte swelling in liver failure: Role of glutamine and benzodiazepines. Acta Neurochir Suppl (Wien) 1994;60:24–7. doi: 10.1007/978-3-7091-9334-1_6. [DOI] [PubMed] [Google Scholar]
- 22.Blei AT. Pathophysiology of brain edema in fulminant hepatic failure, revisited. Metab Brain Dis. 2001;16:85–94. doi: 10.1023/a:1011670713730. [DOI] [PubMed] [Google Scholar]
- 23.Albrecht J, Norenberg MD. Glutamine: A Trojan horse in ammonia neurotoxicity. Hepatology. 2006;44:788–94. doi: 10.1002/hep.21357. [DOI] [PubMed] [Google Scholar]
- 24.Hourani BT, Hamlin EM, Reynolds TB. Cerebrospinal fluid glutamine as a measure of hepatic encephalopathy. Arch Intern Med. 1971;127:1033–6. [PubMed] [Google Scholar]
- 25.Record CO, Buxton B, Chase RA, et al. Plasma and brain amino acids in fulminant hepatic failure and their relationship to hepatic encephalopathy. Eur J Clin Invest. 1976;6:387–94. doi: 10.1111/j.1365-2362.1976.tb00533.x. [DOI] [PubMed] [Google Scholar]
- 26.McConnell JR, Antonson DL, Ong CS, et al. Proton spectroscopy of brain glutamine in acute liver failure. Hepatology. 1995;22:69–74. [PubMed] [Google Scholar]
- 27.Master S, Gottstein J, Blei AT. Cerebral blood flow and the development of ammonia-induced brain edema in rats after portacaval anastomosis. Hepatology. 1999;30:876–80. doi: 10.1002/hep.510300428. [DOI] [PubMed] [Google Scholar]
- 28.Tofteng F, Hauerberg J, Hansen BA, et al. Persistent arterial hyperammonemia increases the concentration of glutamine and alanine in the brain and correlates with intracranial pressure in patients with fulminant hepatic failure. J Cereb Blood Flow Metab. 2006;26:21–7. doi: 10.1038/sj.jcbfm.9600168. [DOI] [PubMed] [Google Scholar]
- 29.Rama Rao KV, Jayakumar AR, Norenberg MD. Induction of the mitochondrial permeability transition in cultured astrocytes by glutamine. Neurochem Int. 2003;43:517–23. doi: 10.1016/s0197-0186(03)00042-1. [DOI] [PubMed] [Google Scholar]
- 30.Jayakumar AR, Rama Rao KV, Schousboe A, et al. Glutamine-induced free radical production in cultured astrocytes. Glia. 2004;46:296–301. doi: 10.1002/glia.20003. [DOI] [PubMed] [Google Scholar]
- 31.Pichili VBR, Rao KVR, Jayakumar AR, et al. Inhibition of glutamine transport into mitochondria protects astrocytes from ammonia toxicity. Glia. 2007;55:801–9. doi: 10.1002/glia.20499. [DOI] [PubMed] [Google Scholar]
- 32.RamaRao KV, Reddy PVB, Tong X, et al. Brain edema in acute liver failure: Inhibition by L-histidine. Am J Pathol. 2010;176:1400–1408. doi: 10.2353/ajpath.2010.090756. [DOI] [PMC free article] [PubMed] [Google Scholar]
- 33.Norenberg M. Astrocytes and ammonia in hepatic encephalopathy. In: deVellis J, editor. Astrocytes in the Aging Brain. Totowa, NJ: Human Press; 2001. pp. 477–96. [Google Scholar]
- 34.King LS, Agre P. Pathophysiology of the aquaporin water channels. Annu Rev Physiol. 1996;58:619–48. doi: 10.1146/annurev.ph.58.030196.003155. [DOI] [PubMed] [Google Scholar]
- 35.Nielsen S, Nagelhus EA, Amiry-Moghaddam M, et al. Specialized membrane domains for water transport in glial cells: High-resolution immunogold cytochemistry of aquaporin-4 in rat brain. J Neurosci. 1997;17:171–80. doi: 10.1523/JNEUROSCI.17-01-00171.1997. [DOI] [PMC free article] [PubMed] [Google Scholar]
- 36.Manley GT, Binder DK, Papadopoulos MC, et al. New insights into water transport and edema in the central nervous system from phenotype analysis of aquaporin-4 null mice. Neuroscience. 2004;129:983–91. doi: 10.1016/j.neuroscience.2004.06.088. [DOI] [PubMed] [Google Scholar]
- 37.Papadopoulos MC, Verkman AS. Aquaporin-4 and brain edema. Pediatr Nephrol. 2007;22:778–84. doi: 10.1007/s00467-006-0411-0. [DOI] [PMC free article] [PubMed] [Google Scholar]
- 38.Bloch O, Manley GT. The role of aquaporin-4 in cerebral water transport and edema. Neurosurg Focus. 2007;22:E3. doi: 10.3171/foc.2007.22.5.4. [DOI] [PubMed] [Google Scholar]
- 39.Zador Z, Stiver S, Wang V, et al. Role of aquaporin-4 in cerebral edema and stroke. Handb Exp Pharmacol. 2009:159–70. doi: 10.1007/978-3-540-79885-9_7. [DOI] [PMC free article] [PubMed] [Google Scholar]
- 40.Manley GT, Fujimura M, Ma T, et al. Aquaporin-4 deletion in mice reduces brain edema after acute water intoxication and ischemic stroke. Nat Med. 2000;6:159–63. doi: 10.1038/72256. [DOI] [PubMed] [Google Scholar]
- 41.Yang B, Zador Z, Verkman AS. Glial cell aquaporin-4 overexpression in transgenic mice accelerates cytotoxic brain swelling. J Biol Chem. 2008;283:15280–6. doi: 10.1074/jbc.M801425200. [DOI] [PMC free article] [PubMed] [Google Scholar]
- 42.Rama Rao KV, Chen M, Simard JM, et al. Increased aquaporin-4 expression in ammonia-treated cultured astrocytes. Neuroreport. 2003;14:2379–82. doi: 10.1097/00001756-200312190-00018. [DOI] [PubMed] [Google Scholar]
- 43.Hilgier W, Albrecht J, Krasnicka Z. Thioacetamide-induced hepatic encephalopathy in the rat. I. Preliminary morphological and biochemical observations. Neuropatol Pol. 1983;21:487–94. [PubMed] [Google Scholar]
- 44.Zimmermann C, Ferenci P, Pifl C, et al. Hepatic encephalopathy in thioacetamide-induced acute liver failure in rats: Characterization of an improved model and study of amino acid-ergic neurotransmission. Hepatology. 1989;9:594–601. doi: 10.1002/hep.1840090414. [DOI] [PubMed] [Google Scholar]
- 45.Gammal SH, Basile AS, Geller D, et al. Reversal of the behavioral and electrophysiological abnormalities of an animal model of hepatic encephalopathy by benzodiazepine receptor ligands. Hepatology. 1990;11:371–8. doi: 10.1002/hep.1840110307. [DOI] [PubMed] [Google Scholar]
- 46.Krasnicka Z, Albrecht J, Gajkowska B, et al. Thioacetamide-induced hepatic encephalopathy in the rat. II. Cytochemical and ultrastructural studies on astrocytes cultured in vitro. Neuropatol Pol. 1983;21:495–510. [PubMed] [Google Scholar]
- 47.Gammal SH, Jones EA. Hepatic encephalopathy. Med Clin North Am. 1989;73:793–813. doi: 10.1016/s0025-7125(16)30639-3. [DOI] [PubMed] [Google Scholar]
- 48.Larsen FS, Adel Hansen B, Pott F, et al. Dissociated cerebral vasoparalysis in acute liver failure. A hypothesis of gradual cerebral hyperaemia. J Hepatol. 1996;25:145–51. doi: 10.1016/s0168-8278(96)80066-3. [DOI] [PubMed] [Google Scholar]
- 49.Marples D, Knepper MA, Christensen EI, et al. Redistribution of aquaporin-2 water channels induced by vasopressin in rat kidney inner medullary collecting duct. Am J Physiol. 1995;269:C655–64. doi: 10.1152/ajpcell.1995.269.3.C655. [DOI] [PubMed] [Google Scholar]
- 50.Bonting S. Sodium-potassium activated adenosine triphosphatase and cation transport. In: Bittar EE, editor. Membrane Ion Transport. Vol. 1. New York: Wiley Interscience; 1970. pp. 257–363. [Google Scholar]
- 51.Henn FA, Hamberger A. Preparation of glial plasma membrane from a cell fraction enriched in astrocytes. Neurochem Res. 1976;1:261–73. doi: 10.1007/BF00973773. [DOI] [PubMed] [Google Scholar]
- 52.Krishnan KS, Balaram P. Mammalian brain plasma membranes. Isolation, enzymatic, and chemical characterization. Exp Cell Res. 1976;101:299–306. doi: 10.1016/0014-4827(76)90381-5. [DOI] [PubMed] [Google Scholar]
- 53.Bem WT, Yeung SJ, Belcheva M, et al. Age-dependent changes in the subcellular distribution of rat brain mu-opioid receptors and GTP binding regulatory proteins. J Neurochem. 1991;57:1470–7. doi: 10.1111/j.1471-4159.1991.tb06340.x. [DOI] [PubMed] [Google Scholar]
- 54.Pfaffl MW. A new mathematical model for relative quantification in real-time RT-PCR. Nucleic Acids Res. 2001;29:e45. doi: 10.1093/nar/29.9.e45. [DOI] [PMC free article] [PubMed] [Google Scholar]
- 55.Ducis I, Norenberg LO, Norenberg MD. The benzodiazepine receptor in cultured astrocytes from genetically epilepsy-prone rats. Brain Res. 1990;531:318–21. doi: 10.1016/0006-8993(90)90793-b. [DOI] [PubMed] [Google Scholar]
- 56.Juurlink BH, Hertz L. Plasticity of astrocytes in primary cultures: An experimental tool and a reason for methodological caution. Dev Neurosci. 1985;7:263–77. doi: 10.1159/000112295. [DOI] [PubMed] [Google Scholar]
- 57.Kletzien RF, Pariza MW, Becker JE, et al. A method using 3-O-methyl-D-glucose and phloretin for the determination of intracellular water space of cells in monolayer culture. Anal Biochem. 1975;68:537–44. doi: 10.1016/0003-2697(75)90649-1. [DOI] [PubMed] [Google Scholar]
- 58.Norenberg MD. The role of astrocytes in hepatic encephalopathy. Neurochem Pathol. 1987;6:13–33. doi: 10.1007/BF02833599. [DOI] [PubMed] [Google Scholar]
- 59.Swain M, Butterworth RF, Blei AT. Ammonia and related amino acids in the pathogenesis of brain edema in acute ischemic liver failure in rats. Hepatology. 1992;15:449–53. doi: 10.1002/hep.1840150316. [DOI] [PubMed] [Google Scholar]
- 60.Bender AS, Norenberg MD. Effect of benzodiazepines and neurosteroids on ammonia-induced swelling in cultured astrocytes. J Neurosci Res. 1998;54:673–80. doi: 10.1002/(SICI)1097-4547(19981201)54:5<673::AID-JNR12>3.0.CO;2-P. [DOI] [PubMed] [Google Scholar]
- 61.Hoffmann EK, Pedersen SF. Sensors and signal transduction in the activation of cell volume regulatory ion transport systems. Contrib Nephrol. 1998;123:50–78. doi: 10.1159/000059921. [DOI] [PubMed] [Google Scholar]
- 62.Hoffmann EK, Lambert IH, Pedersen SF. Physiology of cell volume regulation in vertebrates. Physiol Rev. 2009;89:193–277. doi: 10.1152/physrev.00037.2007. [DOI] [PubMed] [Google Scholar]
- 63.King LS, Yasui M, Agre P. Aquaporins in health and disease. Mol Med Today. 2000;6:60–65. doi: 10.1016/s1357-4310(99)01636-6. [DOI] [PubMed] [Google Scholar]
- 64.Vizuete ML, Venero JL, Vargas C, et al. Differential upregulation of aquaporin-4 mRNA expression in reactive astrocytes after brain injury: Potential role in brain edema. Neurobiol Dis. 1999;6:245–58. doi: 10.1006/nbdi.1999.0246. [DOI] [PubMed] [Google Scholar]
- 65.Taniguchi M, Yamashita T, Kumura E, et al. Induction of aquaporin-4 water channel mRNA after focal cerebral ischemia in rat. Brain Res Mol Brain Res. 2000;78:131–7. doi: 10.1016/s0169-328x(00)00084-x. [DOI] [PubMed] [Google Scholar]
- 66.Papadopoulos MC, Saadoun S, Binder DK, et al. Molecular mechanisms of brain tumor edema. Neuroscience. 2004;129:1011–20. doi: 10.1016/j.neuroscience.2004.05.044. [DOI] [PubMed] [Google Scholar]
- 67.Vajda Z, Promeneur D, Doczi T, et al. Increased aquaporin-4 immunoreactivity in rat brain in response to systemic hyponatremia. Biochem Biophys Res Commun. 2000;270:495–503. doi: 10.1006/bbrc.2000.2472. [DOI] [PubMed] [Google Scholar]
- 68.Amiry-Moghaddam M, Xue R, Haug FM, et al. Alpha-syntrophin deletion removes the perivascular but not endothelial pool of aquaporin-4 at the blood-brain barrier and delays the development of brain edema in an experimental model of acute hyponatremia. FASEB J. 2004;18:542–4. doi: 10.1096/fj.03-0869fje. [DOI] [PubMed] [Google Scholar]
- 69.Yamamoto N, Yoneda K, Asai K, et al. Alterations in the expression of the AQP family in cultured rat astrocytes during hypoxia and reoxygenation. Brain Res Mol Brain Res. 2001;90:26–38. doi: 10.1016/s0169-328x(01)00064-x. [DOI] [PubMed] [Google Scholar]
- 70.Morishima T, Aoyama M, Iida Y, et al. Lactic acid increases aquaporin 4 expression on the cell membrane of cultured rat astrocytes. Neurosci Res. 2008;61:18–26. doi: 10.1016/j.neures.2008.01.005. [DOI] [PubMed] [Google Scholar]
- 71.Lichter-Konecki U, Mangin JM, Gordish-Dressman H, et al. Gene expression profiling of astrocytes from hyperammonemic mice reveals altered pathways for water and potassium homeostasis in vivo. Glia. 2008;56:365–77. doi: 10.1002/glia.20624. [DOI] [PMC free article] [PubMed] [Google Scholar]
- 72.Qureshi IA, Rao KV. Sparse-fur (spf) mouse as a model of hyperammonemia: Alterations in the neurotransmitter systems. Adv Exp Med Biol. 1997;420:143–58. doi: 10.1007/978-1-4615-5945-0_9. [DOI] [PubMed] [Google Scholar]
- 73.Neely JD, Amiry-Moghaddam M, Ottersen OP, et al. Syntrophin-dependent expression and localization of Aquaporin-4 water channel protein. Proc Natl Acad Sci U S A. 2001;98:14108–13. doi: 10.1073/pnas.241508198. [DOI] [PMC free article] [PubMed] [Google Scholar]
- 74.Inoue M, Wakayama Y, Liu JW, et al. Ultrastructural localization of aquaporin 4 and alpha1-syntrophin in the vascular feet of brain astrocytes. Tohoku J Exp Med. 2002;197:87–93. doi: 10.1620/tjem.197.87. [DOI] [PubMed] [Google Scholar]
- 75.Saadoun S, Papadopoulos MC, Davies DC, et al. Aquaporin-4 expression is increased in oedematous human brain tumours. J Neurol Neurosurg Psychiatry. 2002;72:262–5. doi: 10.1136/jnnp.72.2.262. [DOI] [PMC free article] [PubMed] [Google Scholar]
- 76.Dibas A, Yang MH, He S, et al. Changes in ocular aquaporin-4 (AQP4) expression following retinal injury. Mol Vis. 2008;14:1770–83. [PMC free article] [PubMed] [Google Scholar]
- 77.Leitch V, Agre P, King LS. Altered ubiquitination and stability of aquaporin-1 in hypertonic stress. Proc Natl Acad Sci U S A. 2001;98:2894–8. doi: 10.1073/pnas.041616498. [DOI] [PMC free article] [PubMed] [Google Scholar]
- 78.Norenberg MD, Rao KV, Jayakumar AR. Mechanisms of ammonia-induced astrocyte swelling. Metab Brain Dis. 2005;20:303–18. doi: 10.1007/s11011-005-7911-7. [DOI] [PubMed] [Google Scholar]
- 79.Norenberg MD, Jayakumar AR, Rama Rao KV, et al. New concepts in the mechanism of ammonia-induced astrocyte swelling. Metab Brain Dis. 2007;22:219–34. doi: 10.1007/s11011-007-9062-5. [DOI] [PubMed] [Google Scholar]
- 80.Keller JN, Huang FF, Zhu H, et al. Oxidative stress-associated impairment of proteasome activity during ischemia-reperfusion injury. J Cereb Blood Flow Metab. 2000;20:1467–73. doi: 10.1097/00004647-200010000-00008. [DOI] [PubMed] [Google Scholar]
- 81.Ding Q, Keller JN. Proteasome inhibition in oxidative stress neurotoxicity: implications for heat shock proteins. J Neurochem. 2001;77:1010–17. doi: 10.1046/j.1471-4159.2001.00302.x. [DOI] [PubMed] [Google Scholar]
- 82.Hao W, Wu XQ, Xu RT. The molecular mechanism of aminoguanidine-mediated reduction on the brain edema after surgical brain injury in rats. Brain Res. 2009;1282:156–61. doi: 10.1016/j.brainres.2009.05.041. [DOI] [PubMed] [Google Scholar]
- 83.Kaur C, Sivakumar V, Yong Z, et al. Blood-retinal barrier disruption and ultrastructural changes in the hypoxic retina in adult rats: The beneficial effect of melatonin administration. J Pathol. 2007;212:429–39. doi: 10.1002/path.2195. [DOI] [PubMed] [Google Scholar]
- 84.Takahashi H, Koehler RC, Brusilow SW, et al. Inhibition of brain glutamine accumulation prevents cerebral edema in hyperammonemic rats. Am J Physiol. 1991;261:H825–829. doi: 10.1152/ajpheart.1991.261.3.H825. [DOI] [PubMed] [Google Scholar]
- 85.Blei AT, Olafsson S, Therrien G, et al. Ammonia-induced brain edema and intracranial hypertension in rats after portacaval anastomosis. Hepatology. 1994;19:1437–44. [PubMed] [Google Scholar]
- 86.Rama Rao KV, Jayakumar AR, Norenberg MD. Differential response of glutamine in cultured neurons and astrocytes. J Neurosci Res. 2005;79:193–9. doi: 10.1002/jnr.20295. [DOI] [PubMed] [Google Scholar]
- 87.Pichili VB, Rao KV, Jayakumar AR, et al. Inhibition of glutamine transport into mitochondria protects astrocytes from ammonia toxicity. Glia. 2007;55:801–809. doi: 10.1002/glia.20499. [DOI] [PubMed] [Google Scholar]


