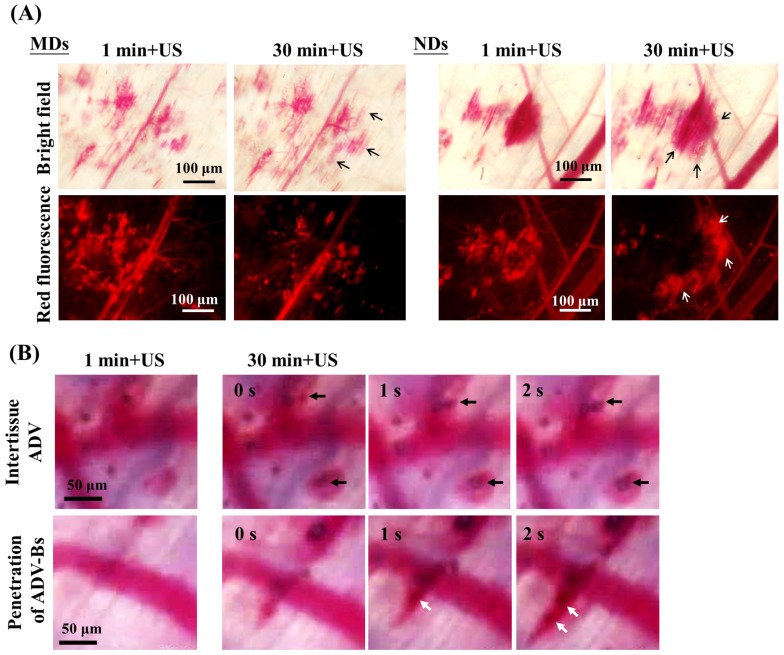
Figure 8.
(A) Intravital images obtained at 1 and 30 min after US sonication used to evaluate the drug-penetration behavior induced by the vaporization of multiple MDs and NDs. The bright-field and red-fluorescence images reveal hemorrhage and DL penetration, respectively. The arrows indicate the differences between two US sonications. (B) The intertissue ADV and penetration of ADV-Bs images in the ND group. The black and white arrows indicate the locations of ADV-Bs.

