
Figure 3.

Radiation exposure of B16F10 cells. (a) Surviving fraction of B16F10 after radiation exposure without nanoparticles (blue) and with incubation with 0.6 g/L AGuIX® nanoparticles (red) 1 hour prior to irradiation with 220 kV X-ray. Regression analysis was used to fit the data to a linear quadratic model of the form 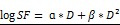 (n = 3 / point). (b) Representative images of γ-H2AX foci and (c) their quantification at 0.5 (left panel) and 24 hours (right panel) after exposure to 2 Gy radiation. (d) Percentage of cells having a specific foci class for a total of 350 cells counted per condition. Error bars represent the standard error of the mean of three independent experiments.