

Abstract
Beta oscillations are a dominant feature of the sensorimotor system. A transient and prominent increase in beta oscillations is consistently observed across the sensorimotor cortical-basal ganglia network after cessation of voluntary movement: the post-movement beta synchronization (PMBS). Current theories about the function of the PMBS have been focused on either the closure of motor response or the processing of sensory afferance. Computational models of sensorimotor control have emphasized the importance of the integration between feedforward estimation and sensory feedback, and therefore the putative motor and sensory functions of beta oscillations may reciprocally interact with each other and in fact be indissociable. Here we show that the amplitude of sensorimotor PMBS is modulated by the history of visual feedback of task-relevant errors, and negatively correlated with the trial-to-trial exploratory adjustment in a sensorimotor adaptation task in young healthy human subjects. The PMBS also negatively correlated with the uncertainty associated with the feedforward estimation, which was recursively updated in light of new sensory feedback, as identified by a Bayesian learning model. These results reconcile the two opposing motor and sensory views of the function of PMBS, and suggest a unifying theory in which PMBS indexes the confidence in internal feedforward estimation in Bayesian sensorimotor integration. Its amplitude simultaneously reflects cortical sensory processing and signals the need for maintenance or adaptation of the motor output, and if necessary, exploration to identify an altered sensorimotor transformation.
SIGNIFICANCE STATEMENT For optimal sensorimotor control, sensory feedback and feedforward estimation of a movement's sensory consequences should be weighted by the inverse of their corresponding uncertainties, which require recursive updating in a dynamic environment. We show that post-movement beta activity (13–30 Hz) over sensorimotor cortex in young healthy subjects indexes the evaluation of uncertainty in feedforward estimation. Our work contributes to the understanding of the function of beta oscillations in sensorimotor control, and provides further insight into how aberrant beta activity can contribute to the pathophysiology of movement disorders.
Keywords: Bayesian integration, estimation uncertainty, internal models, post-movement beta synchronization, sensorimotor adaptation
Introduction
Prominent increases in the power of beta oscillations (13–30 Hz) occur across the cortical-basal ganglia sensorimotor network after voluntary movements. However, the function of beta oscillations and of the post-movement beta synchronization (PMBS) in particular, remains a subject of debate. On the one hand, beta activity, and by inference the PMBS, has been suggested to reinforce existing motor states and steady motor output (Gilbertson et al., 2005; Swann et al., 2009; Engel and Fries, 2010; Jenkinson and Brown, 2011). On the other hand, PMBS has been associated with the processing of movement-related sensory afferance. Evidence supporting the latter includes observations that a similar phenomenon also follows passive movements (Cassim et al., 2001; Alegre et al., 2002), and that the PMBS is modulated by how a movement is terminated (Alegre et al., 2008) and by errors related to the completed movement (Tan et al., 2014a).
We propose that these two putative functions of beta oscillations reciprocally interact with each other and therefore are indissociable in sensorimotor control. Computational models of sensorimotor control have emphasized the importance of integrating sensory feedback with the predictions from internal feedforward models, to avoid instabilities due to feedback delays and uncertainty (Wolpert and Miall, 1996; Franklin and Wolpert, 2011; Scott, 2012). Additionally, predictions from the feedforward internal model are also compared against new sensory information of the outcome of the movement, and the mismatch between the two drives updating of the internal model and a change in the motor output (Friston, 2010; Shadmehr et al., 2010).
But how does the motor system gauge whether to rely more on feedforward estimates of the predicted movement outcome or the sensory feedback of the actual outcome of the movement? The relative weight and confidence placed in each source of information has been suggested to be proportional to its reliability (the inverse of the uncertainty) in accordance with Bayesian statistics (Knill and Pouget, 2004; Todorov, 2004; Faisal et al., 2008). In support of this, the updating of the internal model has been shown to be driven by task-relevant errors and modulated by different uncertainties, consistent with Bayes' theorem (Körding and Wolpert, 2004; Wei and Koerding, 2010). Two aspects of uncertainty, which have different roles in adaptation, are commonly distinguished (Knight, 1921; Yu and Dayan, 2005; O'Reilly, 2013). Expected uncertainty, which refers to the known variability and stochasticity inherent to the environment, drives a greater reliance on feedforward estimations derived from internal models. In contrast, uncertainty in feedforward estimates may lead to more reliance on sensory feedback. For example, sudden changes in the environment will invalidate previous knowledge, resulting in increased uncertainty in feedforward estimations and a greater emphasis placed upon current sensory feedback in updating the internal model and adapting motor output.
Therefore, the evaluation and representation of uncertainties is an essential requirement of Bayesian inference. Here we hypothesize that the PMBS indexes the confidence attributed to feedforward estimations relative to sensory feedback. Higher amplitude PMBS indicates more confidence in feedforward estimations and the maintenance of more stable motor output. In comparison, lower amplitude PMBS indicates low confidence in feedforward estimations and the need for adaptive changes driven by the sensory feedback, and when marked, the need for exploratory behavior so as to establish the nature of altered sensorimotor relationships. To test these hypotheses, we measured cortical beta activity using electroencephalography (EEG) while young healthy subjects performed a visuomotor adaptation task. We manipulated the sensory feedback and the history of task-relevant error before constant perturbations were introduced to trigger visuomotor adaptation. We expected that this manipulation would prime the subjects with different expected uncertainty and estimation uncertainty, as confirmed by a Bayesian learning model (Nassar et al., 2010; O'Reilly, 2013). We predicted that the amplitude of the PMBS would reduce with increasing uncertainty in feedforward estimations, which should lead to more weight being attributed to sensory feedback and more adaptation of motor output.
Materials and Methods
Subjects.
Seventeen healthy human subjects gave their written informed consent to participate in the experiment (9 men, mean age = 21 years, age range = 19–22). They all had normal or corrected-to-normal vision and no medical history that might interfere with the task. The study was approved by the UK National Research Ethics Service.
Experimental setup.
All experiments were performed in a well-lit laboratory during daytime. Subjects were seated in front of a computer monitor and held a finger-joystick with their dominant hand, which was rested on a padded arm support. Subjects performed an out-and-back aiming task by moving the joystick to match a cursor with a target during two conditions. The cursor, which is the visual feedback of the position of the joystick, was displayed on the computer monitor in the form of a red circle that was 6 mm (0.6 visual degrees) in diameter. The target was a green circle (6 mm diameter) displayed on the screen. Each trial started with the target (in green) and the cursor (in red) in the center of the monitor. The target then jumped from the screen center to another position randomly selected from eight positions equally spaced around an invisible circle with a radius of 7.5 cm (6.1 visual degrees; Fig. 1A). The green target remained at its new position for 750 ms before returning to the center position, where the target stayed stationary for a further 1.25–1.75 s (uniformly distributed) before the next trial began. This summed up to a total intertrial interval of between 2.0 and 2.5 s. Subjects were instructed to move the joystick when the green target jumped so as to shift the red cursor from the central start position to match the position of the green target with a rapid, discrete and straight movement. The position of the green target circle was continuously presented throughout the experiment. The position of the red cursor was presented at rest and then when the displacement of the joystick reached 95% of the target position, so that the red cursor showed the location of the initial reaching position. The subjects were explicitly told that the position of the feedback cursor would not respond to any later corrective movements and would return to center when the joystick position came back to center. This presentation strategy reduced corrective movements and encouraged more ballistic and straight movements.
Figure 1.

Experimental paradigm. A, Joystick out-and-back target-matching paradigm. Red and green circles were the cursor and target, respectively. B, Perturbation was introduced as a rotation between the red cursor and actual joystick outgoing movement (red line), the red cursor was only displayed when the displacement of the joystick reached 95% of the displacement of the target, and was not responsive to any corrective movements. C, RdmPreCdn: the session started with 80 trials of random-world priming with random perturbations, which changed from trial-to-trial. This was followed by 150 trials of constant perturbations and then 80 washout trials of no perturbation. D, StbPreCdn: as RdmPreCdn except for the absence of rotation in the first 80 trials for stable-world priming. Shaded areas in C and D show the adaptation phase in each condition.
Perturbation was implemented by introducing an angular rotation between the red cursor and the actual movement of the joystick, so that the cursor, ie, the visual feedback of the joystick position, was deviated from its actual position (Fig. 1B). After familiarization with the task, each subject completed two conditions of 310 trials each. The two experimental conditions differed in the rotation between the actual joystick position and its visual feedback cursor in the first 80 trials, before the adaptation phase during which a constant rotation was introduced (trials 81–230). In the first 80 trials, there were either random rotations, with both the amplitude and direction randomly changing from trial to trial with the maximal rotation angle equal to the angle during the constant perturbation phase (RdmPreCdn), or no rotation (StbPreCdn). In this way, the history of the task-relevant error was manipulated differently and the subjects were primed in either a random world (RdmPreCdn) or a stable world (StbPreCdn) before adaptation. Thereafter, both conditions incorporated an identical adaptation phase with constant rotation (fixed perturbation of 60°, n = 150), followed by a washout phase without rotation (n = 80; Fig. 1C,D). This experimental design was applied to differentiate estimation uncertainty from movement errors. For example, during the priming phase, there would be trials when there was no perturbation so the movement error should be low even in the random-world priming condition (see Fig. 1C). However, due to the randomness of the perturbation, the estimation uncertainties at those no perturbation trials in RdmPreCdn may be higher than those during the StbPreCdn. On the other hand, when the constant perturbation was first introduced after the priming, the amplitude of the perturbations was the same for both experimental conditions, but the estimation uncertainties were different due to the different priming history. Any difference in PMBS between the two experimental conditions in these two phases would suggest that the PMBS is modulated by estimation uncertainty rather than movement error.
All subjects performed both conditions in two separate sessions spaced at least 1 week apart. The subjects were not aware of different adaptation conditions and were not explicitly told that perturbation would be introduced. During each session, the subjects were reminded to keep trying to move the joystick so as to match the red dot with the target green dot. However, in the second session, the subjects might have expected the introduction of perturbation due to their experience in the first session, but they were not aware of the exact pattern of the perturbation. To minimize this presentation order effect, the two sessions were presented in counterbalanced order across subjects in a pseudorandomized manner, so that 8 of the 17 subjects performed RdmPreCdn before StbPreCdn, and the other nine subjects performed the task in the reverse order. The experimenter was aware of the order of the experimental conditions in which each subject was tested. On both days, subjects began with a practice session of 50 trials without rotational perturbation between the joystick and the cursor, and then completed the longer experimental session after a short break.
Data recording.
The task was presented using open-source software (PsychoPy v1.74). The timing of the jump of the green target and the positions of the cursor and target were sampled through PsychoPy at 60 Hz, and sent to a digital-to-analog converter (U3, LabJack) to synchronize the cursor and target positions with simultaneous EEG recordings.
Scalp EEG was recorded from 11 channels over Fz, FCz, Cz, Pz, Oz, F3, F4, C3, C4, P3, and P4 according to the international 10–20 EEG system. EEG was amplified, filtered between DC and 370 Hz, and sampled at the rate of 2048 Hz using a Porti 32 channel system (TMSi). EEG was referenced to the average signal across all electrodes. The position of the joystick and the timing of the target jump were also recorded through the Porti amplifier.
Behavioral analysis.
Analyses of both behavioral and EEG data were performed in MATLAB (v2012b). The displacement of the joystick was differentiated to calculate velocity, which was subsequently low-pass filtered through a Gaussian kernel with a window duration of 50 ms. Movement initiation was defined as the time when the joystick velocity crossed a threshold of three times the SD of the signal (and its noise) at “rest” and sustained this speed for at least 100 ms. Movement termination was the last time point the hand velocity fell below the threshold for that trial.
The task-relevant error in this paradigm was the cursor angular error [εC(t)], which was defined as the angle between the line connecting the start position and the displayed cursor position and the line connecting the start position and the target during that trial. The actual joystick position error [εJ(t)] was calculated as the angular mismatch between the actual joystick position at the maximal velocity of the outgoing movement and the target position. Trial-to-trial adjustment was calculated based on the absolute change in the actual joystick position error between sequential trials [|εJ(t + 1) − εJ(t)|]. The difference in the joystick error across consecutive trials indicated trial-to-trial adjustments in the initial movement (late corrective movements were excluded), which indexes adaptive and exploratory behavior. Note that the maximal velocity tended to occur before the total displacement reached the threshold for display (95% of maximal displacement), and therefore the position of the joystick at the moment with maximal speed was not displayed.
Reaction time (interval between target jump and movement initiation), movement duration (interval between movement initiation and movement termination), cursor angular error, and trial-to-trial adjustment for each trial were calculated for each individual trial and then averaged within-subjects for each experimental condition.
Bayesian modeling of estimated mean, expected uncertainty, and estimation uncertainty.
To dissociate the expected uncertainty in the environment and the uncertainty in the feedforward estimation, we assume that the internal model not only estimates the mean (μ) and the variance (σ2) of the perturbation in visuomotor adaptation, but also incorporates the uncertainty associated with these estimations (Fig. 2A). The mean and expected uncertainty were calculated as the pair (μ, σ2) with the maximal probability within the parameter space.
Figure 2.

Bayesian learning modeling. A, The parameter space of the modeling: the variance (x-axis) and the mean (y-axis) of the mismatch between the cursor position and the goal. The color plot shows the joint probability for different pairs of values of (μ, σ2), and the size of the colored contour indicates the estimation uncertainty. B, The estimated change-point probability changes with estimated μ and σ2. When expected uncertainty is high (blue line), deviations of new observations from the estimated mean would lead to smaller change in change-point probability and little increase in estimation uncertainty, relative to when expected uncertainty is low. C, D, How the model evolves across trials for one subject in RdmPreCdn and StbPreCdn, respectively. The color plots on the top show the joint probability. In the plot in the middle, the black dots show the perturbation angle, and the blue stars (C) and red stars (D) show cursor errors; the solid lines and shaded area show the estimated μ ± σ of maximal probability from the model. The bottom plots show the estimated change-point probability (blue) and the uncertainty in the feedforward estimate (green).
The mean and the variance of the errors from the 50 practice trials before starting the long experimental session were calculated and used to set the initial condition (the prior of μ and σ2). A Bayesian learning model was used to model the updating of the probabilities for different values of the mean (μ) and the variance (σ2) of the perturbation upon presentation of each new visual feedback of trial performance (Xt):
Equation 2 describes how the prior probability of any value for μ̂ and σ̂ (p(μ̂t,σ̂t|Xt−1)) is derived from the posterior of the previous trial (p(μ̂t−1,σ̂t−1)). The prior should be the same as the posterior from the previous trial if there was no change in the environment. The prior would take a uniform distribution over the parameter space if there were a sudden change in the environment, ie, the observer no longer had any prior information about the environment. Therefore, in Equation 2 the prior is calculated as the average between the posterior from the previous trial weighted by the probability that there is no change in the environment [1 − p(cp|Xt)] and the uniform distribution weighted by the probability that there is a sudden change in the environment making previous knowledge invalid [p(cp|Xt)] (O'Reilly, 2013):
 |
The change-point probability [p(cp|Xt)] on a given trial was also computed using Bayes' rule with an under-weight parameter (λ) to take into account the observation that most subjects do not adjust as much as, or as quickly, as Bayes' rule predicts (Nassar et al., 2010):
 |
where H is the prior for the change-point probability, and the estimated change-point probability on each trial is related to the ratio between the likelihood of a new observation (Xt) given the internal estimation from the previous trial, and the likelihood given the assumption of a uniform distribution over the parameter space . The lower the likelihood of the new observation given the internal estimation [p(Xt|μt−1, σt−1)], the lower the ratio r, and the higher the probability that a change has happened, which leads to an increase in the uncertainty associated with the internal estimations. Therefore, when the expected uncertainty in the environment was low, the deviation of an observed value from the distribution was associated with a greater probability of change in the underlying model parameters (Fig. 2B). Both the prior for the change-point probability (H) and under-weight parameter (λ) were constant free parameters in the model. The values of these two constants were estimated using a constrained search algorithm (fmincon in MATLAB with min/max 0/1) to minimize the squared difference between the observed response of cursor errors and the model predictions of mean. The estimated H and λ were 0.01–0.05 and 0.36–0.57 across all subjects, respectively. The range of values for λ was comparable to that shown in the original paper of Nassar et al. (2010). The range of values for H and λ was consistent with the paradigm, in which the environment did not change often (changes occurred first at trial 81, and then at trial 231), and also reflects the fact that the subjects in the current study were not explicitly told there would be a change in the environment. Accordingly, the subjects had low expectation of a change. The estimated mean and variance for each trial was calculated as the pair (μ, σ2) with the maximal probability within the parameter space and the total uncertainty in the feedforward estimation calculated as the total area in the parameter space which summed to 80% of total probability. The larger this area, the more widespread the probabilistic estimations are in the internal models, and the lower the confidence in these internal estimations. Examples of the modeling applied to behavioral data from one subject in the two experimental conditions are shown in Figure 2C,D.
EEG analysis.
Raw EEG data were first converted offline to bipolar signals, bandpass filtered between 0.1–100 Hz with a 50 Hz notch filter, and down sampled to 200 Hz. The response-locked EEG time series were then calculated and the response-locked time series were screened for artifacts. Artifacts were defined as EEG signals with amplitude larger than mean + 5 × SD, with the mean and SD calculated for each time point based on the response-locked EEG time series for all trials. The response-locked EEG time series from each artifact-free single trial were decomposed into their time-frequency representations at 1 Hz intervals in the 2–90 Hz range through a continuous wavelet transformation using the Morlet wavelet with six cycles for each frequency as the mother wavelet. An estimate of frequency-band-specific power at each time point was defined as the squared magnitude of the resulting complex signal after convolving the raw time series with the mother wavelet.
Event-related EEG power change was subsequently calculated as the percentage change relative to the overall average by dividing the power at each frequency and each time point by the average power of that frequency across the whole experimental session, and then subtracting 100 from the normalized value. Values >0 indicated power higher than the overall average power of that frequency and vice versa. Event-related power changes in the beta band (13–30 Hz) were investigated. The PMBS was defined as the average normalized power over a 200 ms window centered on the peak of the power change after movement termination. The PMBS was calculated for each individual trial before averaging for further analysis. All time frequency computations were performed with custom written MATLAB routines.
Exclusion of data points and subjects.
Exclusion criteria for data points and subjects were established before data collection based upon previous studies using a similar paradigm (Tan et al., 2014a,b). First, trials with extra-long reaction time (>mean + 3 × SD), or with movement amplitude smaller than two-thirds of the target displacement were disregarded. This led to the exclusion of zero to two trials per session per subject. Second, the trials with clear artifacts in the EEG signal were disregarded. Subjects with >20% of trials in any experimental condition defined as invalid were excluded from the final analysis. This led to the exclusion of one subject from final analysis due to artifacts in >20% of trials in one session. In addition, one subject showed no adaptation throughout the 150 trials with constant perturbation. Postexperiment discussion with the subject revealed that the subject misunderstood the task. We have therefore excluded this subject from the final analysis. Thus, results presented were based on data from 15 subjects (7 men, mean age = 21 years, age range = 19–22). Seven of the 15 subjects included in final analysis performed RdmPreCdn before StbPreCdn, and the other eight subjects performed the task in the reverse order.
Statistical analyses.
For both experimental sessions, trials were grouped according to trial execution orders into data points consisting of the average of 10 successive trials. This gave 31 data points for each subject in each experimental condition, and 62 data points when data from both experimental conditions were considered together. All behavioral kinematics and EEG measurements were calculated for each individual trial and then averaged within data points before averaging across subjects.
Repeated-measures ANOVAs were used to investigate the effects of trial execution order (ie, averages of trials 1–10, 11–20, etc) and experimental conditions on both behavioral and EEG measurements. Mauchly's test of sphericity was used to test the homogeneity of variance. Where Mauchly's test of sphericity was significant (p < 0.05) in repeated-measures ANOVAs, Greenhouse–Geisser corrections were applied. Two-tailed paired-sample t tests were calculated for post hoc analyses, using the false discovery rate procedure to correct for multiple comparisons. Mean ± SEM are presented throughout the text, unless otherwise specified.
The within-subject effects of expected uncertainty in the environment and of uncertainty in the feedforward estimate on different behavioral measurements and the PMBS, and the dependency of these effects on experimental conditions and execution order were assessed through multivariate mixed effects linear modeling using the “nlme” package (Pinheiro et al., 2008) in R (v 3.1-113). Multilevel linear modeling has the benefit of taking into account the dependency in data caused by repeated measurements within-subjects, and can identify within-subject relationships that are consistent across subjects, while treating the baseline differences across subjects as random effects (Aarts et al., 2014; Magezi, 2015). The normality assumption of the modeling was assessed by visually inspecting the distribution of the continuous independent variable, by inspecting the Q–Q plot of the residuals of the modeling, and confirmed by Kolmogorov–Smirnov test. This led us to log transform the expected uncertainty and estimation uncertainty, which made the relationship of interest linear and the model residuals normally distributed and homogeneous across all fitted values. For variables with a significant effect, the estimated regression coefficient (mean ± SEM) and the p values are reported. In addition, when a significant predictor was identified by the multilevel modeling, nonparametric correlation was applied to data from each individual separately, and the average Spearman correlation coefficients across subjects and the SEM reported.
Results
The history of task-relevant errors experienced before constant perturbations modulates adaptive behavior
During the priming phase (trials 1–80), the absolute task-relevant error, i.e., the angular error between the cursor and the target, was close to zero in the CnstPreCdn because there was no perturbation in this condition; and the absolute cursor error was large and close to the perturbation rotation angle in the RdmPreCdn. During the adaptation phase (trials 81–230), the absolute task-relevant error was initially close to the perturbation rotation angle, and then gradually reduced with the process of adaptation in both experimental conditions. The cursor angular error increased again when the constant rotation was suddenly removed (from trial 231), and then reduced with the process of washout (trials 231–310; Fig. 3A). Repeated-measures ANOVA with factors of experimental condition (2 levels) and trial order (15 levels, with each data point the average of 10 successive trials) was applied to the cursor angular error during the adaptation phase with constant perturbation (trials 81–230). This identified a significant effect of trial order (F(3.881,54.337) = 57.714, p < 0.001) and a significant interaction between trial order and experimental conditions (F(3.886,54.404) = 2.905, p = 0.031), with no main effect of the experimental condition (F(1,14) = 1.513, p = 0.239). Post hoc analysis showed that during the adaptation phase, more learning (difference in the average cursor error between the first 20 trials and the last 20 trials) was achieved with stable-world priming (StbPreCdn; 38.81° ± 2.84°) than with random-world priming (RdmPreCdn; (26.96° ± 3.04°, t(14) = 2.645, p = 0.019, paired t test). The same analysis applied to the data during the washout phase (trials 231–310), when the perturbation was removed, showed a significant effect of trial order (F(2.231,31.231) = 80.978, p < 0.001), but no significant effect of experimental condition (F(1,14) = 0.312, p = 0.585), or interaction between the experimental condition and trial order (F(2.379,33.311) = 1.185, p = 0.324), suggesting that the adaptation rate during the washout phase was similar for both experimental conditions.
Figure 3.
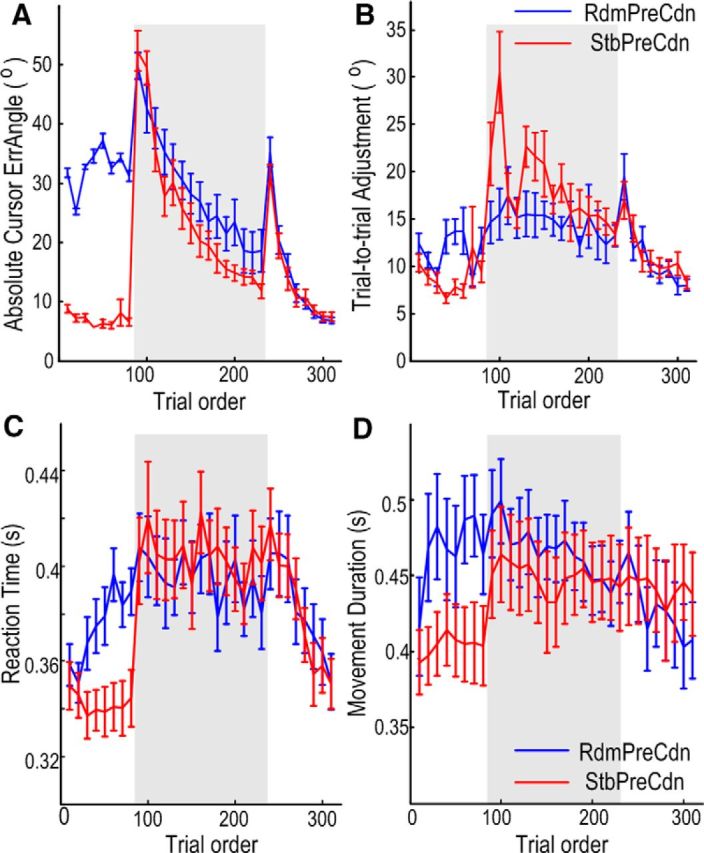
Adaptive behavior was modulated by priming error history. A, Absolute cursor error reduced with trial order when there was constant perturbation (trials 81–230), showing progressive adaptation in both experimental conditions. More adaptation was achieved during the adaptation phase (shaded area) in StbPreCdn. The rate of relearning was similar for the two experimental conditions in washout trials (trials 231–310). Each data point is the average of 10 successive trials; the solid lines and vertical bars show the mean and SEM across subjects. B, Interaction between experimental condition and the trial order on trial-to-trial adjustment. There was significantly increased trial-to-trial adjustment in StbPreCdn, especially at the beginning of the adaptation phase (trials 81–100). C, The reaction time and movement duration (D) were different during priming but were similar during adaptation and washout in the two experimental conditions.
Repeated-measures ANOVA was also applied to the adjustment in the actual initial movement that occurred between any two consecutive trials (henceforth referred to as “trial-to-trial adjustment”). This measurement is equated with motor variability, adaptation from trial to trial and action exploration. The latter case is a strategy used when sensorimotor transformation undergoes abrupt change, and is centrally driven and actively regulated to facilitate motor learning (Churchland et al., 2006; Wu et al., 2014). We observed that trial-to-trial adjustment during the adaptation phase (trials 81–230) was significantly modulated by experimental condition (F(1,14) = 7.755, p = 0.015) and trial order (F(5.646,79.049) = 2.833, p = 0.017; Fig. 3B). Post hoc analysis showed that there was more trial-to-trial adjustment in the first 20 trials of adaptation with stable-world priming (StbPreCdn; 26.18° ± 3.68°) than with random-world priming (RdmPreCdn; 15.09° ± 1.88°, t(14) = 2.771, p = 0.015); compatible with greater exploratory behavior when the large, constant perturbation angle was introduced following stable-world priming. In contrast, there was no difference in trial-to-trial adjustment in the last 20 trials of adaptation between the two conditions. The same analysis applied to the data during washout, when the perturbation was removed, showed a significant effect of trial order (F(3.071,42.988) = 12.830, p < 0.001), but no effect of experimental condition (F(1,14) = 0.058, p = 0.813), or interaction between experimental condition and trial order (F(3.130,43.816) = 1.442, p = 0.243). This suggests that the trial-to-trial adjustment during the washout phase was similar for both experimental conditions, with more adjustment earlier during this phase compared with later.
Similar analyses were applied to the reaction time and movement duration, and these showed significantly longer reaction time (F(1,14) = 27.760, p < 0.001) and movement duration (F(1,14) = 10.606, p = 0.006) in the first 80 trials in RdmPreCdn (during which there was random perturbation) compared with StbPreCdn (Fig. 3C,D). More importantly, the same analysis did not show any significant effect of experimental condition, or interaction between experimental condition and trial order on reaction time and movement duration during adaptation (trials 81–230) or washout (trials 231–310), suggesting that the reaction time and movement duration were similar during adaptation and washout for the two experimental conditions.
A Bayesian learning model identifies how expected uncertainty and estimation uncertainty are updated differently in the two experimental conditions
The estimated mean of the mismatch between the perturbation and response with the maximal probability from the Bayesian learning model (Fig. 4A for raw values, B for absolute values) offered a good fit to the observed response during adaption and washout measured in both conditions (Fig. 3A). The mean square root estimation errors during adaptation and washout were 12.18° ± 1.04° for RdmPreCdn and 10.85° ± 0.97° for StbPreCdn across subjects. The model revealed dissociation between expected uncertainty and the estimation uncertainty, and how they evolved with time in the different experimental conditions (Fig. 4C,D). All subjects completed 50 practice trials with no perturbations before the long experimental sessions. Therefore, in both experimental sessions, subjects started with low expected uncertainty in the environment and also low estimation uncertainty in the internal model. With random-world priming (RdmPreCdn), expected uncertainty increased with priming, and the estimation uncertainty also increased when random errors were first experienced. With further random priming, expected uncertainty plateaued and estimation uncertainty attributed to the internal model reduced (Fig. 2C, for single subject, D for across-subject average). Therefore, by the end of random-world priming (RdmPreCdn), the expected uncertainty was high (Fig. 4C), thus the switching of the perturbational rotation from random to constant did not greatly increase the estimated probability of a change-point, and there was minimal change in estimation uncertainty (Fig. 4D). In contrast, in the condition with stable-world priming (StbPreCdn), both the expected uncertainty and the estimation uncertainty were very low at the end of the first 80 trials without perturbation, and the sudden introduction of constant rotation triggered a marked increase in the estimated change-point probability and estimation uncertainty. At the end of the adaptation phase (trial 230), the expected uncertainty was low (Fig. 4C), with low estimation uncertainty (Fig. 4D), in both RdmPreCdn and StbPreCdn. When the constant perturbation was suddenly removed (trial 231 onward), both the estimated change-point probability and the estimation uncertainty increased in both experimental conditions.
Figure 4.

The Bayesian learning model helped to dissociate estimated mean (A, B), expected uncertainty (C) from the estimation uncertainty (D). The estimated mean (A for the raw values; B for the absolute values) with the maximal probability from the Bayesian learning model offered a good fit to the observed response during adaption and washout measured in both conditions (Fig. 3A). The model revealed how the two aspects of uncertainties; expected uncertainty in C and estimation uncertainty in D were differentially updated by new visual feedback after each trial in the different experimental conditions. A–D, Each data point is the average of 10 successive trials; the solid lines and vertical bars show the mean and SEM across 15 subjects. Multilevel linear modeling identified that the trial-to-trial adjustment positively correlated with estimation uncertainty (log transformed), independent from the experimental conditions (F, the scatter plot of an example subject with the solid and dotted lines show the regression line and the 95% confidence limits; correlation coefficient r = 0.459, p < 0.001 with data from both experimental conditions), whereas the expected uncertainty did not further contribute to the prediction of trial-to-trial adjustment (with the scatter plot of the same subject in E).
Expected uncertainty in the environment and uncertainty in feedforward estimations have contrasting behavioral effects
Multilevel linear modeling with both expected uncertainty with respect to the environment (log-transformed expected uncertainty) and uncertainty in feedforward estimations (log-transformed estimation uncertainty) as the predictors (Table 1, Model 1), was applied to trial-to-trial adjustment in both experimental conditions. This identified a significant effect of uncertainty in the feedforward estimation independent from experimental conditions (k = 2.24 ± 0.24, t(912) = 9.22, p < 0.0001), but no independent effect of the expected uncertainty (k = 0.514 ± 0.417, t(912) = 1.233, p = 0.2179). Correlation applied to data from individual subjects identified that the trial-to-trial adjustments positively correlated with estimation uncertainty in 13 of the 15 subjects, with r = 0.450 ± 0.042 across subjects. This relationship would be consistent with greater explorative behavior with increased estimation uncertainty as when confidence in the estimation from the current internal model is low. This is shown in a scatter plot for one typical subject (Fig. 4F). In contrast, there was no extra predictive power of expected uncertainty in predicting trial-to-trial adjustment consistent across both experimental conditions, as shown in Figure 4E for the same subject. Bivariate correlation was also applied to over-trial adjustment and expected uncertainty for RdmPreCdn and StbPreCdn separately. This showed significant correlation between over-trial adjustment and expected uncertainty in the stable priming condition in 12 of 15 subjects, with a correlation coefficient of 0.566 ± 0.062 (mean ± SE) across subjects. However, in the random priming condition, correlation was significant in only 2 of 15 subjects, with the mean correlation coefficient being 0.155 ± 0.047 across subjects. This suggests that expected uncertainty tends to guide responses only in relatively stable environments.
Table 1.
Multilevel linear models
| Model ID | Dependent variable | Model equation | Significant effects |
|---|---|---|---|
| 1 | Trial-to-trial adjustment | k1 × log(ExpUnc) + k2 × log(EstUnc) | k2 = 2.24 ± 0.24 |
| (t(912) = 9.22, p < 0.0001) | |||
| 2 | Reaction time, s | k1 × log(ExpUnc) + k2 × log(EstUnc) | k1 = 0.017 ± 0.0015 |
| (t(912) = 11.071, p < 0.0001) | |||
| k2 = 0.0112 ± 0.0013 | |||
| (t(912) = 8.717, p < 0.0001) | |||
| 3 | Movement duration, s | k1 × log(ExpUnc) + k2 × log(EstUnc) | k1 = 0.0087 ± 0.0028 |
| (t(912) = 3.057, p = 0.0023) | |||
| k2 = 0.0076 ± 0.0016 | |||
| (t(912) = 4.60, p < 0.0001) | |||
| 4 | PMBS | k11 × Error + k12 × Prime × Error + | k12 = −0.246 ± 0.0775 |
| k21 × Adjust + k22 × Prime × Adjust + | (t(909) = −3.175, p = 0.0015) | ||
| k31 × Rt + k32 × Prime × Rt + | k21 = −0.142 ± 0.0668 | ||
| k41 × Mt + k42 × Prime × Mt + | (t(909) = −2.122, p = 0.034) | ||
| k5 × Prime | |||
| 5 | PMBS | k11 × log(ExpUnc) + k12 × Prime × log(ExpUnc) + | k21 = −2.251 ± 0.540 |
| k21 × log(EstUnc) + k22 × Prime × log(EstUnc) + | (t(912) = −4.170, p < 0.0001) | ||
| k3 × Prime | |||
| 6 | PMBS | k1 × log(EstUnc) + k2 × Adjust + k3 × Error × Prime | k1 = −1.275 ± 0.444 |
| (t(910) = −2.867, p = 0.0042) | |||
| k3 = −0.204 ± 0.077 | |||
| (t(910) = −2.640, p = 0.0084) |
In the model equations, ExpUnc and EstUnc are expected uncertainty and the estimation uncertainty associated with the internal models, respectively. Error, Absolute cursor errors; Adjust, trial-to-trial adjustment; Rt, reaction time; Mt, movement duration. Prime is the experimental priming condition, with 0 indicating random-world priming and 1 for stable-world priming.
In contrast, reaction time and movement duration increased both with expected uncertainty and uncertainty in the feedforward estimation independent from experimental conditions. This was evidenced by multilevel linear modeling with log transformed expected uncertainty with respect to the environment and log-transformed uncertainty in feedforward estimation as the predictors, applied to reaction time and movement duration from both experimental conditions (Table 1, Models 2 and 3, respectively). Significant effects of both expected uncertainty in the environment (k = 0.017 ± 0.0015, t(912) = 11.071, p < 0.0001) and uncertainty in the feedforward estimation (k = 0.0112 ± 0.0013, t(912) = 8.717, p < 0.0001) were found for reaction time, with the increase in both expected uncertainty and estimation uncertainty leading to increased reaction time. The effects of both on movement duration were similar: movement duration increased with both greater expected uncertainty (k = 0.0087 ± 0.0028, t(912) = 3.057, p = 0.0023) and estimation uncertainty (k = 0.0076 ± 0.0016, t(912) = 4.60, p < 0.0001).
Suppression of PMBS correlates with estimation uncertainty and trial-to-trial adjustment
A relative decrease in EEG power across the beta frequency band (13–30 Hz) was consistently observed over contralateral sensorimotor cortex (C3Cz or C4Cz) during joystick movement. The decrease in power was followed by a rebound synchronization beginning at movement offset (Fig. 5A). This PMBS increased with stable-world priming and was significantly suppressed during the first 20 trials when constant perturbations were introduced after stable-world priming (StbPreCdn; Fig. 5B).
Figure 5.

Power spectra of EEG over sensorimotor cortex. A, Average power change relative to the average power of the whole session at different frequencies (aligned to movement offset at time 0, averaged across trials and then across the 15 subjects), at different phases within a session for both random-world priming condition (RdmPreCdn, top row) and stable-world priming condition (StbPreCdn, bottom row). B, Average power change in the beta band (13–30 Hz) for RdmPreCdn and StbPreCdn within different trial ranges in each condition (aligned to movement offset at time 0). Solid lines and shaded areas show the mean and SEM across 15 subjects. Purple stars show the time periods when paired t tests identified significant difference between StbPreCdn and RdmPreCdn with false detection rate correction for multiple comparisons. C, Experimental conditions have a significant effect on how PMBS changes with trial number during priming and adaptation. With stable-world priming, the PMBS increased during the priming phase, and dropped during trials 81–100 when constant perturbations were first introduced. During washout, the PMBS was low at the beginning and then re-established by the end of the session in both experimental conditions. Vertical and error bars show the mean and SEM, respectively. The purple double-asterisks show significant difference in PMBS between the two experimental conditions or trial blocks with p < 0.01.
Two-way ANOVA with factors of trial order (n = 2) and experimental conditions (n = 2) was applied to the average PMBS during the first 20 trials and the last 20 trials of priming for the two experimental conditions. This identified a significant effect of trial order (F(1,14) = 7.310, p = 0.017) on PMBS during priming. Even though the two-way ANOVA failed to show significant interaction between trial order and experimental condition (F(1,14) = 2.900, p = 0.111), paired t test revealed that the PMBS significantly increased with stable-world priming (14.64 ± 2.35% in the first 20 trials compared with 26.27 ± 3.10% in the last 20 trials, t(14) = −3.20, p = 0.006). In contrast, there was no significant increase in PMBS with random-world priming (15.35 ± 2.75% in the first 20 trials compared with 17.68 ± 2.79% in the last 20 trials, t(14) = −0.602, p = 0.557). This was accompanied by a marked reduction in estimation uncertainty with stable-world priming, but not with random-world priming (Fig. 4D).
Trials with no perturbation and absolute cursor errors <10° experienced between trials 21–80 during the random-priming period were selected. This provided 12–16 trials for each subject. The trials of corresponding trial order during the stable-priming period were also selected. Movement errors, estimation uncertainties, and average PMBS for these two subsamples were compared. The two subsamples had matching absolute movement errors (6.20° ± 0.30° compared with 6.09° ± 0.48°, t(14) = 0.164, p = 0.872), but different estimation uncertainty (log transformed, 7.39 ± 0.07 during RdmPreCdn compared with 3.10 ± 0.31 during StbPreCdn, t(14) = 14.423, p < 0.001). Paired t test applied to the PMBS in the two subsamples identified significantly lower PMBS during RdmPreCdn (24.35 ± 3.74) when estimation uncertainty was higher than the PMBS during StbPreCdn (36.04 ± 3.88, t(14) = 2.479, p = 0.027) with matched movement errors but lower estimation uncertainty. This analysis on the subsamples with matching movement errors confirmed that estimation uncertainty explained variation in PMBS independently of motor errors, at least when the motor errors were small.
Similar analysis was applied to the average PMBS during the first 20 trials and the last 20 trials of adaptation for the two experimental conditions. This identified a significant effect of trial order (F(1,14) = 6.953, p = 0.020) and a significant interaction between trial order and experimental conditions (F(1,14) = 7.019, p = 0.019; Fig. 5C). Thus, the experimental condition modulated how the PMBS changed with trial order during adaptation. This is despite other behavioral measurements including the reaction time and movement duration during these trials for the two experimental conditions being similar (Fig. 3C,D). Post hoc analysis with two-tailed paired t test showed that when constant perturbation was introduced after stable-world priming, the PMBS during the first 20 trials in adaptation (10.92 ± 3.34%) was significantly lower than that during the first 20 trials of adaptation after random-world priming (21.89 ± 2.42%, t(14) = 3.155, p = 0.007). However, by the end of adaptation, the average PMBS was similar in both experimental conditions (24.51 ± 2.74% vs 29.22 ± 4.25%, t(14) = −1.277, p = 0.222). In addition, compared with the average PMBS during the previous 20 trials, the PMBS during the first 20 trials of adaptation was also significantly reduced when the adaptation followed stable-world priming (26.27 ± 3.10% vs 10.92 ± 3.34%, t(14) = 3.397, p = 0.004). In contrast, when adaptation followed random-world priming, there was no change in PMBS when comparing the first 20 trials of adaptation and the last 20 trials of priming (17.68 ± 2.79% vs 21.89 ± 2.42%, t(14) = −1.562, p = 0.140). Furthermore, from the first 20 trials after the constant perturbation was introduced, we selected those trials with absolute movement errors between 45° and 65° for both experimental conditions, to have subsamples with matched movement error distributions. This provided 9–18 trials per experimental condition for each subject. Movement errors, estimation uncertainties, and average PMBS for these two subsamples were compared. The two subsamples from RdmPreCdn and StbPreCdn had matching absolute movement errors (52.00° ± 0.56° compared with 52.87° ± 0.51°, t(14) = 1.102, p = 0.289). The estimation uncertainty following the sudden increase in the size of perturbation was significantly higher for the subsample from StbPreCdn than for the subsample from RdmPreCdn (7.15 ± 0.31 compared with 6.32 ± 0.18, log transformed, t(14) = −2.732, p = 0.017). Paired t test identified a significantly lower PMBS in the subsample from StbPreCdn (19.24 ± 4.18) when the estimation uncertainty was higher, than the PMBS in the subsample from RdmPreCdn (30.27 ± 5.36, t(14) = 2.310, p = 0.037) with matched movement errors but lower estimation uncertainty. This analysis on the subsamples with matching movement errors confirmed that estimation uncertainty explained variation in PMBS independently of motor errors, even when the latter were large.
Analysis was also applied to the average PMBS during washout when the constant perturbation was removed. The removal of the constant perturbation triggered an increase in the estimation uncertainty, which then reduced with the process of washout (Fig. 4D). The ANOVA identified a significant effect of trial order (F(1,14) = 18.663, p = 0.001) on PMBS, but no effect of experimental condition (F(1,14) = 0.223, p = 0.644), or any interaction between the trial order and experimental condition (F(1,14) = 0.066, p = 0.801). When the constant perturbation was suddenly removed (at trial 231) and estimation uncertainty increased in both RdmPreCdn and StbPreCdn, this was accompanied by a reduction in PMBS during trials 231–250 in both conditions (12.95 ± 2.72% and 15.83 ± 4.10% for RdmPreCdn and StbPreCdn, respectively). PMBS increased with washout in both experimental conditions, with the PMBS increasing to 32.55 ± 5.50% (t(14) = 3.617, p = 0.003 comparing the beginning and the end of washout) in RdmRreCdn and to 33.59 ± 4.31% (t(14) = 3.062, p = 0.008 comparing the beginning and the end of washout) in StbPreCdn.
How the PMBS over the sensorimotor cortex changed over time within each session is shown in Figure 6A. Multilevel linear models with movement error, reaction time, trial-to-trial adjustment, and their interactions with experimental conditions as predictors were applied to the PMBS to investigate the effects of different behavioral measurements on the PMBS amplitude (Table 1, Model 4). This identified a significant interaction between movement error and experimental condition (k = −0.246 ± 0.0775, t(909) = −3.175, p = 0.0015), suggesting that large movement errors significantly correlated with lower PMBS, but only in the stable-world priming condition (StbPreCdn). Trial-to-trial adjustment also contributed to the prediction of PMBS (k = −0.142 ± 0.0668, t(909) = −2.122, p = 0.034) independent of experimental condition, with more trial-to-trial adjustment correlating with lower PMBS, perhaps as the latter indexed the need for greater exploratory behavior. Crucially, this suggests that PMBS changes are a product of the registration of movement errors as opposed to differences in other movement parameters such as reaction time and movement duration. Correlation applied to data from individual subjects confirmed that in the stable-world priming condition, there was significant negative correlation (p < 0.05) between movement errors and PMBS in 8 of the 15 subjects, with r = −0.312 ± 0.052 across subjects. In contrast, with random-world priming, significant correlation between movement error and PMBS was observed in only three subjects, and the correlation coefficient (r = −0.122 ± 0.062) was significantly lower than that in the stable-world priming condition (t(14) = 2.580, p = 0.022). The relationship between PMBS and movement error in different experimental conditions is shown in a scatter plot for one typical subject (Fig. 6B) and the distributions of the correlation coefficients for all subjects are shown in Figure 6C. There was no significant effect of reaction time (t(909) = −0.824, p = 0.410) or movement duration (t(909) = −1.145, p = 0.253) on the prediction of PMBS.
Figure 6.

PMBS over the sensorimotor cortex is modulated by error and uncertainty in the feedforward estimate. A, Experimental conditions modulated how PMBS changed with time within a session. With stable-world priming (StbPreCdn), PMBS rapidly increased with practice in the first 80 trials, suddenly dropped when constant perturbation was introduced (at trial 81) and was then re-established with the process of adaptation. With random-world priming (RdmPreCdn), there was no obvious drop when the rotation was changed from random to constant (at trial 81). Thereafter, there was a trend toward increasing PMBS with the process of adaptation (trials 81–230). When the constant rotation was removed (at trial 231), the PMBS dropped in both conditions and was then re-established as the subjects readapted to no rotation. The solid lines and vertical bars show the mean and SEM across 15 subjects. B, Scatter plot of PMBS against absolute cursor errors for one exemplar subject indicates a significant negative correlation between PMBS and absolute error with stable-world priming only. Solid and dotted lines show the regression lines and their 95% confidence limits for the two conditions separately. C, Boxplots of the correlation coefficients between the PMBS and absolute error for different experimental conditions for all subjects. *Indicates significant difference in the correlation coefficients. D, Scatter plot of PMBS against expected uncertainty in the environment (log transformed) for an exemplar subject shows no correlation between PMBS and expected uncertainty (log transformed) within or across experimental conditions. E, Scatter plot of PMBS against uncertainty in the feedforward estimate (log transformed) for the same exemplar subject shows a negative correlation between PMBS and uncertainty in the feedforward estimate within and across experimental conditions. Solid and dotted lines show the regression line and the 95% confidence limits for data across both conditions (n = 62), because the multilevel modeling identified no effect of experimental condition on the relationship between PMBS and estimation uncertainty. F, Boxplots of the correlation coefficients between the PMBS and the two types of uncertainties pooling data from both experimental conditions for all subjects. *Indicates significant difference in the correlation coefficients.
Multilevel linear models with expected uncertainty in the environment, uncertainty in the feedforward estimation and their interactions with experimental condition as predictors were also applied to the PMBS to investigate their effects (Table 1, Model 5). This identified a significant effect of estimation uncertainty (k = −2.251 ± 0.540, t(912) = −4.170, p < 0.0001) independent of experimental condition, but no effect of expected uncertainty (k = 0.858 ± 0.902, t(912) = 0.902, p = 0.367) on PMBS. These findings indicate that increased uncertainty in feedforward estimation predicts lower PMBS. Correlation applied to data from individual subjects confirmed that the PMBS negatively correlated with estimation uncertainty in 8 of the 15 subjects, with r = −0.216 ± 0.041 across subjects. In contrast, the correlation between PMBS and expected uncertainty was observed in only two subjects, and the correlation coefficient (r = −0.121 ± 0.043) was significantly lower than that between PMBS and estimation uncertainty (t(14) = 3.842, p = 0.002). The relationships between PMBS and expected uncertainty and estimation uncertainty are shown in scatter plots for one typical subject (Fig. 6D,E) and the distributions of the correlation coefficients for all subjects are shown in Figure 6F.
Finally, multiple predictors, including experimental condition, trial-to-trial adjustment, absolute cursor error and uncertainty in feedforward estimation were included in a single model for the prediction of PMBS to define correlations that persisted after controlling for the effects of different variables (Model 6). Critically, the correlation between PMBS and uncertainty in feedforward estimation proved independent of experimental condition and the other factors included in the model (k = −1.275 ± 0.444, t(910) = −2.867, p = 0.0042). The effect of absolute errors in StbPreCdn (k = −0.204 ± 0.077, t(910) = −2.640, p = 0.0084) also survived, whereas the correlation between PMBS and trial-to-trial adjustment was lost (k = 0.138 ± 0.079, t(912) = 1.751, p = 0.0803). Therefore, the correlation between PMBS and uncertainty in feedforward estimation could not be accounted for by other factors that may vary between experimental conditions. In comparison, the significant correlation between PMBS and trial-to-trial adjustment was lost when estimation uncertainty was considered, consistent with a model whereby estimation uncertainty modulates PMBS, which in turn leads to trial-to-trial adjustment due to exploratory behavior.
Discussion
We have shown that the history of task-relevant errors in human sensorimotor control modulates expected uncertainty in the external environment and estimation uncertainty associated with the feedforward predictions from the internal model, consistent with Bayes' theorem (Nassar et al., 2012; Gonzalez Castro et al., 2014; McGuire et al., 2014). This, in turn, modulates the confidence in the internal model and drives adaptive behavior. Crucially, we have shown that the amplitude of the PMBS over the sensorimotor cortex negatively correlated with the uncertainty in feedforward estimations derived from the internal model, with this correlation accounting for that between trial-to-trial exploratory adjustment and the PMBS. These results suggest that the PMBS may reflect neural processes related to Bayesian inference in sensorimotor integration. Specifically, the PMBS indexes the relative confidence in feedforward estimations.
Neural representation of uncertainty
Neural representations of uncertainty, especially uncertainty arising from incomplete or biased prior knowledge, have recently received considerable attention. Brain imaging studies have shown that the level of uncertainty due to lack of information in decision making during action selection positively correlates with activation in the amygdala and orbitofrontal cortex (Hsu et al., 2005). Additionally, increased activation of the prefrontal, parietal and insular cortices has been observed with increasing uncertainty in action selection (Huettel et al., 2005). Electrophysiological studies indicate that firing rates of single neurons in rodent orbitofrontal cortex index the confidence in this decision (Kepecs et al., 2008). More recent work in humans has confirmed activities in multiple brain areas, including the amygdala, putamen, insula, anterior cingulate cortex, posterior parietal cortex, and ventromedial prefrontal cortex in response to increased estimation uncertainty during adaptive learning (Behrens et al., 2007; Vilares et al., 2012; O'Reilly et al., 2013; McGuire et al., 2014). Neurochemically, noradrenaline has been proposed to signal uncertainties arising from gross changes in the environment, which lead to sensory observations that violate top-down estimations (Yu and Dayan, 2005). Phasic increases in noradrenaline levels may be associated with the pupillary dilation observed when estimation uncertainty increases (Nassar et al., 2012). Together these findings suggest that the evaluation of confidence in prior beliefs may be a fundamental and ubiquitous component of decision-making, and important for regulating behavioral adaptation.
The Bayesian framework provides a plausible interpretation of motor behavior, and the above studies provide candidate anatomical and pharmacological substrates for its implementation. However, hitherto there has been no convincing evidence that uncertainty is represented in direct readouts of neural activity on a trial-to-trial basis in humans. Here we report that the level of oscillatory synchrony in the beta band over the sensorimotor cortex serves as an index of confidence in feedforward estimation in sensorimotor control. Such feedforward estimations are essential for optimal feedback control (Scott, 2012) and visuomotor adaptation (Franklin and Wolpert, 2011), and thereby lie at the heart of a wide range of motor behaviors. Optimal behavior based on feedforward predictions, however, must also take into account the associated uncertainties. This is the first study to identify a robust neural correlate of the trial-to-trial update of estimation uncertainty in healthy motor control. Whether this is a neural manifestation of Bayesian inference and evaluation per se, or due to the effect of this process on the sensorimotor system remains to be determined. However, it has recently been suggested that accumulated evidence leading to perceptual decision making is continuously represented in the motor system (Selen et al., 2012). Additionally, uncertainty has been shown to modulate human corticospinal excitability, thereby biasing motor output during action preparation (Bestmann et al., 2008). These observations challenge the traditional view that processes underlying decision making are separable from, and causally antecedent to action generation (Bestmann et al., 2008; Kubanek and Kaplan, 2012).
The functional role of beta oscillations in the sensorimotor system
Beta oscillations are a dominant feature of the sensorimotor system and are evident across the cortical-basal ganglia network. Our results reconcile two opposing views that relate the PMBS primarily to either motor output (Engel and Fries, 2010) or sensory processing functions (Cassim et al., 2001). We suggest that cortical beta band synchronization is related to processes exercising Bayesian inference in sensorimotor integration. The processing of new sensory information leads to updating of the estimation uncertainty associated with the current feedforward model and thereby determines revision or maintenance of the existing motor plan. A decrease in the PMBS following consistent and large sensory errors indexes high uncertainty and low confidence in current feed forward estimations, which potentially then allows for more flexibility and revision of motor plans. Nevertheless, although elevated beta synchrony, as in the PMBS, has been frequently posited as promoting motor inflexibility and the status quo, causal evidence for this remains scant (Gilbertson et al., 2005; Engel and Fries, 2010; Brittain and Brown, 2014). A Bayesian interpretation by which the PMBS indexes confidence in priors is consistent with the observation that the propagation of beta oscillations in the sensorimotor system can mediate the transfer of behaviorally relevant information (Rubino et al., 2006). It is also in line with the recent theory proposing that oscillations in the beta frequency band can convey top-down signals about behavioral context (Bressler and Richter, 2015; Friston et al., 2015).
Implications for disease
Cortical PMBS is reduced in patients with Parkinson's disease (Pfurtscheller et al., 1998; Tamás et al., 2003). According to our proposed theory, an attenuation of the PMBS implies uncertainty in feedforward estimations and would engender more reliance on sensory feedback and a greater variability of movement. Consistent with our theory, Parkinson's disease patients rely heavily on visual guidance during reaching and grasping movements (Jackson et al., 1995; Majsak et al., 1998), and typically also find it easier to initiate externally evoked rather than internally evoked movements (Siegert et al., 2002; Torres et al., 2011). In addition, patients fail to reduce motor variability with repeated movements (Sheridan et al., 1987; Martin et al., 1994), and have difficulty in performing learned movements automatically (Wu and Hallett, 2005).
The characteristically attenuated PMBS in Parkinson's disease implies that the basal ganglia may normally play a role in modulating the PMBS. The basal ganglia are in an ideal position to integrate afferent information and corollary motor discharge because they receive inputs from a wide range of cortical areas. Computational models have stressed the role of the basal ganglia in Bayesian inference and action selection (Bogacz and Gurney, 2007), and a recent study showed increased information flow from the subthalamic nucleus to the sensorimotor cortex in a visuomotor adaptation task following consistent and large errors which invalidated the internal model (Tan et al., 2014b).
Potential limitations and concluding remarks
The current study has some potential limitations. First, the experimental design is based on the comparison of behavior and EEG between two experimental conditions, with the visual feedback of the movement during the priming phase being either veridical or random. It would be interesting to see how behavior and the PMBS changes with different degrees of randomness in the priming phase. However, this would require multiple adaptation sessions for the same subject, and the results might be confounded by saving and interference effects between different adaptation sessions. Second, different processes have been identified in visuomotor adaptation (Huberdeau et al., 2015) and the awareness of visual rotation may prompt employment of different processes and strategies in visuomotor adaptation (Werner et al., 2015). Our study was not able to control for potential additional processes triggered by the different experimental conditions, although it is noteworthy that reaction time and movement duration did not differ between the conditions in the adaptation and washout phases, suggesting that motor strategies were relatively consistent during these phases in the two conditions. Furthermore, our paradigm was not well designed to dissociate whether the uncertainty associated with the estimated mean perturbation and that associated with the estimated variance of the perturbation (or expected uncertainty as it is referred to here) have dissociable effects on behavior and on the PMBS. In addition, although mixed-level modeling identified estimation uncertainty as having predictive power with respect to PMBS that was independent of trial-to-trial adjustment, the current paradigm was not itself designed to dissociate trial-to-trial adjustment and estimation uncertainty, which correlate with one another. Last, what we observed here is correlational. Further studies that modulate PMBS by transcranial alternating current stimulation and studies on patients who have impaired PMBS are required to provide further evidence for the causal effect of PMBS in motor control.
With the above provisos in mind, we have shown that the PMBS in healthy human sensorimotor cortex is modulated by the history of task-relevant errors, and correlates negatively with the estimation uncertainty associated with feedforward predictions. This, in turn, has consequences for motor adaptive performance, consistent with Bayes' theorem. These results suggest that PMBS could serve as an index of confidence in feedforward estimations in sensorimotor control. Further investigation is warranted to establish whether the cortical PMBS reflects activity in more distributed subcortico-cortical circuits, and if, when deranged, contributes to motor impairments.
Footnotes
This work was supported by the Medical Research Council, and performed in the NIHR Cognitive Health Clinical Research Facility, Oxford. We thank Dr Jill O'Reilly for discussions on writing the paper.
The authors declare no competing financial interests.
This is an Open Access article distributed under the terms of the Creative Commons Attribution License Creative Commons Attribution 4.0 International, which permits unrestricted use, distribution and reproduction in any medium provided that the original work is properly attributed.
References
- Aarts E, Verhage M, Veenvliet JV, Dolan CV, van der Sluis S. A solution to dependency: using multilevel analysis to accommodate nested data. Nat Neurosci. 2014;17:491–496. doi: 10.1038/nn.3648. [DOI] [PubMed] [Google Scholar]
- Alegre M, Labarga A, Gurtubay IG, Iriarte J, Malanda A, Artieda J. Beta electroencephalograph changes during passive movements: sensory afferences contribute to beta event-related desynchronization in humans. Neurosci Lett. 2002;331:29–32. doi: 10.1016/S0304-3940(02)00825-X. [DOI] [PubMed] [Google Scholar]
- Alegre M, Alvarez-Gerriko I, Valencia M, Iriarte J, Artieda J. Oscillatory changes related to the forced termination of a movement. Clin Neurophysiol. 2008;119:290–300. doi: 10.1016/j.clinph.2007.10.017. [DOI] [PubMed] [Google Scholar]
- Behrens TE, Woolrich MW, Walton ME, Rushworth MF. Learning the value of information in an uncertain world. Nat Neurosci. 2007;10:1214–1221. doi: 10.1038/nn1954. [DOI] [PubMed] [Google Scholar]
- Bestmann S, Harrison LM, Blankenburg F, Mars RB, Haggard P, Friston KJ, Rothwell JC. Influence of uncertainty and surprise on human corticospinal excitability during preparation for action. Curr Biol. 2008;18:775–780. doi: 10.1016/j.cub.2008.04.051. [DOI] [PMC free article] [PubMed] [Google Scholar]
- Bogacz R, Gurney K. The basal ganglia and cortex implement optimal decision making between alternative actions. Neural Comput. 2007;19:442–477. doi: 10.1162/neco.2007.19.2.442. [DOI] [PubMed] [Google Scholar]
- Bressler SL, Richter CG. Interareal oscillatory synchronization in top-down neocortical processing. Curr Opin Neurobiol. 2015;31:62–66. doi: 10.1016/j.conb.2014.08.010. [DOI] [PubMed] [Google Scholar]
- Brittain JS, Brown P. Oscillations and the basal ganglia: motor control and beyond. Neuroimage. 2014;85:637–647. doi: 10.1016/j.neuroimage.2013.05.084. [DOI] [PMC free article] [PubMed] [Google Scholar]
- Cassim F, Monaca C, Szurhaj W, Bourriez JL, Defebvre L, Derambure P, Guieu JD. Does post-movement beta synchronization reflect an idling motor cortex? Neuroreport. 2001;12:3859–3863. doi: 10.1097/00001756-200112040-00051. [DOI] [PubMed] [Google Scholar]
- Churchland MM, Afshar A, Shenoy KV. A central source of movement variability. Neuron. 2006;52:1085–1096. doi: 10.1016/j.neuron.2006.10.034. [DOI] [PMC free article] [PubMed] [Google Scholar]
- Engel AK, Fries P. Beta-band oscillations: signalling the status quo? Curr Opin Neurobiol. 2010;20:156–165. doi: 10.1016/j.conb.2010.02.015. [DOI] [PubMed] [Google Scholar]
- Faisal AA, Selen LP, Wolpert DM. Noise in the nervous system. Nat Rev Neurosci. 2008;9:292–303. doi: 10.1038/nrn2258. [DOI] [PMC free article] [PubMed] [Google Scholar]
- Franklin DW, Wolpert DM. Computational mechanisms of sensorimotor control. Neuron. 2011;72:425–442. doi: 10.1016/j.neuron.2011.10.006. [DOI] [PubMed] [Google Scholar]
- Friston K. The free-energy principle: a unified brain theory? Nat Rev Neurosci. 2010;11:127–138. doi: 10.1038/nrn2787. [DOI] [PubMed] [Google Scholar]
- Friston KJ, Bastos AM, Pinotsis D, Litvak V. LFP and oscillations-what do they tell us? Curr Opin Neurobiol. 2015;31:1–6. doi: 10.1016/j.conb.2014.05.004. [DOI] [PMC free article] [PubMed] [Google Scholar]
- Gilbertson T, Lalo E, Doyle L, Di Lazzaro V, Cioni B, Brown P. Existing motor state is favored at the expense of new movement during 13–35 Hz oscillatory synchrony in the human corticospinal system. J Neurosci. 2005;25:7771–7779. doi: 10.1523/JNEUROSCI.1762-05.2005. [DOI] [PMC free article] [PubMed] [Google Scholar]
- Gonzalez Castro LN, Hadjiosif AM, Hemphill MA, Smith MA. Environmental consistency determines the rate of motor adaptation. Curr Biol. 2014;24:1050–1061. doi: 10.1016/j.cub.2014.03.049. [DOI] [PMC free article] [PubMed] [Google Scholar]
- Hsu M, Bhatt M, Adolphs R, Tranel D, Camerer CF. Neural systems responding to degrees of uncertainty in human decision-making. Science. 2005;310:1680–1683. doi: 10.1126/science.1115327. [DOI] [PubMed] [Google Scholar]
- Huberdeau DM, Krakauer JW, Haith AM. Dual-process decomposition in human sensorimotor adaptation. Curr Opin Neurobiol. 2015;33:71–77. doi: 10.1016/j.conb.2015.03.003. [DOI] [PubMed] [Google Scholar]
- Huettel SA, Song AW, McCarthy G. Decisions under uncertainty: probabilistic context influences activation of prefrontal and parietal cortices. J Neurosci. 2005;25:3304–3311. doi: 10.1523/JNEUROSCI.5070-04.2005. [DOI] [PMC free article] [PubMed] [Google Scholar]
- Jackson SR, Jackson GM, Harrison J, Henderson L, Kennard C. The internal control of action and Parkinson's disease: a kinematic analysis of visually-guided and memory-guided prehension movements. Exp Brain Res. 1995;105:147–162. doi: 10.1007/BF00242190. [DOI] [PubMed] [Google Scholar]
- Jenkinson N, Brown P. New insights into the relationship between dopamine, beta oscillations and motor function. Trends Neurosci. 2011;34:611–618. doi: 10.1016/j.tins.2011.09.003. [DOI] [PubMed] [Google Scholar]
- Kepecs A, Uchida N, Zariwala HA, Mainen ZF. Neural correlates, computation and behavioural impact of decision confidence. Nature. 2008;455:227–231. doi: 10.1038/nature07200. [DOI] [PubMed] [Google Scholar]
- Knight FH. Risk, uncertainty and profit. Boston: Houghton Mifflin; 1921. [Google Scholar]
- Knill DC, Pouget A. The Bayesian brain: the role of uncertainty in neural coding and computation. Trends Neurosci. 2004;27:712–719. doi: 10.1016/j.tins.2004.10.007. [DOI] [PubMed] [Google Scholar]
- Körding KP, Wolpert DM. Bayesian integration in sensorimotor learning. Nature. 2004;427:244–247. doi: 10.1038/nature02169. [DOI] [PubMed] [Google Scholar]
- Kubanek J, Kaplan DM. Evidence for a decision variable in the human motor system. J Neurosci. 2012;32:8110–8111. doi: 10.1523/JNEUROSCI.1813-12.2012. [DOI] [PMC free article] [PubMed] [Google Scholar]
- Magezi DA. Linear mixed-effects models for within-participant psychology experiments: an introductory tutorial and free, graphical user interface (LMMgui) Front Psychol. 2015;6:2. doi: 10.3389/fpsyg.2015.00002. [DOI] [PMC free article] [PubMed] [Google Scholar]
- Majsak MJ, Kaminski T, Gentile AM, Flanagan JR. The reaching movements of patients with Parkinson's disease under self-determined maximal speed and visually cued conditions. Brain. 1998;121:755–766. doi: 10.1093/brain/121.4.755. [DOI] [PubMed] [Google Scholar]
- Martin KE, Phillips JG, Iansek R, Bradshaw JL. Inaccuracy and instability of sequential movements in Parkinson's disease. Exp Brain Res. 1994;102:131–140. doi: 10.1007/BF00232445. [DOI] [PubMed] [Google Scholar]
- McGuire JT, Nassar MR, Gold JI, Kable JW. Functionally dissociable influences on learning rate in a dynamic environment. Neuron. 2014;84:870–881. doi: 10.1016/j.neuron.2014.10.013. [DOI] [PMC free article] [PubMed] [Google Scholar]
- Nassar MR, Wilson RC, Heasly B, Gold JI. An approximately Bayesian delta-rule model explains the dynamics of belief updating in a changing environment. J Neurosci. 2010;30:12366–12378. doi: 10.1523/JNEUROSCI.0822-10.2010. [DOI] [PMC free article] [PubMed] [Google Scholar]
- Nassar MR, Rumsey KM, Wilson RC, Parikh K, Heasly B, Gold JI. Rational regulation of learning dynamics by pupil-linked arousal systems. Nat Neurosci. 2012;15:1040–1046. doi: 10.1038/nn.3130. [DOI] [PMC free article] [PubMed] [Google Scholar]
- O'Reilly JX. Making predictions in a changing world-inference, uncertainty, and learning. Front Neurosci. 2013;7:105. doi: 10.3389/fnins.2013.00105. [DOI] [PMC free article] [PubMed] [Google Scholar]
- O'Reilly JX, Schüffelgen U, Cuell SF, Behrens TE, Mars RB, Rushworth MF. Dissociable effects of surprise and model update in parietal and anterior cingulate cortex. Proc Natl Acad Sci U S A. 2013;110:E3660–E3669. doi: 10.1073/pnas.1305373110. [DOI] [PMC free article] [PubMed] [Google Scholar]
- Pfurtscheller G, Pichler-Zalaudek K, Ortmayr B, Diez J, Reisecker F. Postmovement beta synchronization in patients with Parkinson's disease. J Clin Neurophysiol. 1998;15:243–250. doi: 10.1097/00004691-199805000-00008. [DOI] [PubMed] [Google Scholar]
- Pinheiro J, Bates D, Debroy S, Sarkar D, R Core team . nlme: linear and nonlinear mixed effects models. Vienna, Austria: R Foundation for Statistical Computing; 2008. [Google Scholar]
- Rubino D, Robbins KA, Hatsopoulos NG. Propagating waves mediate information transfer in the motor cortex. Nat Neurosci. 2006;9:1549–1557. doi: 10.1038/nn1802. [DOI] [PubMed] [Google Scholar]
- Scott SH. The computational and neural basis of voluntary motor control and planning. Trends Cogn Sci. 2012;16:541–549. doi: 10.1016/j.tics.2012.09.008. [DOI] [PubMed] [Google Scholar]
- Selen LP, Shadlen MN, Wolpert DM. Deliberation in the motor system: reflex gains track evolving evidence leading to a decision. J Neurosci. 2012;32:2276–2286. doi: 10.1523/JNEUROSCI.5273-11.2012. [DOI] [PMC free article] [PubMed] [Google Scholar]
- Shadmehr R, Smith MA, Krakauer JW. Error correction, sensory prediction, and adaptation in motor control. Annu Rev Neurosci. 2010;33:89–108. doi: 10.1146/annurev-neuro-060909-153135. [DOI] [PubMed] [Google Scholar]
- Sheridan MR, Flowers KA, Hurrell J. Programming and execution of movement in Parkinson's disease. Brain. 1987;110:1247–1271. doi: 10.1093/brain/110.5.1247. [DOI] [PubMed] [Google Scholar]
- Siegert RJ, Harper DN, Cameron FB, Abernethy D. Self-initiated versus externally cued reaction times in Parkinson's disease. J Clin Exp Neuropsychol. 2002;24:146–153. doi: 10.1076/jcen.24.2.146.991. [DOI] [PubMed] [Google Scholar]
- Swann N, Tandon N, Canolty R, Ellmore TM, McEvoy LK, Dreyer S, DiSano M, Aron AR. Intracranial EEG reveals a time- and frequency-specific role for the right inferior frontal gyrus and primary motor cortex in stopping initiated responses. J Neurosci. 2009;29:12675–12685. doi: 10.1523/JNEUROSCI.3359-09.2009. [DOI] [PMC free article] [PubMed] [Google Scholar]
- Tamás G, Szirmai I, Pálvölgyi L, Takáts A, Kamondi A. Impairment of post-movement beta synchronisation in parkinson's disease is related to laterality of tremor. Clin Neurophysiol. 2003;114:614–623. doi: 10.1016/S1388-2457(02)00424-8. [DOI] [PubMed] [Google Scholar]
- Tan H, Jenkinson N, Brown P. Dynamic neural correlates of motor error monitoring and adaptation during trial-to-trial learning. J Neurosci. 2014a;34:5678–5688. doi: 10.1523/JNEUROSCI.4739-13.2014. [DOI] [PMC free article] [PubMed] [Google Scholar]
- Tan H, Zavala B, Pogosyan A, Ashkan K, Zrinzo L, Foltynie T, Limousin P, Brown P. Human subthalamic nucleus in movement error detection and its evaluation during visuomotor adaptation. J Neurosci. 2014b;34:16744–16754. doi: 10.1523/JNEUROSCI.3414-14.2014. [DOI] [PMC free article] [PubMed] [Google Scholar]
- Todorov E. Optimality principles in sensorimotor control. Nat Neurosci. 2004;7:907–915. doi: 10.1038/nn1309. [DOI] [PMC free article] [PubMed] [Google Scholar]
- Torres EB, Heilman KM, Poizner H. Impaired endogenously evoked automated reaching in Parkinson's disease. J Neurosci. 2011;31:17848–17863. doi: 10.1523/JNEUROSCI.1150-11.2011. [DOI] [PMC free article] [PubMed] [Google Scholar]
- Vilares I, Howard JD, Fernandes HL, Gottfried JA, Kording KP. Differential representations of prior and likelihood uncertainty in the human brain. Curr Biol. 2012;22:1641–1648. doi: 10.1016/j.cub.2012.07.010. [DOI] [PMC free article] [PubMed] [Google Scholar]
- Wei K, Körding K. Uncertainty of feedback and state estimation determines the speed of motor adaptation. Front Comput Neurosci. 2010;4:11. doi: 10.3389/fncom.2010.00011. [DOI] [PMC free article] [PubMed] [Google Scholar]
- Werner S, van Aken BC, Hulst T, Frens MA, van der Geest JN, Strüder HK, Donchin O. Awareness of sensorimotor adaptation to visual rotations of different size. PLoS One. 2015;10:e0123321. doi: 10.1371/journal.pone.0123321. [DOI] [PMC free article] [PubMed] [Google Scholar]
- Wolpert DM, Miall RC. Forward models for physiological motor control. Neural Netw. 1996;9:1265–1279. doi: 10.1016/S0893-6080(96)00035-4. [DOI] [PubMed] [Google Scholar]
- Wu HG, Miyamoto YR, Gonzalez Castro LN, Ölveczky BP, Smith MA. Temporal structure of motor variability is dynamically regulated and predicts motor learning ability. Nat Neurosci. 2014;17:312–321. doi: 10.1038/nn.3616. [DOI] [PMC free article] [PubMed] [Google Scholar]
- Wu T, Hallett M. A functional MRI study of automatic movements in patients with Parkinson's disease. Brain. 2005;128:2250–2259. doi: 10.1093/brain/awh569. [DOI] [PubMed] [Google Scholar]
- Yu AJ, Dayan P. Uncertainty, neuromodulation, and attention. Neuron. 2005;46:681–692. doi: 10.1016/j.neuron.2005.04.026. [DOI] [PubMed] [Google Scholar]