

Abstract
The hippocampus is critical to the memory for sequences of events, a defining feature of episodic memory. However, the fundamental neuronal mechanisms underlying this capacity remain elusive. While considerable research indicates hippocampal neurons can represent sequences of locations, direct evidence of coding for the memory of sequential relationships among nonspatial events remains lacking. To address this important issue, we recorded neural activity in CA1 as rats performed a hippocampus-dependent sequence-memory task. Briefly, the task involves the presentation of repeated sequences of odors at a single port and requires rats to identify each item as “in sequence” or “out of sequence”. We report that, while the animals' location and behavior remained constant, hippocampal activity differed depending on the temporal context of items—in this case, whether they were presented in or out of sequence. Some neurons showed this effect across items or sequence positions (general sequence cells), while others exhibited selectivity for specific conjunctions of item and sequence position information (conjunctive sequence cells) or for specific probe types (probe-specific sequence cells). We also found that the temporal context of individual trials could be accurately decoded from the activity of neuronal ensembles, that sequence coding at the single-cell and ensemble level was linked to sequence memory performance, and that slow-gamma oscillations (20–40 Hz) were more strongly modulated by temporal context and performance than theta oscillations (4–12 Hz). These findings provide compelling evidence that sequence coding extends beyond the domain of spatial trajectories and is thus a fundamental function of the hippocampus.
SIGNIFICANCE STATEMENT The ability to remember the order of life events depends on the hippocampus, but the underlying neural mechanisms remain poorly understood. Here we addressed this issue by recording neural activity in hippocampal region CA1 while rats performed a nonspatial sequence memory task. We found that hippocampal neurons code for the temporal context of items (whether odors were presented in the correct or incorrect sequential position) and that this activity is linked with memory performance. The discovery of this novel form of temporal coding in hippocampal neurons advances our fundamental understanding of the neurobiology of episodic memory and will serve as a foundation for our cross-species, multitechnique approach aimed at elucidating the neural mechanisms underlying memory impairments in aging and dementia.
Keywords: electrophysiology, episodic memory, hippocampus, rats, sequence memory, temporal context
Introduction
The ability to remember temporal relationships among events or stimuli is fundamental to perception, cognition, and adaptive behavior across species (Mauk and Buonomano, 2004; Buhusi and Meck, 2005; Allen and Fortin, 2013; Merchant et al., 2013). This type of temporal organization is also an essential feature of episodic memory, as the memory for individual events includes information about the order in which they occurred during an experience (Eichenbaum and Fortin, 2005; Ranganath and Ritchey, 2012; Allen and Fortin, 2013; Eichenbaum, 2014; Davachi and DuBrow, 2015). Based on its unique neural architecture, several prominent models have proposed that a fundamental function of the hippocampus is to code for sequences of inputs or events (McNaughton and Morris, 1987; Levy, 1996; Tsodyks et al., 1996; Lisman, 1999; Howard et al., 2005, 2014; Foster and Knierim, 2012), a view supported by considerable research showing that hippocampal neurons can encode sequences of spatial locations (Skaggs and McNaughton, 1996; Skaggs et al., 1996; Mehta et al., 2000, 2002; Dragoi and Buzsáki, 2006; Foster and Wilson, 2006, 2007; Karlsson and Frank, 2009; Gupta et al., 2010, 2012; Mehta, 2015). However, many of our memories share the same location and, although it is well established that the hippocampus plays a critical role in the memory for nonspatial sequential relationships (Agster et al., 2002; Fortin et al., 2002; Kesner et al., 2002; Ekstrom and Bookheimer, 2007; Jenkins and Ranganath, 2010), we have little insight into the neural mechanisms supporting this capacity.
Recent recording studies have discovered patterns of hippocampal activity associated with the passage of time over shorter (Pastalkova et al., 2008; Gill et al., 2011; MacDonald et al., 2011, 2013; Naya and Suzuki, 2011) or longer timescales (Manns et al., 2007; Mankin et al., 2012). While these findings may provide a framework for keeping track of how much time has elapsed between events, they do not offer a clear mechanism for coding sequential or ordinal relationships among rapidly unfolding series of events. Instead, a potential mechanism is suggested by accumulating evidence of context-specific activity in hippocampal neurons. In fact, similar to the well documented finding that hippocampal neurons can differentially code for the same location, depending on the trial type or trajectory performed (Frank et al., 2000; Wood et al., 2000; Ferbinteanu and Shapiro, 2003; Bower et al., 2005; Smith and Mizumori, 2006), we hypothesized that hippocampal neurons can differentially code for the same items, depending on the sequence position in which they occurred.
To test this hypothesis, we recorded neural activity in hippocampal region CA1 as rats performed a nonspatial sequence memory task that shows strong behavioral parallels in rats and humans (Allen et al., 2014, 2015) and depends on the hippocampus in both species (Quirk et al., 2013; Boucquey et al., 2014). More specifically, rats were presented with repeated sequences of odors in a single odor port and were required to make a judgment as to whether each item was presented “in sequence” (InSeq) or “out of sequence” (OutSeq). Neural activity was analyzed in three sessions of interest (Well-Trained, Novel1, Novel2), which differed by the amount of training received on the sequence and thus resulted in different levels of sequence memory performance. We observed distinct patterns of hippocampal activity, depending on whether items were presented InSeq or OutSeq. This nonspatial sequence coding was present at the level of individual neurons, neuronal ensembles, and local field potentials (LFPs), and paralleled sequence memory performance across sessions. In addition to providing strong support for the view that sequence coding is a fundamental function of the hippocampus, these findings provide evidence of a novel form of context-specific activity by which memories that share item and location information could be disambiguated or organized based on their distinctive temporal context (Howard and Kahana, 2002; Eichenbaum, 2014; Howard et al., 2014).
Materials and Methods
Subjects.
Five male Long–Evans rats, weighing ∼350 g at the beginning of the experiment, served as subjects. Rats were individually housed and maintained on a 12 h light/dark cycle. Rats had ad libitum access to food, but access to water was limited to 2–10 min each day, depending on how much water they received as reward during behavioral training (3–6 ml). On weekends, rats received full access to water for ≥12 h to ensure adequate overall hydration. Hydration levels were monitored daily. All procedures were conducted in accordance with the Institutional Animal Care and Use Committee.
Equipment and stimuli.
Subjects were tested in a quiet experimental room with automated equipment capable of repeated deliveries of multiple distinct odors in a single odor port (Fig. 1A). The apparatus consisted of a linear track (length, 150 cm; width, 9 cm), with walls angled outward (30° from vertical; height, 40 cm). The odor port, located on one end of the track, was equipped with photobeam sensors to precisely detect nose entries and was connected to an odor delivery system (Med Associates). Two water ports were used for reward delivery: one located under the odor port, the other at the opposite end of the track. Timing boards (Plexon) and digital input/output devices (National Instruments) were used to measure response times and control the hardware. All aspects of the task were automated using custom Matlab scripts (MathWorks). A 96-channel Multichannel Acquisition Processor (MAP; Plexon) was used to interface with the hardware in real time and record the behavioral and electrophysiological data.
Figure 1.

Sequence memory task design and performance. Neural activity was recorded as rats performed the cross-species sequence memory task we recently developed, which shows strong behavioral parallels in rats and humans (Allen et al., 2014). Briefly, this hippocampus-dependent task involves repeated presentations of sequences of nonspatial items (odors) and requires subjects to determine whether each item is presented InSeq or OutSeq. Importantly, this nonspatial approach allows us to specifically focus on the temporal demands of the task (by holding spatial location and motor behavior constant) and use different types of probe trials to shed light on underlying sequence representations and cognitive processes. A, Apparatus and behavioral design. Using an automated odor delivery system (left), rats were presented with series of five odors delivered in the same odor port. In each session, the same sequence was presented multiple times (right), with approximately half the presentations including all items InSeq (ABCDE) and the other half including one item OutSeq (e.g., ABDDE). Each odor presentation was initiated by a nosepoke and rats were required to correctly identify the odor as either InSeq (by holding their nosepoke response until the signal at 1.2 s) or OutSeq (by withdrawing their nosepoke before the signal; <1.2 s) to receive a water reward. B, Experimental timeline (top). Rats were trained preoperatively on Sequence 1 (Seq1; ABCDE) until they reached asymptotic performance. Subsequently, neural activity in region CA1 was recorded while rats continued to be tested on Seq1 for a few sessions, followed by sessions testing a novel sequence (Seq2: VWXYZ). We focused our analyses on three recording sessions per animal: the session with the strongest (Well-Trained; Seq1) and weakest (Novel1; first session on Seq2) levels of sequence memory performance, as well as a session exhibiting intermediate levels of performance (Novel2; second session on Seq2). Example performance from a representative rat on each of the three recording sessions of interest (bottom). Main bar graphs show the mean nosepoke duration on InSeq and OutSeq items, whereas inset plots show the same data sorted by ordinal position in the sequence (x-axis) and by item (color). The color of individual circles represents the correct sequence position for each odor presentation: first sequence position in light blue (A or V), second in brown (B or W), third in green (C or X), fourth in purple (D or Y), and fifth in orange (E or Z). Bars represent the median nosepoke duration for each sequence position (filled bar, InSeq; open bar, OutSeq; n's indicated by values on bars). These data indicate that the rat reliably differentiated between InSeq and OutSeq items in the Well-Trained session but not in Novel1, with moderate levels of performance in Novel2 (performance levels approximating group means shown in C). Note that only InSeq items (A or V) were presented on the first sequence position. C, Group performance on the three recording sessions of interest (Well-Trained, Novel1, and Novel2). We used a sequence memory index (SMI; Allen et al., 2014; see Materials and Methods) to collapse the behavioral data of each session into a single normalized measure of sequence memory performance. An SMI value of 1 represents perfect performance (correctly holding on all InSeq items and correctly withdrawing on all OutSeq items), while 0 represents chance performance (identical ratio of hold and withdraw responses for InSeq and OutSeq items). Rats exhibited strong, weak, and intermediate levels of sequence memory performance across the three sessions. *, Significant t test; ns, nonsignificant t test; G*, significant G test; Gns, nonsignificant G test; Q*, significant quadratic fit across sessions.
Odors consisted of synthetic food extracts contained in glass jars (A, lemon; B, rum; C, anise; D, vanilla; E, banana; V, almond; W, cinnamon; X, coconut; Y, peppermint; Z, strawberry) that were volatilized with desiccated, charcoal-filtered air (flow rate, 2 L/min). To prevent cross-contamination, separate Teflon tubing lines were used for each odor. These lines converged in a single channel at the bottom of the odor port. In addition, an air vacuum located at the top of the odor port provided constant negative pressure to quickly evacuate odor traces. Readings from a volatile organic compound detector confirmed that odors were cleared from the port 500–750 ms after odor delivery (interodor intervals were limited by software to ≥800 ms).
Behavior.
The sequence task (Fig. 1A; Allen et al., 2014) involves repeated presentations of sequences of nonspatial items (odors) and requires subjects to determine whether each item is presented InSeq (by holding the nosepoke response until the signal) or OutSeq (by withdrawing the response before the signal). In the present study, we used five-item sequences and focused on two types of OutSeq probe trials (repeats and skips; see below). In each session, a given odor sequence (e.g., Seq1: ABCDE) was presented 30–50 times, with approximately half the presentations including all items InSeq (ABCDE) and half including one item OutSeq (e.g., the first D in ABDDE). Each odor presentation was initiated by a nose poke (provided 800 ms had elapsed since the previous odor) and was terminated after the rat either held for 1.2 s (signaled by a beep) or pulled his nose out. Water rewards were delivered below the odor port after correct responses (10 μl) and at the opposite end of the track following correct completion of a full sequence (20 μl). Following an incorrect response, a buzzing sound was emitted and the sequence was terminated. To enhance the segmentation between each odor sequence (completed correctly or not), rats were required to run to the end of the track opposite the odor port before the next sequence could be presented.
Training.
Naive rats were initially trained in a series of incremental stages over ∼6–8 weeks. First, each rat was trained to nosepoke and hold his nose in the odor port for a water reward. The minimum required nosepoke duration started at 50 ms and was gradually increased (in 15 ms steps) until rats held reliably for 1.2 s and reached a criterion of 80% correct nosepokes over three sessions (100–200 nosepokes per session). Rats were then habituated to odor presentations in the port (Odor A, then Odors AB) and required to maintain their nosepoke response for 1.2 s to receive a reward (∼3 sessions). Second, rats were trained to identify InSeq and OutSeq items. Rats were initially trained on a two-item sequence in which they were presented with “AB” and “AA” sequences in equal proportions. While the correct response on the first odor was to hold for >1.2 s (Odor A was always the first item), the second response required rats to determine whether the second item was InSeq (AB; hold for >1.2 s to receive reward) or OutSeq (AA; withdraw before 1.2 s to receive reward). After reaching criterion on the two-item sequence, the number of items per sequence was increased to three, four, and five in successive stages (criterion: >80% correct across all individual odor presentations over three sessions). After reaching criterion performance on the five-item sequence (>80% correct on both InSeq and OutSeq items), rats underwent surgery for microdrive implantation.
OutSeq probe trials.
Our previous work included a detailed analysis of performance across different types of OutSeq items in rats and humans, which suggested that similar cognitive processes and sequence representations support task performance across species (Allen et al., 2014). However, to maximize sampling, the present study included only two types of OutSeq items: repeats, in which an earlier item was presented a second time in the sequence (e.g., ABADE), and skips, in which an item was presented too early in the sequence (e.g., ABDDE, which skipped over item C). Note that OutSeq items could be presented in any sequence position except the first (i.e., sequences always began with an InSeq item).
Surgery.
Rats received a preoperative injection of the analgesic buprenorphine (0.02 mg/kg, s.c.) ∼10 min before induction of anesthesia. General anesthesia was induced using isoflurane (induction: 4%; maintenance: 1–2%) mixed with oxygen (800 ml/min). After being placed in the stereotaxic apparatus, rats were administered glycopyrrulate (0.5 mg/kg, s.c.) to help prevent respiratory difficulties. A protective ophthalmic ointment was then applied to their eyes and their scalp was locally anesthetized with marcaine (7.5 mg/ml, 0.5 ml, s.c.). Body temperature was monitored and maintained throughout surgery and a Ringer's solution with 5% dextrose was periodically administered to maintain hydration (total volume of 5 ml, s.c.). The skull was exposed following a midline incision and adjustments were made to ensure the skull was level. Six support screws (four titanium, two stainless steel) and a ground screw (stainless steel; positioned over the cerebellum) were anchored to the skull. A piece of skull ∼3 mm in diameter (centered on coordinates: −4.0 mm anteroposterior, 3.5 mm mediolateral) was removed over the left hippocampus. Quickly after the dura was carefully removed, the base of the microdrive was lowered onto the exposed cortex, the cavity was filled with Kwik-Sil (World Precision Instruments), the ground wire was connected, and the microdrive was secured to the support skull screws with dental cement. Each tetrode was then advanced ∼900 μm into the brain. Finally, the incision was sutured and dressed with Neosporin and rats were returned to a clean cage, where they were monitored until they awoke from anesthesia. One day following surgery, rats were given an analgesic (flunixin, 2.5 mg/kg, s.c.) and Neosporin was reapplied to the incision site.
Electrophysiological recordings.
Spiking activity and LFPs were recorded from the CA1 pyramidal layer of the dorsal hippocampus as rats performed the task (Fig. 2). Each chronically implanted microdrive contained 20 independently drivable tetrodes, with each tetrode consisting of four twisted nichrome wires (13 μm diameter; California Fine Wire) gold-plated to achieve a final tip impedance of ∼250 kΩ (measured at 1 kHz). Following the surgical recovery period, tetrodes were slowly advanced over a period of ∼3 weeks while monitoring established electrophysiological signatures of the CA1 pyramidal cell layer (e.g., sharp waves, ripples, and theta amplitude). Recording sessions began when sufficiently large ensembles of neurons (>∼40) could be recorded simultaneously.
Figure 2.

Electrophysiological recordings. Spiking activity and local field potentials (LFP) were recorded from the dorsal CA1 region of the hippocampus during task performance. All well-isolated neurons (713 neurons from 13 sessions) were included in the analyses. Raw LFP traces were filtered for 4–12 Hz band (theta) and 20–40 Hz band [beta or low gamma range; labeled slow-gamma here according to Colgin et al. (2009)]. A, Example activity from simultaneously recorded neurons (putative principal neurons and interneurons) and LFPs (theta and slow-gamma bands) during one sequence presentation. Inset plots show expanded snapshots of theta and slow-gamma oscillations during an odor presentation. B, Scatterplot showing the distribution of putative principal neurons and interneurons across the three sessions of interest (Well-Trained, Novel1, Novel2). The majority (84%) of isolated neurons were classified as putative principal neurons (599 principal neurons, 114 interneurons; see Materials and Methods). Importantly, the principal-to-interneuron ratio and the size of simultaneously recorded neuronal ensembles were consistent across sessions. Inset plot shows representative mean waveforms recorded from the same tetrode (dark gray, pyramidal neurons; light gray, interneurons). C, Example 3-D cluster plot of spike amplitude across wires showing nine simultaneously recorded neurons on a single tetrode. D, Sample histology slice showing the range of tetrode tip locations (3 tip locations shown; red circles). Tetrodes were targeted at the location denoted by the CA1 label (anteroposterior, −4.0 mm; mediolateral, 3.5 mm). Less than 10% of the tetrodes were located near or in the CA2 region.
Voltage signals recorded from the tetrode tips were referenced to a ground screw positioned over the cerebellum, and differentially filtered for single-unit activity (SUA; 154 Hz to 8.8 kHz) and LFPs (1.5–400 Hz). The neural signals were then amplified (SUA: 10,000–32,000×; LFP: 1000×), digitized (SUA: 40 kHz; LFP: 1 kHz), and recorded to disk with the data acquisition system (MAP, Plexon). Action potentials from individual neurons were manually isolated off-line using a combination of standard waveform features across the four channels of each tetrode (Offline Sorter, Plexon). Proper isolation was verified using interspike interval distributions for each isolated unit (assuming a minimum refractory period of 1 ms) and cross-correlograms for each pair of simultaneously recorded units on the same tetrode. Putative pyramidal neurons and interneurons were identified by previously identified characteristic firing rates and valley-to-peak spike widths (Csicsvari et al., 1998, 1999; Mizuseki and Buzsáki, 2013) and sorted through a minimum variance algorithm using multivariate Euclidean distances (linkage and cluster functions in Matlab2013a; Fig. 2B). Both types of neurons were included in our analyses. To confirm recording sites, current was passed through the electrodes before perfusion (0.9% PBS followed by 4% paraformaldehyde) to produce small marking lesions, which were subsequently localized on Nissl-stained tissue slices (Fig. 2D).
Sequence memory performance analyses.
Performance on the task can be analyzed using a number of measures (Allen et al., 2014). In the present study, within-session performance was analyzed using continuous (nosepoke duration) and categorical (expected vs observed frequencies) measures (Fig. 1B). Nosepoke duration analyses used paired t tests to determine whether the rat held his response significantly longer on InSeq than OutSeq trials. G tests were used to determine whether the observed frequency of InSeq and OutSeq responses for a given session (or trial type) was significantly different than the frequency expected by chance. Note that the G test provides a measure of performance that controls for response bias and is a robust alternative to the χ2 test, especially for datasets that include cells with smaller frequencies (Sokal and Rohlf, 1995).
To compare performance across sessions or animals, we calculated a sequence memory index (SMI; Allen et al., 2014, their Eq. 1) as shown in the following equation:
 |
In essence, the SMI normalizes the proportion of InSeq and OutSeq items presented during a session and reduces sequence memory performance to a single value ranging from −1 to 1. A score of 1 represents perfect sequence memory, in which a subject would have correctly held his nosepoke response on all InSeq items and correctly withdrawn on all OutSeq items. A score of 0 indicates chance performance, such as if subjects responded to InSeq and OutSeq items with the same response pattern (e.g., holding until the signal 80% of the time regardless of the trial type). Negative SMI scores represent performance levels below that expected by chance. We have previously found that SMI is a normally distributed measure (Allen et al., 2014, 2015) and used Q–Q plots to confirm that the present data also closely followed a normal distribution. Thus, we used traditional (parametric) t tests and ANOVAs for SMI statistical comparisons. One-sample t tests were used to perform comparisons with chance levels, repeated-measures ANOVAs were used to compare performance across sessions (Well-Trained, Novel1, and Novel2), and quadratic regression analyses were used to test parallels between neural activity and performance levels across sessions. Tests were considered significant at p < 0.05 and significant trends were noted when p < 0.10.
Single-cell analyses.
We analyzed single-cell activity using resampling, nonparametric statistics (1000 permutations; Sokal and Rohlf, 1995; McKenzie et al., 2013; Neunuebel and Knierim, 2014), as spiking activity often violates the assumptions of normality and homogeneity of variance required for traditional (parametric) statistics. To capture the bursting firing properties of hippocampal neurons while limiting the number of statistical comparisons performed, we first binned the firing rate of each neuron over 50 ms and then segmented this activity into 250 ms windows to perform the statistical analyses (each 250 ms window contained five firing-rate values for that neuron). For each comparison of interest (e.g., InSeq trials vs OutSeq trials), we calculated the t or F ratio for each 250 ms activity window separately (e.g., the two 250 ms windows preceding port withdrawal) and then determined the probability of obtaining a ratio this large (or larger) by random sampling. This probability distribution was created by randomly permuting bins and trials within the same 250 ms activity window and calculating the associated t or F ratio (a process that was repeated 1000 times). A comparison was considered statistically significant if this probability was <0.05 (Bonferroni corrected for the number of 250 ms activity windows included in the comparison). Our primary analyses compared activity across temporal context (InSeq vs OutSeq), but the same approach was used for secondary analyses comparing activity across odors and sequence positions (see Fig. 4, four contrasts) or probe types (repeats vs skips; see Fig. 5).
Figure 4.

General and conjunctive sequence coding. To identify potential subtypes, the activity of each sequence cell was examined across four different contrasts: InSeq versus OutSeq trials (C1), InSeq trials sorted by odor (C2), OutSeq trials sorted by Odor (C3), and OutSeq trials sorted by ordinal position in the sequence (C4). The activity of four example neurons (one per column) is shown here across the four contrasts (rows) to illustrate some of the observed subtypes. Shaded area in rasters represents odor-sampling durations on individual trials. Perievent time histograms show mean firing rates across all trials (±1 SEM), binned over 50 ms with minimal smoothing. Note that activity to the first odor of each sequence (A or V when presented InSeq) is not shown because it would introduce running-related activity before the nosepoke, making the plots more difficult to interpret. A, General sequence cells (60% of sequence cells) fired differentially to the overall InSeq/OutSeq status of items without apparent selectivity for the specific odors presented or the sequence positions in which they occurred (significant t test on C1, but nonsignificant ANOVAs on C2–C4). For instance, the left column shows an example of a neuron that significantly increased its firing rate on InSeq trials without clear selectivity across odors presented (compare rows 1, 2; InSeq cell). The right column shows a different neuron, in this case a putative interneuron, which significantly increased its firing rate on OutSeq trials but showed little selectivity for the odor presented or the sequence position in which it occurred (compare rows 1, 3, 4; OutSeq cell). B, Conjunctive sequence cells (40% of sequence cells) showed selectivity for specific conjunctions of item and sequence position information. Subtypes of conjunctive cells were identified according to which contrast (in addition to C1) yielded a statistically significant ANOVA. The first subtype (25% of conjunctive cells) exhibited differential activity when specific odors were presented InSeq (significant ANOVA on C2, but not on C3 or C4). For instance, the left column displays an example neuron for which the increased firing rate to InSeq items (Row 1) was primarily driven by a specificity to Odor B when presented InSeq (Row 2). The same neuron was virtually silent on OutSeq trials (Rows 3 and 4). Conversely, other conjunctive cells primarily coded for specific mismatches between item and sequence position information. In fact, the second subtype (46.9% of conjunctive cells) exhibited differential activity when specific odors were presented OutSeq (significant ANOVA on C3, but not on C2 or C4). For instance, the right column displays an example for which the higher activity on OutSeq trials (Row 1) was primarily driven by selectivity to Odor V when presented OutSeq (Row 3), with a nonsignificant influence of the sequence position in which it was presented (Row 4). The third subtype (37.5% of conjunctive cells) fired differentially when specific ordinal positions in the sequence included OutSeq items (significant ANOVA on C4, but not on C2 or C3; data not shown). *, Significant t test or ANOVA within 500 ms window indicated by bar (Bonferroni corrected for two 250 ms bins).
Figure 5.

Probe-type-specific activity. Statistical analyses revealed that a proportion of sequence cells (34.5%) fired differentially across the two types of OutSeq probe trials (repeats and skips; Allen et al., 2014). Briefly, repeats consist of OutSeq trials in which an earlier item is presented a second time in the sequence (e.g., ABA), whereas skips are OutSeq trials in which an item is presented too early in the sequence (e.g., ABD, which skips over item C). The left column shows an example OutSeq cell selective for repeats (35% of probe-specific sequence cells) and the right column shows an example OutSeq cell exhibiting preferential firing to skips (65% of probe-specific sequence cells). As in Figure 3 and 4, rasters display neural activity for a subset of InSeq trials but perievent histograms (mean firing rate ± SEM) and statistical analyses include all trials. *, Significant t test within 500 ms window indicated by bar (Bonferroni corrected for two 250 ms bins).
For each neuron that reached statistical significance, we visually inspected the pattern of activity across trials using perievent rasters and histograms (Fig. 3A,B). The number of statistically significant cells was then compiled in each session. Note that the neural activity of each session was analyzed independently and that no attempts were made to track the same neurons across sessions for a given rat. As neurons could have been resampled between sessions, for each cell category we report cell counts and the corresponding percentage (in relation to the total number of neurons active during task performance). Since we focused on periods of neural activity during which the animals' location and behavior was constant (500 ms window preceding port withdrawal, unless specified otherwise), the spatial distribution (X-Y coordinates) of spikes was not different across trial types and thus not described in further details here.
Figure 3.

Nonspatial sequence coding in hippocampal neurons was linked to sequence memory performance. A–C, Single-unit analyses revealed that, while the animals' nose remained in the port, many individual hippocampal neurons fired differentially, depending on the temporal context of the odor presented (whether it was presented InSeq or OutSeq). The majority (73.8%) of these cells (“sequence cells”) exhibited significantly higher firing rates on odors presented OutSeq compared with InSeq (A, example cell), while the others showed the opposite pattern of activity (26.2%; B, example cell). Rasters (top) display spikes (ticks) and odor-sampling periods (shading) on individual trials. Perievent time histograms (bottom) show mean firing rates across all trials (±SEM), binned over 50 ms with minimal smoothing. Note that rasters display equivalent numbers of InSeq and OutSeq trials for clarity but that histograms and statistical analyses (permutation tests; see Materials and Methods) included all trials with odor-sampling periods of ≥500 ms. C, The prevalence of sequence cells was positively associated with performance levels. Many sequence cells were observed when animals performed well in the task (3× the proportion expected by chance on Well-Trained and Novel2 sessions), but the proportion of such cells was no greater than expected by chance when animals showed poor memory for the sequence (Novel1). This parallel with performance was confirmed by a significant quadratic fit of the magnitude of sequence-cell coding (t ratios of all cells on InSeq vs OutSeq test) across the three sessions. D–F, Activity from ensembles of simultaneously recorded neurons strongly differentiated between InSeq and OutSeq items (D, example ensemble). E, Hierarchical clustering analyses revealed that the top two clusters of ensemble activity vectors in multidimensional space (and only clustering to reach statistical significance) reflected the InSeq/OutSeq status of trials. F, k-means leave-one-out clustering analyses showed that the proportion of trials accurately decoded as InSeq or OutSeq was also positively associated with performance. More specifically, k-means leave-one-out classification accuracy was higher on sessions with strong sequence memory performance (Well-Trained and Novel2) than on sessions with weak sequence memory (Novel1) and was correlated with behavioral performance (data not shown). Error bars indicate ±1 SEM. *, Significant t test within 500 ms window indicated by bar (Bonferroni corrected for two 250 ms bins). **, Significant clusters. Q*, Significant quadratic fit across sessions.
To help quantify the amount of information provided by individual cells about the InSeq/OutSeq status of odors, we adapted previous measures of information content used in spatial (Skaggs et al., 1993) and temporal processing (MacDonald et al., 2013). The sequential information content of each cell was calculated with the following equation:
 |
Where PIN is the probability of an InSeq trial, POUT is the probability of an OutSeq trial, λIN is the firing rate of the cell during InSeq trials, λOUT is the firing rate of the cell during OutSeq trials, and λ̂ is the overall mean firing rate of the cell during odor-sampling periods. A value of 0 bit indicates that the activity of a given cell provides no information about the InSeq/OutSeq status of trials, while a value of 1 bit indicates that it can be fully determined by the activity of that cell.
Ensemble analyses.
To analyze the pattern of ensemble activity across InSeq and OutSeq trials, we created an N × M ensemble activity matrix for each animal and session (N, number of simultaneously recorded neurons; M, number of trials). For each trial (M: trial1 to trialm), the raw firing rate of each neuron during the 500 ms odor-sampling period preceding port withdrawal was calculated (N: neuron1 to neuronn). Note that the firing rate was averaged over the full 500 ms period, instead of being binned over 50 ms and analyzed as two separate 250 ms activity windows as in the single-cell analyses. Therefore, for each trial, the raw firing rate of all simultaneously recorded neurons produced a population activity vector in N-dimensional space (where N is the number of simultaneously recorded neurons). Neurons that did not fire >1 Hz on any of the individual odor presentations were excluded from the analysis. As in our single-cell analyses, the activity of each session was analyzed independently and no attempts were made to track the same neurons across sessions for any of the rats. Ensemble analyses were first performed using raw firing rates and repeated using z-normalized firing rates. Raw and normalized data produced the same pattern of results.
We first used standard correlational methods to quantify the similarity of population activity vectors across trials (Mankin et al., 2012; MacDonald et al., 2013). While this approach provides a simple and intuitive quantification of the overlap across population vectors, it may not be particularly suited for our experimental design as we expect all vectors to be highly correlated because the location and behavior of the animal are held constant across trials. Therefore, we then used hierarchical agglomerative clustering algorithms (linkage and cluster functions in Matlab2013 using Ward's method as a minimum variance algorithm) to determine whether the InSeq/OutSeq status of each trial could be accurately decoded from the activity of simultaneously recorded neurons (Manns and Eichenbaum, 2009; McKenzie et al., 2014). More specifically, the population activity vectors of each trial from an ensemble activity matrix were sorted into a hierarchy of binary clusters that minimized the within-cluster variance (sum of squares) between constituent population vectors and the cluster centroids. Classification accuracy was evaluated by determining the degree to which the top two clusters corresponded to InSeq and OutSeq trials (using percentage of trials correctly classified). Next, we performed a leave-one-out cross-validated k-means analysis in which the population activity vector of each trial is categorized using the activity from all other trials. More specifically, one trial was removed from the ensemble, a k-means analysis (k = 2) was performed on the remaining data, and the trial was assigned to one of the two clusters based on Euclidean distance from the cluster centers (this process was repeated for each trial). Statistical significance for decoding accuracy was established using a resampling approach similar to that used in our single-cell analyses. Specifically, the trial labels for the ensemble matrix were permuted 1000 times and, for each permutation, the classifier algorithm was rerun and classification accuracy recalculated to compute the probability of obtaining an accuracy value this large (or larger) by this random shuffling of the ensemble activity. Decoding accuracy was considered statistically significant if this probability was <0.05.
LFP analyses.
Perievent spectrograms were used to visualize LFP activity during task performance (NeuroExplorer v5.0, Nex Technologies). To capture odor-related and sequence-related shifts in the power of oscillations at different frequencies throughout entire sequences, seven separate 4 s perievent spectrograms were produced for each rat and session (five centered on each port entry, one immediately before and after the sequence; see Fig. 6A) using tetrodes with confirmed sequence cell activity. To compare LFP activity across InSeq and OutSeq items, separate spectrograms were produced for InSeq and OutSeq trials, and these spectrograms were then subtracted from each other to produce a difference spectrogram for each rat and session.
Figure 6.
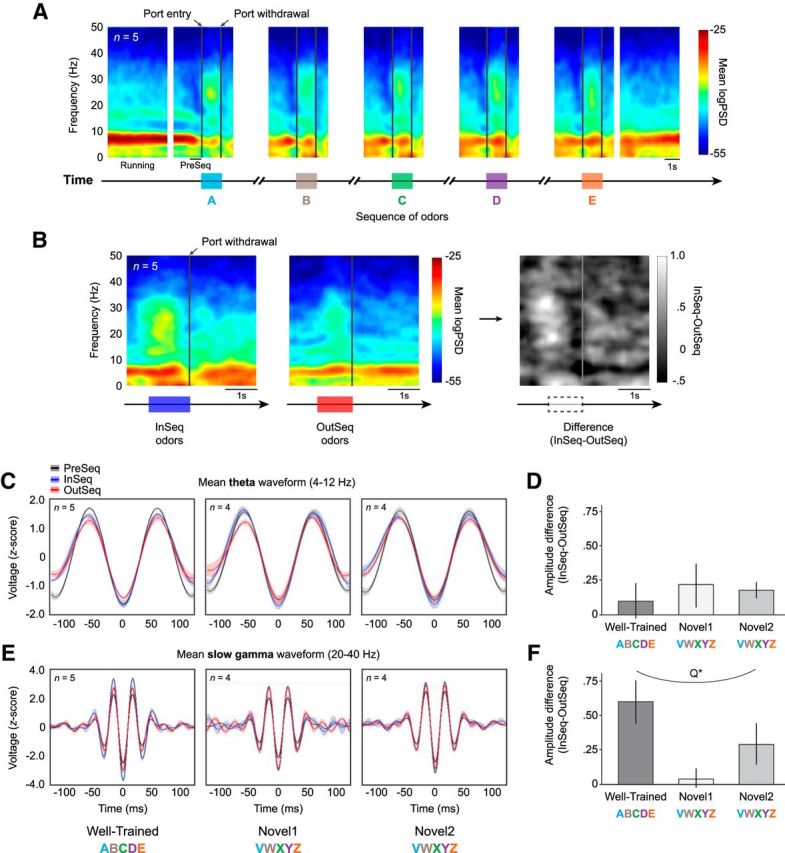
Slow-gamma, but not theta, oscillations were modulated by the temporal context (InSeq/OutSeq) of items. A, Group PESG for all completed sequences, displayed in successive 4 s blocks aligned across trials and animals. The PESG shows a reliable shift between theta (4–12 Hz) and slow-gamma (20–40 Hz) oscillations during task performance. Although clear theta oscillations were observed during odor sampling, theta power was strongest during the running bouts between sequences. Conversely, slow-gamma oscillations were strongest during odor-sampling periods. The same pattern was also apparent at the level of individual rats or sequence presentations (data not shown). B, Group PESGs for InSeq odors (left), OutSeq odors (middle), and InSeq–OutSeq difference (right). Slow-gamma power was higher on InSeq than OutSeq trials, but theta power showed no clear modulation by the temporal context of odors. C, D, Theta amplitude was similar between InSeq and OutSeq trials across sessions. C, Mean theta waveforms (z-score normalized amplitude ±SEM) during InSeq and OutSeq trials (500 ms preceding port withdrawal), with PreSeq period shown for comparison (500 ms preceding presentation of first odor). D, Mean differences in z-score normalized theta ampitude (±SEM) between InSeq and OutSeq trials. E, F, Significant differences in slow-gamma amplitude were observed between InSeq and OutSeq trials across sessions. E, Mean slow-gamma waveforms (z-score normalized amplitude ± SEM) during InSeq and OutSeq trials, with PreSeq period showed for comparison. F, Mean differences in z-score normalized slow-gamma ampitude (±SEM) between InSeq and OutSeq trials were associated with performance levels across sessions (significant quadratic fit). Q*, Significant quadratic fit.
We focused our analyses on the 4–12 Hz band (theta) and 20–40 Hz band [beta or low gamma range; labeled slow-gamma here to be consistent with Colgin et al. (2009)], as our spectrograms showed high power in those bands at the level of individual sequence presentations, individual rats, and group. To explore differences in the amplitude of these frequency bands, LFPs were bandpass filtered (Butterworth) and phase determined with a Hilbert transform (Brandon et al., 2013). For each session and animal, the mean waveform for each frequency band was then obtained by aligning snippets of the filtered LFP signals in 250 ms windows (centered on the trough, or 0° phase) and averaging all z-score normalized waveforms together (Csicsvari et al., 1998, 1999; Patel et al., 2012). To quantify task-related effects, averaging was restricted to the relevant time periods (PreSeq: 500 ms period preceding the first port entry; InSeq or OutSeq: 500 ms preceding port withdrawal; see Fig. 6C,E) and the mean absolute amplitude (average of amplitude values at 0 and 180°; trough and peak, respectively) was calculated for each average waveform. The mean absolute amplitude was compared across conditions using difference scores. Paired sample t tests were used to test for significant differences.
Results
Strong, weak, and intermediate levels of sequence memory performance across sessions
Our analyses focused on three sessions across animals (Well-Trained, Novel1, Novel2; Fig. 1B,C), which differed by the amount of training associated with the sequence presented. In the Well-Trained session, rats were tested on the sequence they learned before surgery (Seq1: ABCDE) and continued to correctly identify items as InSeq or OutSeq at a high rate. In fact, according to a previously established measure (SMI; Allen et al., 2014), rats showed strong sequence memory in that session (SMIWell-Trained: 0.51 ± 0.05; mean ± SEM; SMIWell-Trained vs Chance: t(4) = 9.57, p < 0.001; Fig. 1C), a performance level comparable to that previously reported in unoperated rats (SMI, 0.47; Allen et al., 2014). In addition, single-subject analyses showed that each rat significantly differentiated between InSeq and OutSeq items (all G test P's < 0.001) and that each rat demonstrated memory for the full sequence, as this effect was observed at each ordinal position in the sequence (all positional G tests P's < 0.05; Fig. 1B, left).
Subsequently, rats were tested on a novel sequence (Seq2: VWXYZ) for two daily sessions and demonstrated weak (Novel1) and intermediate (Novel2) levels of performance. As expected, sequence memory was weakest in the Novel1 session (SMINovel1, 0.09 ± 0.05) with none of the rats individually performing above chance levels (all G test P's > 0.10). However, some learning had occurred by the end of the session (second half of trials: mean, 80 trials per rat), as suggested by a trend toward significance for SMI comparisons with chance levels (SMINovel1 vs Chance: t(3) = 1.76, p = 0.089) and the fact that the more powerful G test combining accuracy data from all rats reached significance (GNovel1(1) = 4.74, p < 0.01). In the Novel2 session, rats showed significant levels of sequence memory (SMINovel2 = 0.28 ± 0.05; SMINovel2 vs Chance: t(3) = 5.17, p < 0.001) with each rat individually performing above-chance levels (G test P's < 0.05). While later sequence positions were sampled less often (since sequences were terminated after incorrect responses), it is important to note that animals performed significantly above chance on all sequence positions in the Well-Trained and Novel2 sessions (positional G test P's < 0.05). SMI analyses across sessions confirmed that sequence memory performance was associated with the amount of training (F(2,12) = 17.57, p < 0.001; quadratic fit: F(2,12) = 8.053, p < 0.01; Fig. 1C), a pattern captured by the representative rat shown in Figure 1B. Overall, these findings indicate that rats exhibited strong, weak, and intermediate levels of sequence memory across the three sessions of interest.
Ensemble characteristics were similar across sessions
Spiking and LFP activity was recorded from the CA1 region during task performance (Fig. 2). A few marking lesions were observed near the CA2 border (<10% of tetrodes), raising the possibility that a small proportion of the CA1 cells reported here were from the CA2. While this proportion is too small for examining potential subfield differences, it is important to note that the patterns of activity we observed were well distributed across tetrode locations. One rat was excluded from the Novel1 and Novel2 sessions because of damage to his microdrive. We isolated a total of 713 single units from 13 sessions (five rats in Well-Trained, four in Novel1, four in Novel2) using conventional multidimensional cluster sorting techniques. Neurons were then classified as putative principal neurons or interneurons according to previously established firing-rate and waveform characteristics (Csicsvari et al., 1998, 1999; Mizuseki and Buzsáki, 2013) using an algorithm that minimizes variance based on Euclidean distances. The clustering algorithm classified 84% (599 of 713) of units as principal neurons and 16% (114 of 713) as interneurons (Fig. 2B). Principal neurons had a mean session firing rate of 0.87 ± 0.05 Hz (mean ± SEM) and a mean valley-to-peak spike width of 470 ± 2 μs. In contrast, interneurons had higher firing rates (8.32 ± 0.93 Hz) and thinner valley-to-peak spike widths (198 ± 3 μs). The observed firing rates and waveform characteristics are comparable to those of previous reports (Csicsvari et al., 1998, 1999; Mizuseki and Buzsáki, 2013).
Ensemble characteristics were comparable across the three sessions of interest. There were no significant differences in the number of neurons per ensemble across sessions (F(2,12) = 0.08, p = 0.93) or rats (F(4,12) = 2.36, p = 0.14), with an overall mean of 55 neurons per ensemble. More specifically, we isolated 274 neurons in the Well-Trained session from five rats (ensemble sizes: 47, 66, 62, 55, and 44), 234 neurons from four rats in the Novel1 session (ensemble sizes: 79, 55, 67, and 33), and 205 neurons from four rats in the Novel2 session (ensemble sizes: 47, 69, 50, and 39). Moreover, no significant differences were observed in the ratio of principal neurons to interneurons recorded across sessions (5.25:1; F(2,12) = 0.47, p = 0.64).
Hippocampal neurons exhibited sequence coding in the form of differential activity to InSeq and OutSeq items (sequence cells)
The main goal of the study was to determine whether, while the animals' location and behavior remained constant, hippocampal neurons differentially coded for individual items, depending on their temporal context (InSeq or OutSeq). Note that this analysis excludes the first item of each sequence, as they were only presented InSeq. We began by collapsing this analysis across sessions to maximize statistical power in quantifying cell proportions (see below). Of 713 neurons recorded, we found that 187 neurons (26.2%) exhibited such sequence coding (hereafter referred to as “sequence cells” for clarity; Fig. 3A,B), in that they showed significant differences in firing rates on InSeq and OutSeq trials (resampling t test P's < 0.05; see Materials and Methods). This proportion is much higher than expected by chance as determined by the type-I error rate (G(1) = 419.49, p < 0.001), especially considering the fact that all isolated neurons were included in the analysis, regardless of overall firing rate. Even under highly conservative conditions, such as when we maximized the available odor-sampling window by focusing only on trials with odor-sampling periods of ≥500 ms (which excluded many correct OutSeq trials) and subsequently downsampled the number of InSeq trials to match the remaining OutSeq trials (which reduced statistical power), our analyses found a significant proportion of sequence cells (80 neurons, or 11.2%; G(1) = 18.95, p < 0.001).
To further characterize their firing properties, additional analyses were performed on the 80 sequence cells identified with these conservative criteria. First, these additional analyses showed that a greater proportion of sequence cells fired preferentially to OutSeq items (58 of 80; 72.5%; Fig. 3A) compared with InSeq items (22 of 80; 27.5%; Fig. 3B), proportions significantly different than expected from a uniform distribution (G(1) = 8.63, p < 0.01). Second, sequence cells included both putative principal neurons (61.3%; 49 of 80) and interneurons (38.9%; 31 of 80). Interestingly, this principal-to-interneuron ratio of 1.58:1 is significantly lower than that of the full dataset (5.25:1; G(1) = 7.67, p < 0.01), though this increased engagement of interneurons may in part be due to an increase in statistical power associated with their higher, more consistent firing rates. Finally, to quantify the amount of sequence information provided by individual cells, we adapted previous measures of information content used in spatial (Skaggs et al., 1993) and temporal processing (MacDonald et al., 2013). According to this sequential information content measure, a value of 0 bits indicates that the cell's activity provides no information about the InSeq/OutSeq status of trials, while a value of 1 bit provides full information. Analyzed over all trials, sequence cells had a mean information content of 0.16 ± 0.03 bits/spike (n = 80), significantly greater than nonsequence cells (0.07 ± 0.01 bits/spike, n = 633; t(711) = 3.62, p < 0.001). Separating sequence cells by their putative cell type revealed that principal neurons showed a significant trend toward more information per spike (0.21 ± 0.06 bits/spike) than interneurons (0.07 ± 0.01 bits/spike; t(78) = 1.929, p = 0.057), but both cell types exhibited information content values above zero (tPrincipal(48) = 3.83, p < 0.001; tInterneurons(30) = 4.42, p < 0.001). Due to their higher firing rates, interneurons are expected to have lower bits/spike values than principal neurons. However, interneurons have higher bits per second values and can convey as much sequence information over time as principal cells (sequence cells identified as principal cells: 0.26 ± 0.09 bits/s; sequence cells identified as interneurons: 0.26 ± 0.06 bits/s; t(78) = 0.057, p = 0.955). Although information content values cannot be directly compared across studies due to differences in task demands (which determine the possible range of bit values), this analysis shows that the activity of individual hippocampal cells contains sufficient information to determine the InSeq/OutSeq status of odor presentations.
It should be noted that the above analyses aligned all trials to the port-withdrawal response to ensure overt motor dynamics (i.e., observable behavior) were identical on InSeq and OutSeq trials. As such, this approach did not control for the possibility that InSeq/OutSeq differences in activity were due to potential differences in internal motor dynamics that may have occurred before the withdrawal response. To address this possible confound, we performed additional analyses that focus on time windows during which such internal dynamics or states should be equivalent. First, we expanded the conservative analysis mentioned above to show that the proportion of sequence cells was similar across the sampling period; that is, whether we focused our analysis on the time window immediately preceding the withdrawal response (250–0 ms; 10.7%), the window before that (500–250 ms; 7.4%), or the earliest window we could examine (750–500 ms; 9.3%). Had the effect been primarily driven by differences in internal motor dynamics, a different pattern would have been expected: a high proportion immediately before the withdrawal response (when differences in internal state should be the largest) and a low proportion in the earliest time period (when such differences should be smaller). Second, we performed another analysis in which we specifically controlled for time spent in the port (which aligned internal motor dynamics across InSeq and OutSeq trials) and obtained a proportion of sequence cells comparable to that reported in our previous analyses (10.0% compared with 11.2%). More precisely, this analysis aligned trials to when the nose entered the port (this can be visualized by aligning trials in our raster plots to the beginning of the shaded areas) and focused the 500 ms analysis window on the time period when animals are expected to be identifying the odor and its InSeq/OutSeq status (i.e., 250–750 ms). Notably, this effect cannot be attributed to withdrawal responses during this sampling window, as those trials were not included in the analysis. Combined with evidence of conjunctive subtypes of sequence cells (see below), these results strongly suggest that differential activity to InSeq and OutSeq items cannot be accounted for simply by potential differences in internal motor dynamics or state.
Neural ensembles accurately distinguished the temporal context (InSeq/OutSeq) of individual trials
Following up on the above finding that many individual neurons fired differentially to InSeq and OutSeq trials (i.e., 26% of neurons were sequence cells), we then examined whether the activity of simultaneously recorded neuronal ensembles (raw firing rates) accurately represented the InSeq/OutSeq status of items on a trial-by-trial basis. Again, this analysis was initially collapsed across recording sessions to maximize sample sizes (N = 13 ensembles). As our initial approach to quantify ensemble activity, we used a population vector correlation method similar to that previously used in spatial (Mankin et al., 2012) and temporal processing (MacDonald et al., 2013). Briefly, for each session, we calculated the correlation between population activity vectors across trial conditions (each vector representing the firing rate over a 500 ms bin preceding port withdrawal for each neuron on that specific trial). As expected, InSeq trial vectors were highly correlated to each other (correlations between odd and even trials; mean r2 across ensembles, 0.99 ± 0.001 SEM, P's < 0.001). OutSeq trial vectors were likewise highly correlated to each other (odd/even correlations; mean r2 = 0.97 ± 0.004 SEM, P's < 0.001). Importantly, correlations between InSeq and OutSeq trial vectors were lower (mean r2 = 0.83 ± 0.049 SEM, P's < 0.001) and significantly different from odd/even correlations on InSeq trials (t(12) = 3.22, p < 0.01) and OutSeq trials (t(12) = 2.92, p < 0.05) across ensembles. The same pattern (significantly lower correlations between InSeq and OutSeq trials than between odd and even trials) was observed using z-score normalized firing rates (all P's < 0.05). These results indicate that population activity vectors were significantly different, depending on the temporal context of the item presented.
To determine whether the InSeq/OutSeq status of a presented item could be decoded from the ensemble activity, we then analyzed the data using a hierarchical clustering algorithm similar to that used by McKenzie et al. (2014) to differentiate categorical representations in hippocampal ensembles. Briefly, the population activity vector of each trial was fed to a classifier (raw firing rates), which assigned each vector to binary clusters by minimizing variance using Ward's method. Each vector was iteratively combined into larger clusters to form a hierarchical tree (Fig. 3E). Classification accuracy was calculated by comparing the overlap (percentage) between the two main clusters of population vectors at the top of the tree (clustered according to their similarity) and the actual InSeq/OutSeq status of the trials. This analysis showed that these two clusters of population vectors strongly matched the actual distributions of InSeq and OutSeq trials (Fig. 3E). In fact, overall InSeq/OutSeq trial classification accuracy was 80.01 ± 3.83%, and 9 of 13 individual ensembles successfully classified the temporal context of trials (permutation P's < 0.01). Importantly, the first branch point in the dendrogram split the population vectors according to whether they were recorded during InSeq versus OutSeq trials, indicating that temporal context drove the largest degree of pattern separation. Only this first branch point was significant, indicating that clusters at lower levels did not account for a meaningful proportion of the cluster variances. We then used a standard k-means and a leave-one-out validation approach to perform the same classification (k = 2), with test trial assignments determined by the minimum Euclidean distance to model cluster centers. This approach produced similar results (k-means accuracy: 84.66 ± 1.90%; k-means leave-one-out accuracy: 80.08 ± 3.38%; t(12) = 0.0824, p = 0.936), and 11 of 13 individual ensembles successfully classified the InSeq/OutSeq status of trials (permutation P's < 0.01). The same pattern of classification accuracy was observed using z-score normalized firing rates (mean difference in accuracy between raw and normalized activity: 1% for k-means, 3% for hierarchical). Collectively, these different approaches confirm that CA1 ensemble activity coded for the temporal context of presented items on a trial-by-trial basis.
Finally, to examine whether certain types of trials were preferentially represented in misclassified trials, we further examined the results of the hierarchical cluster analysis to quantify the proportion of misclassifications across InSeq/OutSeq status, odors, or ordinal positions. We found that InSeq trials were misclassified less often than OutSeq trials (proportion misclassified: InSeq, 0.16; OutSeq, 0.49; t(12) = −5.364, p < 0.001). As expected, the proportion of misclassified trials across ensembles was negatively correlated with behavioral performance (InSeq and OutSeq trials combined; r = −0.566, p = 0.003, n = 26). A similar pattern was observed when InSeq and OutSeq misclassifications were examined separately, but the correlations did not reach significance (InSeq: r = −0.398, p = 0.18, n = 13; OutSeq: r = −0.402, p = 0.18, n = 13). In addition, we found that odors BCDE were misclassified in similar proportions (mean proportion misclassified across odors: ∼0.2; FBCDE(3,12) = 1.372, p = 0.298; FWXYZ (3,21) = 1.276, p = 0.309). Note that odors A and V (when presented OutSeq) were more likely to be misclassified than the other odors (A, 0.52; V, 0.49; FABCDE(4,16) = 3.498, p < 0.05, and FVWXYZ(4,28) = 5.021, p < 0.01), but this effect was not associated with performance (r = −0.255, p = 0.401, n = 13) and likely reflects the fact that the first items of the sequences were not included in the cluster analysis. Interestingly, our results also suggest a gradual increase in misclassifications from sequence position 2–5 (significant linear contrast: F(1,12) = 6.528, p < 0.05; nonsignificant main effect: F2345(3,36) = 2.205, p = 0.104).
Sequence coding was linked to sequence memory performance
To examine the relationship between sequence coding and sequence memory, we performed separate analyses for each of the three sessions of interest (Well-Trained, Novel1, and Novel2). Our single-cell analyses revealed that the proportion of sequence cells (the proportion identified by our most conservative criteria) paralleled sequence memory performance across the three sessions (Fig. 3C): it was highest in the Well-Trained session (15.3%; 42 of 274 cells), lowest in the Novel1 session (4.3%; 10 of 234 cells), and high again in the Novel2 session (13.7%; 28 of 205 cells). This parallel was confirmed by a significant quadratic fit in the magnitude of temporal context coding (absolute values of t ratios of all cells on InSeq vs OutSeq comparison; n = 713) across the three sessions (FQUAD(2,712) = 6.307, p < 0.01). This relationship was examined in more detail by correlating the proportion of sequence cells within a given ensemble with performance across rats and sessions. These analyses showed that the proportion of sequence cells was associated with SMI values (significant trend, r = 0.443, p = 0.075, n = 13) and significantly correlated with accuracy on OutSeq trials (r = 0.526, p < 0.05, n = 13).
Our ensemble analyses showed a similar pattern across the three sessions (Fig. 3F). As reported above, the proportion of ensembles showing above-chance accuracy in classifying trials as InSeq/OutSeq was high across sessions (k − 1: 11 of 13 in total; hierarchical: 9 of 13), which is not surprising given the prevalence of sequence cells and evidence of above-chance performance in all three sessions (second half of trials in the case of Novel1). More importantly, mean classification accuracy values paralleled performance across sessions: they were highest in the Well-Trained session (k − 1: 85.5%; hierarchical: 83.3%), lowest in the Novel1 session (k − 1: 79.4%; hierarchical: 77.7%), and second highest in the Novel2 session (k − 1: 84.7%; hierarchical: 78.5%), but in neither case did classification accuracy reach a significant quadratic fit across sessions (k − 1: FQUAD(2,12) = 0.083, p = 0.921; hierarchical: FQUAD(2,12) = 0.055, p = 0.947). However, classification accuracy values were associated with SMI values (significant trends; k − 1: r = 0.46, p = 0.055, n = 13; hierarchical: r = 0.443, p = 0.075, n = 13) and significantly correlated with accuracy on OutSeq trials (k − 1: r = 0.716, p < 0.01, n = 13; hierarchical: r = 0.526, p < 0.05, n = 13). Collectively, these findings indicate that this form of sequence coding is associated with sequence memory performance at the single-cell and ensemble level.
General, conjunctive, and probe-specific sequence cells
Sequence cells were identified as cells that fired differentially on InSeq and OutSeq trials. Since this analysis collapses across odors and sequence positions, it may have masked more specific types of sequence coding. To explore this possibility, we examined each sequence cell's activity across four different contrasts: InSeq versus OutSeq trials (C1), InSeq trials sorted by odor (C2), OutSeq trials sorted by Odor (C3), and OutSeq trials sorted by ordinal position in the sequence (C4). This qualitative approach provided evidence for two primary categories of sequence cells, which were then confirmed using resampling statistics (Fig. 4; see Materials and Methods). We refer to the first category as “general sequence cells” as they fired differentially to the overall InSeq/OutSeq status of items, regardless of the specific odor presented or the sequence position in which it occurred (P for C1 < 0.05; P's for C2–C4 > 0.05; 60% or 48 of 80 of sequence cells). General sequence cells could be further divided into cells that fired preferentially to InSeq items (InSeq cells; 29.2% or 14 of 48 of general sequence cells; Fig. 4, Column 1) or to OutSeq items (OutSeq cells; 70.8% or 34 of 48 of general sequence cells; Fig. 4, Column 2).
We refer to the second category as “conjunctive sequence cells” as they showed selectivity for specific conjunctions of item and sequence position information (40.0% or 32 of 80 of sequence cells). Subtypes of conjunctive cells were identified according to which contrast (in addition to C1) yielded a statistically significant ANOVA. The first subtype exhibited differential activity when specific odors were presented InSeq (P for C2 < 0.05; 25.0% or 8 of 32 of conjunctive cells). For instance, the cell in Figure 4B, left, fired maximally to Odor B when it was presented on InSeq trials. Conversely, other conjunctive cells primarily coded for specific mismatches between item and position information, which could only be observed on OutSeq trials (when the two types of information are uncoupled). In fact, the second subtype exhibited differential activity when specific odors were presented OutSeq (P for C3 < 0.05; 46.9% or 15 of 32 of conjunctive cells; Fig. 4B, cell in right column showed peak firing to Odor V when it was presented on OutSeq trials) and, the third subtype, when specific ordinal positions in the sequence included OutSeq items (P's for C4 < 0.05; 37.5% or 12 of 32 of conjunctive cells; e.g., peak firing to third position when an OutSeq odor was presented). This evidence of odor selectivity (second subtype) in hippocampal neurons is consistent with previous work (Wood et al., 1999) but, to our knowledge, ordinal selectivity (third subtype) has not been previously demonstrated and will need to be characterized in further detail in future experiments. A few cells (3 of 32) showed significant selectivity for >1 contrast (excluding C1), indicating that these subtypes were largely nonoverlapping. Finally, additional analyses have confirmed that conjunctive sequence cells were observed in similar proportions after controlling for potential differences in internal motor dynamics (by aligning trials to port entry and focusing on the 250–750 ms time window; 43.6% compared with 40.0% in the original analysis) and that they were found in both putative principal neurons (18 of 32) and interneurons (14 of 32). Overall, this evidence of generality and specificity in sequence cell coding suggests that the hippocampal network can represent both general information about the temporal context of items and detailed information about specific items in specific sequence positions.
It is important to note that the occasional under-representation of a specific trial type is unlikely to significantly bias these analyses because the ANOVAs examined differential activity across all odors/positions (omnibus tests) and because resampling statistics are generally robust in cases of small or unequal n's (the critical P value was determined by permuting the actual trials 1000 times). In fact, this sampling issue is more likely to bias the analyses toward underestimating the actual proportion of conjunctive cells. That being said, we did not have sufficient power to perform all post hoc pairwise comparisons (while properly controlling for the familywise error rate) and thus are not in a position to specifically compare activity between individual odors or positions. Instead, we examined selectivity across odors or sequence positions using a rank-order analysis, an approach that allowed us to maximize power by quantifying selectivity in a single test. First, for each conjunctive cell, we rank-ordered the odors according to the cell's mean response rate (1, odor with highest mean firing rate; 5, odor with lowest mean firing rate); then we determined whether the mean rank orders (one per cell) differed across odors. This analysis revealed no significant difference across odors (ABCDE: F(4,20) = 2.083, p = 0.536; VWXYZ: F(4,32) = 1.915, p = 0.132), suggesting that odor selectivity was well distributed across odors. In contrast, the corresponding analysis revealed a graded effect across sequence positions (linear contrast: F(1,11) = 30.264, p < 0.001; main effect of position: F(3,33) = 10.809, p < 0.001), with higher firing rates for earlier sequence positions (mean rank order: pos2 = 1.5, pos3 = 2.2, pos4 = 3.0, pos5 = 3.5).
Finally, general and conjunctive sequence cells that displayed preferential firing to OutSeq items were further examined by plotting their activity across the two types of OutSeq probe trials (repeats and skips; see Materials and Methods). Interestingly, we found many that showed selectivity to one of the two probe types (34.5% or 20 of 58; Fig. 5). These probe-specific sequence cells either fired more to repeats (35.0% or 7 of 20 of probe-specific sequence cells) or to skips (65.0% or 13 of 20 of probe-specific sequence cells), suggesting hippocampal representations also include specific types of sequence memory violations.
Theta and slow-gamma oscillatory dynamics exhibited consistent shifts during task performance, but only slow gamma was modulated by the temporal context of items
We next explored the oscillatory dynamics of CA1 during task performance. To do so, we produced mean perievent spectrograms (PESGs; averaging across all completed sequences in a session) for each rat, as well as for the whole group. These spectrograms showed two clear oscillatory bands with high power, one in the theta range (4–12 Hz) and the other in the slow-gamma range (20–40 Hz; Igarashi et al., 2014), which were apparent at the level of individual trials, individual rats, and group. We therefore focused our analyses on those frequency bands. As expected, theta power was high during running (dark red band in 4–12 Hz range preceding first item of the sequence; Fig. 6A). However, upon initiation of odor sampling, theta decreased (in both power and center frequency) and slow-gamma power increased (yellow clouds in the 20–40 Hz range during odor-sampling windows; Fig 6A). Similar increases in slow-gamma power during odor sampling have been described previously (Igarashi et al., 2014). Last, both theta and slow gamma showed a large decrease in power after port withdrawal. It should be noted that while Figure 6A only shows the average PESG (across sequences and rats), the same overall pattern of theta and slow-gamma dynamics was observed within individual rats and individual sequence presentations (data not shown). Overall, these findings suggest a consistent pattern of theta and slow-gamma power dynamics during task performance.
Next, we examined whether these oscillations were influenced by the temporal context of odor presentations. To test this possibility, we produced separate PESGs for InSeq and OutSeq item presentations (Fig. 6B, left, middle) and computed their z-scored difference to produce a difference spectrogram (Fig. 6B, right). This approach showed that InSeq odors were associated with stronger slow-gamma power compared with OutSeq odors, but differences in theta power were not evident. Differences in the delta band were also observed (0–4 Hz; similar to MacDonald et al., 2013), but were not explored further here.
To quantify task-related effects on theta and slow-gamma bands, an analysis of theta and slow-gamma waveforms (averaged across trials and animals) was performed (Csicsvari et al., 1999; Patel et al., 2012). This approach allowed us to use simple statistical tests to compare waveform amplitudes across sampling windows (PreSeq vs Odors) or temporal context (InSeq vs OutSeq). Mean theta and slow-gamma waveforms were calculated from bandpass-filtered LFP recordings sampled from the same time window used in single-cell and ensemble analyses (500 ms preceding port withdrawal; Fig. 6C,E). First, we tested differences between PreSeq (before the first odor) and odor-sampling periods (combining both InSeq and OutSeq odors). Consistent with the spectrograms, mean theta waveform amplitude was significantly higher during the PreSeq period compared with the odor-sampling periods in the Well-Trained session (DiffPreSeq − Odors = 0.20 ± 0.06; t(4) = 3.484, p < 0.05), but there were no significant differences in the Novel1 (DiffPreSeq − Odors = −0.06 ± 0.13; t(3) = −0.516, p = 0.642) or Novel2 sessions (DiffPreSeq − Odors = −0.05 ± 0.03; t(3) = 0.231, p = 0.832; Fig. 6C). In contrast, slow gamma showed consistently larger amplitudes during odor-sampling periods compared with PreSeq periods, including the Well-Trained (DiffPreSeq − Odors = −0.84 ± 0.17; t(4) = −4.984, p < 0.01), Novel1 (DiffPreSeq − Odors = −0.85 ± 0.23; t(3) = −3.686, p < 0.05), and Novel2 sessions (DiffPreSeq − Odors = −0.56 ± 0.15; t(3) = −3.928, p < 0.05; Fig. 6E). Overall, these analyses confirm that theta is stronger before odor sampling begins while slow gamma is stronger during odor sampling.
We then examined differences in waveform amplitude based on the temporal context of items (InSeq vs OutSeq). There were no significant effects on theta waveform amplitudes in the Well-Trained (DiffInSeq − OutSeq = 0.10 ± 0.13; t(4) = 0.736, p = 0.503), Novel1 (DiffInSeq − OutSeq = 0.22 ± 0.16; t(3) = 1.40, p = 0.255), or Novel2 session (DiffInSeq − OutSeq = 0.18 ± 0.06; t(3) = 3.09, p = 0.059; Fig. 6C,D). In contrast, effects of temporal context were observed on slow-gamma waveform amplitude. In fact, slow-gamma waveforms were of larger amplitude for InSeq odors in the Well-Trained session (DiffInSeq − OutSeq = 0.60 ± 0.16; t(4) = 3.802, p < 0.05) but this difference was not present in the Novel1 session (DiffInSeq − OutSeq = 0.04 ± 0.07; t(3) = 0.568, p = 0.610; Fig. 6E,F). Although slow-gamma amplitude on InSeq items increased again in the Novel2 session, it did not reach significance (DiffInSeq − OutSeq = 0.29 ± 0.15; t(3) = 1.956, p = 0.145). To follow up on this analysis, we showed that this effect of temporal context on slow-gamma amplitude paralleled behavioral performance across sessions, as demonstrated by a significant quadratic fit (FQUAD(2,12) = 4.282, p < 0.05). Furthermore, the size of this effect of temporal context on slow-gamma amplitude was correlated with SMI scores (r = 0.680, p < 0.01; n = 13) and OutSeq accuracy (r = 0.783, p < 0.001; n = 13). No significant relationship was observed between theta amplitude and performance across sessions (quadratic fit: FQUAD(2,12) = 0.274, p = 0.766; correlation with SMI: r = 0.021, p = 0.946; Fig. 6D). Collectively, these findings suggest that changes in slow-gamma oscillations are associated with the processing of the temporal context of items.
Spike–phase relationships did not strongly differentiate the temporal context of items, but the magnitude of slow-gamma modulation was associated with sequence memory performance
We next explored the relationship between spike times and the phase of theta and slow-gamma oscillations. Six spike–phase plots (three sampling periods: PreSeq, InSeq, OutSeq; two bands: theta and slow gamma; Fig. 7A,B) were constructed for each of the 713 isolated neurons. Spike–phase relationships were determined by modeling sine waves to each plot and testing for the statistical significance of the fit. We report that the proportion of neurons showing significant slow-gamma modulation was relatively consistent across the PreSeq and odor-sampling periods (∼10%) and that the magnitude of slow-gamma modulation during odor-sampling periods (InSeq and OutSeq) significantly paralleled sequence memory performance across sessions (tested with a quadratic regression on the F ratios of the sine wave fit for all cells across the three sessions; PreSeq: FQUAD(2,712) = 0.333, p = 0.717; InSeq: FQUAD(2,712) = 8.603, p < 0.001; OutSeq: FQUAD(2,712) = 6.960, p < 0.001; Fig. 7C, bottom row). Additionally, slow-gamma modulations showed a small but significant difference between InSeq and OutSeq trials (F ratios difference = 0.16; t(712) = 2.182, p < 0.05; small effect size according to Cohen's d value of 0.08). In contrast, the proportion of neurons with significant theta modulation was considerably higher during the PreSeq period (∼30%) than during the odor-sampling period (∼12%) and the parallels between the magnitude of theta modulation and performance across sessions were not significant (PreSeq: FQUAD(2,712) = 0.495, p = 0.610; InSeq: FQUAD(2,712) = 2.048, p = 0.130; OutSeq: FQUAD(2,712) = 1.601, p = 0.202; Fig. 7C, top row). Note that while theta and slow-gamma means showed a comparable pattern across sessions, the variability was considerably higher in theta (note large SEM despite n's of 713). Theta modulations also showed a small but significant difference between InSeq and OutSeq trials (F ratios difference, 0.24; t(712) = 2.456, p < 0.05; small effect size: Cohen's d = 0.09).
Figure 7.

Spike–phase relationships did not strongly differentiate the temporal context of items, but the magnitude of slow-gamma modulation showed a robust association with sequence memory performance. A, Spiking activity from example tetrode showing significant theta modulation across PreSeq and odor-sampling periods (InSeq or OutSeq; top) but no significant slow-gamma modulation (bottom). All spike–phase relationships were determined using the local LFP for each cell and tetrode (x-axis: 0° represents the trough of theta or slow gamma, and 180° the peak). Yellow waveforms represent the sine waves fitted to the spike–phase distributions. B, Example from another tetrode showing significant theta modulation during the PreSeq period (but not during odor sampling; top) and significant slow-gamma modulation across time periods (bottom). C, Magnitude of theta (top) or slow-gamma (bottom) modulation across sampling periods and sessions (mean F ratio across all cells ± SEM; n = 713). The magnitude of the phase modulation during odor sampling (InSeq or OutSeq) significantly paralleled performance across sessions for slow gamma (significant quadratic fit). The same pattern did not reach significance for theta, as the variability was considerably higher (note large SEM despite n's of 713). Theta and slow-gamma modulations showed a small but significant difference between InSeq and OutSeq trials (small effect sizes according to Cohen's d). Percentages on bars indicate proportions of significantly modulated cells. D, Preferred phase of spiking activity for cells with significant theta (top) or slow-gamma (bottom) modulation. Circular histograms show the proportion of cells with significant preferred phases across 18° bins (inner circles indicate a proportion of 0.05; outer circles, 0.15). Arrows show the resultant vector length (inner circles indicate r = 0.05; outer circles, r = 0.15) and direction (circular mean). No significant differences were observed across sampling periods (PreSeq, InSeq, or OutSeq) for any of the plots. All sessions combined (left): the mean preferred phase (collapsed across sampling periods) was significantly different between theta and slow gamma (theta: 305.04°; slow gamma: 181.45°; dotted lines indicate 95% confidence intervals of means). A qualitatively similar pattern was observed in each session (Well-Trained, Novel1, Novel2) but the resulting reduction in sampling increased error variance and the effects did not reach significance. M*, Significant modulation (theta or slow gamma); Q*, significant quadratic fit; *, significant difference in preferred phase.
Subsequently, we examined the preferred phase of spiking activity for only those cells with significant theta or slow-gamma modulation (including both principal neurons and interneurons). This analysis shows that spiking activity tended to occur at different phases for theta (mean preferred phase of theta-modulated cells: 305.04°) and slow gamma (mean preferred phase of slow-gamma-modulated cells: 181.45°; Watson-Williams F(1,570) = 143.584, p < 0.001; Fig. 7D). However, the preferred phases did not significantly vary across PreSeq, InSeq, or OutSeq sampling periods (Watson-Williams F tests P's > 0.10). We followed up on this negative finding by examining a subsample of cells that showed significant spike–phase relationships in all three sampling periods and analyzed the absolute circular distance between the PreSeq and odor-sampling periods (InSeq and OutSeq). Only modest preferred phase shifts were observed across cells (theta: +19.5° shift from PreSeq to odor period; slow gamma: −12.0° shift) and none reached significance across sampling periods (Watson-Williams F test P's > 0.10). In addition, we examined the distribution of phase differences across these cells and saw no evidence of a bimodal distribution, arguing against the possibility that a subset of the population showed a strong and consistent phase difference that was being masked by the rest of the population.
Combined with the above evidence that slow-gamma amplitude is modulated by InSeq/OutSeq status and performance across sessions, the finding that the magnitude of slow-gamma modulation significantly parallels performance strongly suggests that this oscillation is important for sequence memory performance. Our findings also suggest that theta oscillations and the spike–phase relationships we examined (proportions of modulated cells, the magnitude of the modulation, or the preferred phase of their spiking activity) do not play a key role in identifying the temporal context of items.
Discussion
In this study, we tested the hypothesis that the hippocampus represents sequential relationships among nonspatial events by differentially firing to the same items, depending on the sequential position in which they occurred. We discovered that CA1 activity strongly differentiated the temporal context of items (whether they were presented InSeq or OutSeq) at the level of individual neurons, neuronal ensembles, and LFPs, and that this coding was linked to sequence memory performance. At the single-cell level, we identified populations of neurons that differentiated the InSeq/OutSeq status of items across odors (general sequence cells) or for specific conjunctions of item and sequence position information (conjunctive sequence cells), as well as cells that showed selectivity for specific types of OutSeq probe trials (i.e., repeats or skips). Importantly, the only distinctive feature of OutSeq trials was the incorrect sequential position of the item, as all odors were highly familiar to the animals and the animals' location, behavior, and motivation was well matched across InSeq and OutSeq trials. Therefore, sequence cell activity likely reflects the cognitive process by which items were identified as InSeq or OutSeq by determining whether the currently presented item matched the item predicted by memory of the sequence. This form of activity provides a neural mechanism for the strong BOLD fMRI activations observed in the hippocampus when contrasting InSeq and OutSeq trials in human subjects performing the task (Boucquey et al., 2014, 2015). Our findings are consistent with previous electrophysiological studies showing that temporal modulation of hippocampal ensemble activity predicts subsequent order memory success (Manns et al., 2007) and that individual hippocampal neurons exhibit sequence-dependent activity before the presentation of ambiguous stimuli in a sequence-disambiguation task (Ginther et al., 2011). Importantly, our novel experimental approach allowed us to extend these previous findings by directly examining the coding of specific items as a function of their sequential position, while holding the location and behavior of the animal constant. Overall, our results are also consistent with evidence from other nonspatial sequence memory tasks in rodents and humans, which showed that the hippocampus plays a key role in supporting the ability to remember the order in which items were presented (Fortin et al., 2002; Kesner et al., 2002; Kumaran and Maguire, 2006; Ezzyat and Davachi, 2014; Hsieh et al., 2014).
An alternative explanation to consider for the phenomenon of sequence cells is that it reflects a general role of the hippocampus in match/mismatch detection or in responding to unexpected or novel items (Vinogradova, 2001; Grunwald and Kurthen, 2006; Kumaran and Maguire, 2006; Folstein and Van Petten, 2008; Duncan et al., 2012). However, while a large proportion of neurons exhibited a general increase in firing rate to all OutSeq items (OutSeq cells), many others showed the opposite pattern by selectively increasing their activity to all items presented InSeq (InSeq cells). Furthermore, as mentioned above, many sequence cells were conjunctive or fired differentially between the two types of OutSeq probe trials (repeats and skips). The diversity and richness of this coding suggests more specific cognitive processes than simple match/mismatch or novelty detection, including conjunctive (selective for specific items or ordinal positions) representations and the detection of specific types of sequence violations. Another alternative explanation to consider is that sequence cells reflect differences in internal motor dynamics or state that may be present before the port-withdrawal response. However, the evidence of conjunctive subtypes of sequence cells combined with the demonstration of sequence cells when analyses specifically controlled for time spent in port (which aligned internal motor dynamics across InSeq and OutSeq trials) strongly suggest that differential activity to InSeq and OutSeq items cannot be accounted for simply by this potential confound.
It is also important to note that, due to the nature of the task, limited sampling was expected on some secondary analyses involving subsets of OutSeq items. This is due to the fact that the overall number of OutSeq probe trials must be kept small (or it will interfere with the memory of the actual sequence being tested) and that their exact number and arrangement was randomized every session (to ensure animals could not anticipate their occurrence). While this sampling issue may have limited our ability to perform detailed post hoc comparisons in some conditions, it did not compromise the main results of these analyses or our interpretation of the findings because the critical analyses relied on omnibus tests (tests collapsing across all trial types) and we were careful to use robust statistical approaches in cases of small or unequal n's (G tests and resampling statistics; Sokal and Rohlf, 1995). For instance, while we had sufficient statistical power to show that conjunctive sequence cells exhibited differential activity across odors or sequence positions on OutSeq trials (using ANOVAs), thorough post hoc comparisons across all pairs of odors or positions could not be performed. Similarly, when evaluating behavioral performance using G tests, we had sufficient sampling to statistically evaluate the subjects' overall performance in each session but could not make specific statistical statements about the nonsignificant positional G tests obtained in the Novel1 session. This sampling issue also precluded a thorough comparison of item (odor) coding and ordinal (sequence position) coding in hippocampal neurons. Since item and ordinal information is overlapping on InSeq items, we could only examine odor and ordinal selectivity by focusing on OutSeq trials (in which the two types of information are uncoupled). Our analyses indicated that while odor-selective cells were more prevalent than ordinal-selective cells, both types of selectivity were represented in our sample. This evidence of odor selectivity is consistent with previous work (Wood et al., 1999), but to our knowledge ordinal coding has not been previously demonstrated in hippocampal neurons. Using modified versions of our experimental design, we plan to further characterize these interesting findings in future experiments.
The discovery of sequence cells adds to a growing body of evidence of context-specific activity in hippocampal neurons, including spatial, temporal, and other types of contextual information. Specific to the temporal context, sequence cells provide temporal information that complements timing signals recently demonstrated in hippocampal neurons. In fact, while “time cells” (MacDonald et al., 2011, 2013) and gradual changes in ensemble activity (Manns et al., 2007; Mankin et al., 2012) may serve as an internal framework for representing how much time has elapsed between events, sequence cells can provide information about the sequential or ordinal relationships among quickly unfolding series of events. Therefore, this novel form of context-specific firing may contribute to our ability to disambiguate events that share the same items and locations by using another form of temporal context unique to each episode. Finally, it should be noted that sequence-cell activity is generally consistent with the view that the hippocampus contributes to a global temporal context signal by which memories are temporally organized (Howard and Kahana, 2002; Howard et al., 2014), but that the present analyses were not designed to specifically test that model. A thorough examination of the predictions made by the temporal context model will need to be performed as a separate study.
Recent findings suggest that distinct oscillatory states in CA1 may reflect dynamic changes in functional coupling and routing of information within the hippocampus (Colgin et al., 2009; Igarashi et al., 2014). Within the framework of the present task, a potential mechanism for identifying items as InSeq or OutSeq would be that CA1 compares incoming information from the lateral entorhinal cortex (LEC; currently presented item) with information from CA3 (predicted item based on stored representation of the sequence; Hasselmo and Wyble, 1997; Lisman and Grace, 2005). Our finding of pronounced slow-gamma oscillations in CA1 (20–40 Hz) early during odor sampling is consistent with increased LEC–CA1 coupling when information about the presented item is being processed (Igarashi et al., 2014). However, we did not observe strong oscillations in the ∼40–60 Hz range (a slightly faster “slow gamma” than that described here and in Igarashi et al., 2014), which are thought to reflect CA3–CA1 coupling (Colgin et al., 2009). An alternative hypothesis is that information flow between CA3 and CA1 occurred primarily during sharp wave ripple events, which were frequently observed between odor presentations. We are pursuing multisite recording studies to provide a detailed characterization of the flow of information within this circuit during task performance.
To our knowledge, this is the first study to provide compelling evidence that the hippocampus codes for the specific sequential position of nonspatial items and that this coding is important for sequence memory. These findings suggest that memory-based sequence coding in the hippocampus extends beyond the domain of spatial trajectories and thus provide critical support for theoretical models proposing that sequence coding is a fundamental computation of the hippocampus (Levy, 1996; Skaggs et al., 1996; Lisman, 1999; Howard et al., 2005, 2014; Foster and Knierim, 2012). In fact, encoding nonspatial sequences of events may reflect similar computations to encoding spatial trajectories, as suggested by recent mathematical models showing that the computational architecture of the hippocampus can support spatial, temporal, and sequential capacities (Howard et al., 2005, 2014). Our findings also add to a growing body of research showing that hippocampal neurons represent a large range of general and specific information about events, including item, spatial, temporal, and reward information (Wood et al., 1999; Manns et al., 2007; MacDonald et al., 2011, 2013; McKenzie et al., 2013, 2014). These rich, multifeatured contextual representations in the hippocampus are consistent with its position atop a hierarchy of associative pathways integrating content-rich memories across multiple systems as well as with its critical role in episodic memory (Eichenbaum et al., 2007; Allen and Fortin, 2013; Knierim et al., 2014).
Footnotes
This work was supported in part by the National Science Foundation (Awards IOS-1150292 and BCS-1439267 to N.J.F.), the Whitehall Foundation (Award 2010-05-84 to N.J.F.), and the University of California, Irvine. We thank Howard Eichenbaum, Michael Hasselmo, Bruce McNaughton, Mark Brandon, Clare Quirk, and members of the Fortin Laboratory for useful discussions on the present work.
The authors declare no competing financial interests.
This is an Open Access article distributed under the terms of the Creative Commons Attribution License Creative Commons Attribution 4.0 International, which permits unrestricted use, distribution and reproduction in any medium provided that the original work is properly attributed.
References
- Agster KL, Fortin NJ, Eichenbaum H. The hippocampus and disambiguation of overlapping sequences. J Neurosci. 2002;22:5760–5768. doi: 10.1523/JNEUROSCI.22-13-05760.2002. [DOI] [PMC free article] [PubMed] [Google Scholar]
- Allen TA, Fortin NJ. The evolution of episodic memory. Proc Natl Acad Sci U S A. 2013;110:10379–10386. doi: 10.1073/pnas.1301199110. [DOI] [PMC free article] [PubMed] [Google Scholar]
- Allen TA, Morris AM, Mattfeld AT, Stark CE, Fortin NJ. A sequence of events model of episodic memory shows parallels in rats and humans. Hippocampus. 2014;24:1178–1188. doi: 10.1002/hipo.22301. [DOI] [PMC free article] [PubMed] [Google Scholar]
- Allen TA, Morris AM, Stark SM, Fortin NJ, Stark CE. Memory for sequences of events impaired in typical aging. Learn Mem. 2015;22:138–148. doi: 10.1101/lm.036301.114. [DOI] [PMC free article] [PubMed] [Google Scholar]
- Boucquey VK, Allen TA, Huffman D, Fortin NJ, Stark CE. Memory for sequences of events shows bilateral hippocampal and medial prefrontal cortical activity in humans. Soc Neurosci Abstr. 2014;40:646.04. [Google Scholar]
- Boucquey VK, Allen TA, Huffman D, Fortin NJ, Stark CE. Hippocampal and medial prefrontal cortex activity and functional connectivity during memory for sequences of events. Soc Neurosci Abstr. 2015:41. [Google Scholar]
- Bower MR, Euston DR, McNaughton BL. Sequential-context-dependent hippocampal activity is not necessary to learn sequences with repeated elements. J Neurosci. 2005;25:1313–1323. doi: 10.1523/JNEUROSCI.2901-04.2005. [DOI] [PMC free article] [PubMed] [Google Scholar]
- Brandon MP, Bogaard AR, Schultheiss NW, Hasselmo ME. Segregation of cortical head direction cell assemblies on alternating theta cycles. Nat Neurosci. 2013;16:739–748. doi: 10.1038/nn.3383. [DOI] [PMC free article] [PubMed] [Google Scholar]
- Buhusi CV, Meck WH. What makes us tick? Functional and neural mechanisms of interval timing. Nat Rev Neurosci. 2005;6:755–765. doi: 10.1038/nrn1764. [DOI] [PubMed] [Google Scholar]
- Colgin LL, Denninger T, Fyhn M, Hafting T, Bonnevie T, Jensen O, Moser MB, Moser EI. Frequency of gamma oscillations routes flow of information in the hippocampus. Nature. 2009;462:353–357. doi: 10.1038/nature08573. [DOI] [PubMed] [Google Scholar]
- Csicsvari J, Hirase H, Czurko A, Buzsáki G. Reliability and state dependence of pyramidal cell-interneuron synapses in the hippocampus: an ensemble approach in the behaving rat. Neuron. 1998;21:179–189. doi: 10.1016/S0896-6273(00)80525-5. [DOI] [PubMed] [Google Scholar]
- Csicsvari J, Hirase H, Czurkó A, Mamiya A, Buzsáki G. Oscillatory coupling of hippocampal pyramidal cells and interneurons in the behaving rat. J Neurosci. 1999;19:274–287. doi: 10.1523/JNEUROSCI.19-01-00274.1999. [DOI] [PMC free article] [PubMed] [Google Scholar]
- Davachi L, DuBrow S. How the hippocampus preserves order: the role of prediction and context. Trends Cogn Sci. 2015;19:92–99. doi: 10.1016/j.tics.2014.12.004. [DOI] [PMC free article] [PubMed] [Google Scholar]
- Dragoi G, Buzsáki G. Temporal encoding of place sequences by hippocampal cell assemblies. Neuron. 2006;50:145–157. doi: 10.1016/j.neuron.2006.02.023. [DOI] [PubMed] [Google Scholar]
- Duncan K, Ketz N, Inati SJ, Davachi L. Evidence for area CA1 as a match/mismatch detector: a high-resolution fMRI study of the human hippocampus. Hippocampus. 2012;22:389–398. doi: 10.1002/hipo.20933. [DOI] [PMC free article] [PubMed] [Google Scholar]
- Eichenbaum H. Time cells in the hippocampus: a new dimension for mapping memories. Nat Rev Neurosci. 2014;15:732–744. doi: 10.1038/nrn3827. [DOI] [PMC free article] [PubMed] [Google Scholar]
- Eichenbaum H, Fortin NJ. Bridging the gap between brain and behavior: cognitive and neural mechanisms of episodic memory. J Exp Anal Behav. 2005;84:619–629. doi: 10.1901/jeab.2005.80-04. [DOI] [PMC free article] [PubMed] [Google Scholar]
- Eichenbaum H, Yonelinas AP, Ranganath C. The medial temporal lobe and recognition memory. Annu Rev Neurosci. 2007;30:123–152. doi: 10.1146/annurev.neuro.30.051606.094328. [DOI] [PMC free article] [PubMed] [Google Scholar]
- Ekstrom AD, Bookheimer SY. Spatial and temporal episodic memory retrieval recruit dissociable functional networks in the human brain. Learn Mem. 2007;14:645–654. doi: 10.1101/lm.575107. [DOI] [PMC free article] [PubMed] [Google Scholar]
- Ezzyat Y, Davachi L. Similarity breeds proximity: pattern similarity within and across contexts is related to mnemonic judgments of temporal proximity. Neuron. 2014;81:1179–1189. doi: 10.1016/j.neuron.2014.01.042. [DOI] [PMC free article] [PubMed] [Google Scholar]
- Ferbinteanu J, Shapiro ML. Prospective and retrospective memory coding in the hippocampus. Neuron. 2003;40:1227–1239. doi: 10.1016/S0896-6273(03)00752-9. [DOI] [PubMed] [Google Scholar]
- Folstein JR, Van Petten C. Influence of cognitive control and mismatch on the N2 component of the ERP: a review. Psychophysiology. 2008;45:152–170. doi: 10.1111/j.1469-8986.2007.00602.x. [DOI] [PMC free article] [PubMed] [Google Scholar]
- Fortin NJ, Agster KL, Eichenbaum HB. Critical role of the hippocampus in memory for sequences of events. Nat Neurosci. 2002;5:458–462. doi: 10.1038/nn834. [DOI] [PMC free article] [PubMed] [Google Scholar]
- Foster DJ, Knierim JJ. Sequence learning and the role of the hippocampus in rodent navigation. Curr Opin Neurobiol. 2012;22:294–300. doi: 10.1016/j.conb.2011.12.005. [DOI] [PMC free article] [PubMed] [Google Scholar]
- Foster DJ, Wilson MA. Reverse replay of behavioral sequences in hippocampal place cells during the awake state. Nature. 2006;440:680–683. doi: 10.1038/nature04587. [DOI] [PubMed] [Google Scholar]
- Foster DJ, Wilson MA. Hippocampal theta sequences. Hippocampus. 2007;17:1093–1099. doi: 10.1002/hipo.20345. [DOI] [PubMed] [Google Scholar]
- Frank LM, Brown EN, Wilson M. Trajectory encoding in hippocampus and entorhinal cortex. Neuron. 2000;27:169–178. doi: 10.1016/S0896-6273(00)00018-0. [DOI] [PubMed] [Google Scholar]
- Gill PR, Mizumori SJ, Smith DM. Hippocampal episode fields develop with learning. Hippocampus. 2011;21:1240–1249. doi: 10.1002/hipo.20832. [DOI] [PMC free article] [PubMed] [Google Scholar]
- Ginther MR, Walsh DF, Ramus SJ. Hippocampal neurons encode different episodes in an overlapping sequence of odors task. J Neurosci. 2011;31:2706–2711. doi: 10.1523/JNEUROSCI.3413-10.2011. [DOI] [PMC free article] [PubMed] [Google Scholar]
- Grunwald T, Kurthen M. Novelty detection and encoding for declarative memory within the human hippocampus. Clin EEG Neurosci. 2006;37:309–314. doi: 10.1177/155005940603700408. [DOI] [PubMed] [Google Scholar]
- Gupta AS, van der Mer MA, Touretzky DS, Redish AD. Hippocampal replay is not a simple function of experience. Neuron. 2010;65:695–705. doi: 10.1016/j.neuron.2010.01.034. [DOI] [PMC free article] [PubMed] [Google Scholar]
- Gupta AS, van der Mer MA, Touretzky DS, Redish AD. Segmentation of spatial experience by hippocampal theta sequences. Nat Neurosci. 2012;15:1032–1039. doi: 10.1038/nn.3138. [DOI] [PMC free article] [PubMed] [Google Scholar]
- Hasselmo ME, Wyble BP. Free recall and recognition in a network model of the hippocampus: simulating effects of scopolamine on human memory function. Behav Brain Res. 1997;89:1–34. doi: 10.1016/S0166-4328(97)00048-X. [DOI] [PubMed] [Google Scholar]
- Howard MW, Kahana MJ. A distributed representation of temporal context. J Math Psychol. 2002;46:269–299. doi: 10.1006/jmps.2001.1388. [DOI] [Google Scholar]
- Howard MW, Fotedar MS, Datey AV, Hasselmo ME. The temporal context model in spatial navigation and relational learning: toward a common explanation of medial temporal lobe function across domains. Psychol Rev. 2005;112:75–116. doi: 10.1037/0033-295X.112.1.75. [DOI] [PMC free article] [PubMed] [Google Scholar]
- Howard MW, MacDonald CJ, Tiganj Z, Shankar KH, Du Q, Hasselmo ME, Eichenbaum H. A unified mathematical framework for coding time, space, and sequences in the hippocampal region. J Neurosci. 2014;34:4692–4707. doi: 10.1523/JNEUROSCI.5808-12.2014. [DOI] [PMC free article] [PubMed] [Google Scholar]
- Hsieh LT, Gruber MJ, Jenkins LJ, Ranganath C. Hippocampal activity patterns carry information about objects in temporal context. Neuron. 2014;81:1165–1178. doi: 10.1016/j.neuron.2014.01.015. [DOI] [PMC free article] [PubMed] [Google Scholar]
- Igarashi KM, Lu L, Colgin LL, Moser MB, Moser EI. Coordination of entorhinal-hippocampal ensemble activity during associative learning. Nature. 2014;510:143–147. doi: 10.1038/nature13162. [DOI] [PubMed] [Google Scholar]
- Jenkins LJ, Ranganath C. Prefrontal and medial temporal lobe activity at encoding predicts temporal context memory. J Neurosci. 2010;30:15558–15565. doi: 10.1523/JNEUROSCI.1337-10.2010. [DOI] [PMC free article] [PubMed] [Google Scholar]
- Karlsson MP, Frank LM. Awake replay of remote experiences in the hippocampus. Nat Neurosci. 2009;12:913–918. doi: 10.1038/nn.2344. [DOI] [PMC free article] [PubMed] [Google Scholar]
- Kesner RP, Gilbert PE, Barua LA. The role of the hippocampus for the temporal order of a sequence of odors. Behav Neurosci. 2002;116:286–290. doi: 10.1037/0735-7044.116.2.286. [DOI] [PubMed] [Google Scholar]
- Knierim JJ, Neunuebel JP, Deshmukh SS. Functional correlates of the lateral and medial entorhinal cortex: objects, path integration and local-global reference frames. Philos Trans R Soc Lond B Biol Sci. 2014;369:20130369. doi: 10.1098/rstb.2013.0369. [DOI] [PMC free article] [PubMed] [Google Scholar]
- Kumaran D, Maguire EA. An unexpected sequence of events: mismatch detection in the human hippocampus. PLoS Biol. 2006;4:e424. doi: 10.1371/journal.pbio.0040424. [DOI] [PMC free article] [PubMed] [Google Scholar]
- Levy WB. A sequence predicting CA3 is a flexible associator that learns and uses context to solve hippocampal-like tasks. Hippocampus. 1996;6:579–590. doi: 10.1002/(SICI)1098-1063(1996)6:6%3C579::AID-HIPO3%3E3.0.CO;2-C. [DOI] [PubMed] [Google Scholar]
- Lisman JE. Relating hippocampal circuitry to function: recall of memory sequences by reciprocal dentate-CA3 interactions. Neuron. 1999;22:233–242. doi: 10.1016/S0896-6273(00)81085-5. [DOI] [PubMed] [Google Scholar]
- Lisman JE, Grace AA. The hippocampal-VTA loop: controlling the entry of information into long-term memory. Neuron. 2005;46:703–713. doi: 10.1016/j.neuron.2005.05.002. [DOI] [PubMed] [Google Scholar]
- MacDonald CJ, Lepage KQ, Eden UT, Eichenbaum H. Hippocampal “time cells” bridge the gap in memory for discontiguous events. Neuron. 2011;71:737–749. doi: 10.1016/j.neuron.2011.07.012. [DOI] [PMC free article] [PubMed] [Google Scholar]
- MacDonald CJ, Carrow S, Place R, Eichenbaum H. Distinct hippocampal time cell sequences represent odor memories in immobilized rats. J Neurosci. 2013;33:14607–14616. doi: 10.1523/JNEUROSCI.1537-13.2013. [DOI] [PMC free article] [PubMed] [Google Scholar]
- Mankin EA, Sparks FT, Slayyeh B, Sutherland RJ, Leutgeb S, Leutgeb JK. Neuronal code for extended time in the hippocampus. Proc Natl Acad Sci U S A. 2012;109:19462–19467. doi: 10.1073/pnas.1214107109. [DOI] [PMC free article] [PubMed] [Google Scholar]
- Manns JR, Eichenbaum H. A cognitive map for object memory in the hippocampus. Learn Mem. 2009;16:616–624. doi: 10.1101/lm.1484509. [DOI] [PMC free article] [PubMed] [Google Scholar]
- Manns JR, Howard MW, Eichenbaum H. Gradual changes in hippocampal activity support remembering the order of events. Neuron. 2007;56:530–540. doi: 10.1016/j.neuron.2007.08.017. [DOI] [PMC free article] [PubMed] [Google Scholar]
- Mauk MD, Buonomano DV. The neural basis of temporal processing. Annu Rev Neurosci. 2004;27:307–340. doi: 10.1146/annurev.neuro.27.070203.144247. [DOI] [PubMed] [Google Scholar]
- McKenzie S, Robinson NT, Herrera L, Churchill JC, Eichenbaum H. Learning causes reorganization of neuronal firing patterns to represent related experiences within a hippocampal schema. J Neurosci. 2013;33:10243–10256. doi: 10.1523/JNEUROSCI.0879-13.2013. [DOI] [PMC free article] [PubMed] [Google Scholar]
- McKenzie S, Frank AJ, Kinsky NR, Porter B, Rivière PD, Eichenbaum H. Hippocampal representation of related and opposing memories develop within distinct, hierarchically organized neural schemas. Neuron. 2014;83:202–215. doi: 10.1016/j.neuron.2014.05.019. [DOI] [PMC free article] [PubMed] [Google Scholar]
- McNaughton BL, Morris RGM. Hippocampal synaptic enhancement and information storage within a distributed memory system. Trends Neurosci. 1987;10:408–415. doi: 10.1016/0166-2236(87)90011-7. [DOI] [Google Scholar]
- Mehta MR. From synaptic plasticity to spatial maps and sequence learning. Hippocampus. 2015;25:756–762. doi: 10.1002/hipo.22472. [DOI] [PubMed] [Google Scholar]
- Mehta MR, Quirk MC, Wilson MA. Experience-dependent asymmetric shape of hippocampal receptive fields. Neuron. 2000;25:707–715. doi: 10.1016/S0896-6273(00)81072-7. [DOI] [PubMed] [Google Scholar]
- Mehta MR, Lee AK, Wilson MA. Role of experience and oscillations in transforming a rate code into a temporal code. Nature. 2002;417:741–746. doi: 10.1038/nature00807. [DOI] [PubMed] [Google Scholar]
- Merchant H, Harrington DL, Meck WH. Neural basis of the perception and estimation of time. Annu Rev Neurosci. 2013;36:313–336. doi: 10.1146/annurev-neuro-062012-170349. [DOI] [PubMed] [Google Scholar]
- Mizuseki K, Buzsáki G. Preconfigured, skewed distribution of firing rates in the hippocampus and entorhinal cortex. Cell Reports. 2013;4:1010–1021. doi: 10.1016/j.celrep.2013.07.039. [DOI] [PMC free article] [PubMed] [Google Scholar]
- Naya Y, Suzuki WA. Integrating what and when across the primate medial temporal lobe. Science. 2011;333:773–776. doi: 10.1126/science.1206773. [DOI] [PubMed] [Google Scholar]
- Neunuebel JP, Knierim JJ. CA3 retrieves coherent representations from degraded input: direct evidence for CA3 pattern completion and dentate gyrus pattern separation. Neuron. 2014;81:416–427. doi: 10.1016/j.neuron.2013.11.017. [DOI] [PMC free article] [PubMed] [Google Scholar]
- Pastalkova E, Itskov V, Amarasingham A, Buzsáki G. Internally generated cell assembly sequences in the rat hippocampus. Science. 2008;321:1322–1327. doi: 10.1126/science.1159775. [DOI] [PMC free article] [PubMed] [Google Scholar]
- Patel J, Fujisawa S, Berényi A, Royer S, Buzsáki G. Traveling theta waves along the entire septotemporal axis of the hippocampus. Neuron. 2012;75:410–417. doi: 10.1016/j.neuron.2012.07.015. [DOI] [PMC free article] [PubMed] [Google Scholar]
- Quirk CR, Allen TA, Fortin NJ. Temporary inactivations of the hippocampus and prfrontal cortex impair memory for sequences of events. Soc Neurosci Abstr. 2013;39:97.19. [Google Scholar]
- Ranganath C, Ritchey M. Two cortical systems for memory-guided behavior. Nat Rev Neurosci. 2012;13:713–726. doi: 10.1038/nrn3338. [DOI] [PubMed] [Google Scholar]
- Skaggs WE, McNaughton BL. Replay of neuronal firing sequences in rat hippocampus during sleep following spatial experience. Science. 1996;271:1870–1873. doi: 10.1126/science.271.5257.1870. [DOI] [PubMed] [Google Scholar]
- Skaggs WE, McNaughton BL, Gothard KM, Markus EJ. An information-theoretic approach to deciphering the hippocampal code. Neural Inf Process Syst. 1993;5:1030–1037. [Google Scholar]
- Skaggs WE, McNaughton BL, Wilson MA, Barnes CA. Theta precession in hippocampal neuronal populations and the compression of temporal sequences. Hippocampus. 1996;6:149–172. doi: 10.1002/(SICI)1098-1063(1996)6:2%3C149::AID-HIPO6%3E3.0.CO;2-K. [DOI] [PubMed] [Google Scholar]
- Smith DM, Mizumori SJ. Hippocampal place cells, context, and episodic memory. Hippocampus. 2006;16:716–729. doi: 10.1002/hipo.20208. [DOI] [PubMed] [Google Scholar]
- Sokal RR, Rohlf FJ. Biometry: the principles and practice of statistics in biological research. New York: W.H. Freeman; 1995. [Google Scholar]
- Tsodyks MV, Skaggs WE, Sejnowski TJ, McNaughton BL. Population dynamics and theta rhythm phase precession of hippocampal place cell firing: a spiking neuron model. Hippocampus. 1996;6:271–280. doi: 10.1002/(SICI)1098-1063(1996)6:3%3C271::AID-HIPO5%3E3.3.CO;2-Q. [DOI] [PubMed] [Google Scholar]
- Vinogradova OS. Hippocampus as a comparator: role of the two input and two output systems of the hippocampus in selection and registration of information. Hippocampus. 2001;11:578–598. doi: 10.1002/hipo.1073. [DOI] [PubMed] [Google Scholar]
- Wood ER, Dudchenko PA, Eichenbaum H. The global record of memory in hippocampal neuronal activity. Nature. 1999;397:613–616. doi: 10.1038/17605. [DOI] [PubMed] [Google Scholar]
- Wood ER, Dudchenko PA, Robitsek RJ, Eichenbaum H. Hippocampal neurons encode information about different types of memory episodes occurring in the same location. Neuron. 2000;27:623–633. doi: 10.1016/S0896-6273(00)00071-4. [DOI] [PubMed] [Google Scholar]