Abstract
We report on a microfluidic mixer fabrication platform that increases the versatility and flexibility of mixers for biomolecular applications. A sandwich-format design allows the application of multiple spectroscopic probes to the same mixer. A polymer spacer is ‘sandwiched’ between two transparent windows, creating a closed microfluidic system. The channels of the mixer are defined by regions in the polymer spacer that lack material and therefore the polymer need not be transparent in the spectral region of interest. Suitable window materials such as CaF2 make the device accessible to a wide range of optical probe wavelengths, from the deep UV to the mid-IR. In this study, we use a commercially available 3D printer to print the polymer spacers to apply three different channel designs into the passive, continuous-flow mixer, and integrated them with three different spectroscopic probes. All three spectroscopic probes are applicable to each mixer without further changes. The sandwich-format mixer coupled with cost-effective 3D printed fabrication techniques could increase the applicability and accessibility of microfluidic mixing to intricate kinetic schemes and monitoring chemical synthesis in cases where only one probe technique proves insufficient.
Keywords: microfluidics, fluorescence, infrared, spectroscopy, protein folding
I. Introduction
Microfluidic mixing has developed into an effective technique to study biochemical kinetics [1–3], synthesis [4–6], and protein folding [7–10]. As the field grows, the need for more versatile mixers grows with it. The vast majority of mixers in the literature are designed specifically for one type of spectroscopy, including (but not limited to) fluorescence [7, 11–13], Raman [14, 15], UV/vis absorbance [16], IR [17, 18], NMR [19], or circular dichroism [20]. Microfluidic mixers accommodating only one spectroscopic probe are generally used to study a distinct variable such as concentration of a single species for determining reaction kinetics. There are clear advantages of coupling multiple probes within the same mixer interface to interrogate multiple variables for complex reactions, and to provide complementary information about the reaction dynamics. For instance, UV/vis absorption spectroscopy has been used to measure kinetics of a protein folding reaction or an enzyme reaction in a microfluidic mixer by relating the observed absorption to the time dependent concentration of the reactant or product. Such studies do not provide much insight on the catalytic mechanism, however; insight on the nature of catalysis requires multiple complementary spectroscopic probes that are more structurally specific, such as fluorescence and infrared spectroscopy. Previously, multiple probes have been incorporated in a microfluidic reactor, although not all probes were in situ [21]. Integration of multiple in situ probes has also been accomplished by coupling IR spectroscopy with temperature and pH diagnostic testing [22], but a general mixer fabrication technique to more easily incorporate multiple spectroscopic probes is still lacking.
Currently, the most common method to fabricate microfluidic mixers is to use soft lithography technology to fabricate ‘negative’ molds from a silicon wafer [23, 24]. A polydimethylsiloxane (PDMS) and curing agent mixture is laid over the mold and, once cured, is removed and usually permanently sealed with a glass cover slide, creating a closed mixer that is optically accessible. Not only can the mold be expensive, but also the finished PDMS mixer has optical transparency only from the near-UV to near IR regions. PDMS mixers are not compatible with vibrational spectroscopy as a reaction probe because PDMS has many strong absorption bands in the mid-IR region [25, 26]. Such mixers are also not suitable for use with native tryptophan fluorescence of proteins, since the UV excitation wavelength produces strong background fluorescence from the PDMS. Therefore, the need exists for a cheap and versatile mixer design that can couple multiple spectroscopic probes without problems of optical transparency. Previously, we reported on a sandwich-format mixer, made of two optically transparent windows, sandwiching a polymer spacer that had microfluidic channels cut out from it [27]. The channels in the polymer spacer were cut using an expensive CO2 laser cutter, making this fabrication technique unattainable for many researchers on a tight budget. Therefore, the need still exists to develop fabrication techniques available to all. Furthermore, the mixer utilized only IR spectroscopy as a probe of reaction progress. The sandwich mixer, however, has the potential to be coupled to multiple spectroscopic probes, since windows that are optically transparent in multiple spectral regions are readily available.
The recent emergence of inexpensive commercially available 3D printers has led to their application as useful tools for producing microfluidic mixers and mixer components [28–33]. Commercial desktop printers can now print with x-y-z axis resolution under 100 microns and printer costs sometimes under US$1000, potentially making 3D printing a time and cost effective technique to produce micron-sized features in mixers. Furthermore, many 3D printers have wide materials flexibility. There are a multitude of materials on the market that are inexpensive with varied chemical and mechanical properties, including solvent compatibility and electrical conductivity. For these reasons, 3D printing has potential to be a versatile and low cost replacement to the traditional silicon wafer mold fabrication technique of PDMS microfluidic mixers.
Here, we report on the implementation of a sandwich format microfluidic mixer incorporating three different 3D printed channel designs. We also report the integration of three different spectroscopic probes with these mixer designs, infrared absorption, UV/vis absorption, and fluorescence. This work represents a significant advance in the versatility of microfluidic mixers, in terms of the channel design and the compatibility with multiple spectroscopic probes. The requirement of optical transparency of mixer material is alleviated when utilizing the sandwich mixer design. Since the 3D printed spacer only defines the boundaries of the microfluidic channels, optical access is possible through the windows, depending only on the transparency of the window material in the spectral region of interest. Finding window materials with optical transparency (for example, CaF2 is optically transparent from the ultraviolet to the far infrared) is simple compared to fabricating a mixer entirely out of a polymeric material (for example PDMS is only optically transparent throughout the visible region). A 3D printed spacer gives further freedom to the researcher to implement a multitude of mixing channel designs cheaply and quickly. We demonstrate this versatility by implementing three different mixer channel designs, a serpentine mixer, a droplet-forming mixer, and a cross-shaped mixer, coupled with the three different probe spectroscopies. Finally, a pragmatic objective of this work is to establish a cheap and accessible mixer design and fabrication technique that enables a wide range of applications of microfluidic mixing to biochemical and biophysical problems.
II. Experimental
II.A. 3D Printing mixers
The 3D printer used was a model HD2x from Airwolf3D (Costa Mesa, CA). The thermopolymer used was polylactic acid (PLA) from MatterHackers (Lake Forest, CA). PLA was chosen due to its cost and ease of printing. It is perfectly feasible to chose another material to print with based on chemical and mechanical needs. 3D modeling was completed on COMSOL Multiphysics V4.3a (Comsol Inc., Stockholm, Sweden) and exported as a .stl file. The .stl file was prepared for slicing (repaired) with Netfabb freeware (netfabb GmbH, Parsberg, Germany). The model was sliced with Slic3r, public domain freeware used to convert a digital 3D model into printing code for 3D printers. The printing code (.gcode file) was then loaded into Repetier-Host (Hot World GmbH & Co. KG, Willich, Germany) and printed. All designs were printed in one thin layer (200–250 μm) of PLA under conditions laid out in the supplementary information (stacks.iop.org/JMM/25/124002/mmedia).
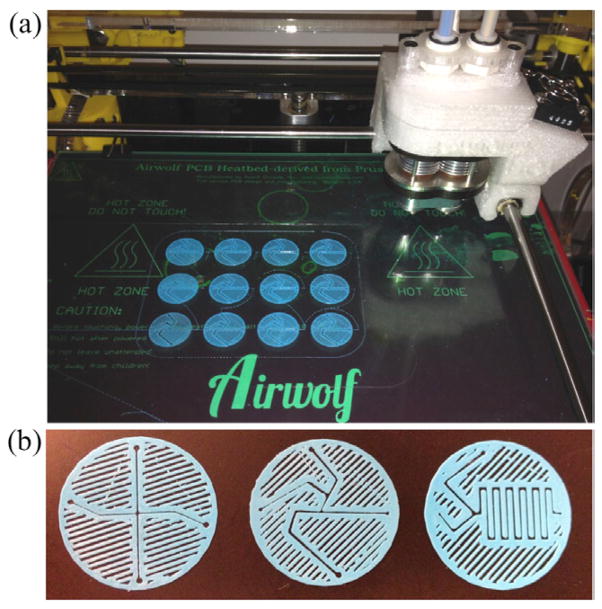
Typically, a grid of 12 mixers was printed at a time (figure 1(a)), at a cost of approximately US$0.005 per mixer, and of the mixers that were printed, the cleanest were used and the rest discarded. In our designs, shown in figure 1(b), regions without printed material define the channels of the mixer, rather than printing actual channel wells. However, not all regions that are absent of material represent channels. The other regions without material (located on the outside of the perimeters that define actual channels) are due to printing with less than 100% infill. We typically use between 0–50% infill, which cuts down on material and time usage for each print. After printing, the mixers were squeezed between two glass slides, fastened with binder clips, and annealed in an oven at 170 °C for one minute increments. This treatment was used primarily to decrease both the thickness of the actual spacer (to 125–150 μm) and the width of the printed channels as well as to smooth the faces of the PLA. This aided in creating a liquid-tight seal during mixer assembly. Once the spacer is annealed and placed into the mixer assembly (see below), there are no problems with leaking at the working flow rates described. Even when the flow rates were increased to more than two times the working flow rates described below, the mixers still had no leaks. If the printed spacers were assembled into the mixer without first annealing, the windows did not properly seal and the mixer leaked through the polymer-window interface. The 3D printing and annealing processes will never be able to reproduce exact copies of a specific channel design, but this is not the intention of this approach. Each assembled mixer can be independently characterized and calibrated and subsequently used multiple times with no need to replace it after each experiment or application. The final 3D printed products are shown in figure 1(b), with all three designs that will be discussed. From left to right are the cross-mixer, the droplet-mixer, and the serpentine-mixer.
Figure 1.
3D printed mixers (a) grid of twelve single layer mixer prints still on the printing bed (b) images of the three mixer designs. The cross-mixer, the droplet-mixer, and the serpentine-mixer, left to right. Each circular mixer design has a 25 mm diameter.
II.B. Mixer assembly
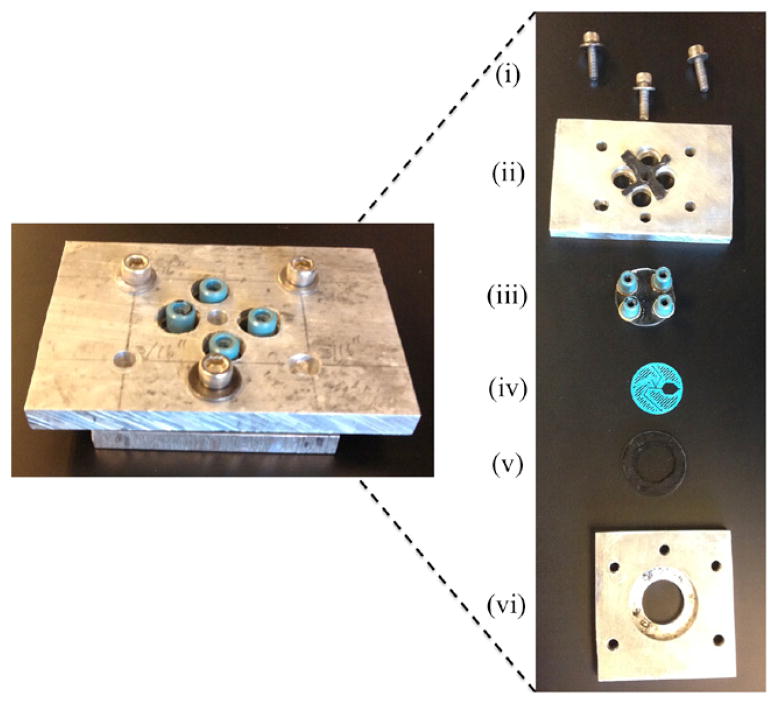
The assembled mixer, shown in figure 2, is made of multiple parts put together in a sandwich form. The mixer is assembled with the 3D printed spacer (non-permanently) sealed between two transparent windows. The windows are the only component of the entire mixer that needs to be transparent to the wavelength of the probe light. Therefore, we use calcium fluoride due to its transparency from mid-IR to UV wavelengths. The top window is drilled with four 1 mm diameter holes to allow fluid transport to the channels of the mixer. Nanoports (IDEX Health & Science, Oak Harbor, WA) are permanently fastened to the outside of the drilled window creating the tubing connections to the mixer. Finally, the outer casing consists of two pieces of scrap aluminum, cut and drilled with in-house equipment, to fit over the Nanoports and against the windows, which are bolted to each other to create a tight seal. For each mixer design, the only component that changes is the 3D printed spacer.
Figure 2.
The left image is the assembled mixer without the tubing connected. In the right image, each part of the mixer assembly is shown individually. (i) Screws that hold the mixer together. (ii) Top aluminum casing piece along with a rubber protective cushion between the aluminum plate and top window. (iii) Top window with Nanoport connections fastened permanently to the window, directly over the through holes drilled in the window for liquid transport. (iv) 3D printed mixer spacer that is sandwiched between the transparent windows. (v) Bottom transparent window along with a rubber cushion. (vi) Bottom aluminum plate with a counter-sunk hole to hold mixer in place.
II.C. Fluorescence and UV/vis absorbance microscopy
A fluorescence microscope (Olympus IX81; Center Valley, PA) was used to collect data for both the fluorescence and visible absorbance experiments. For the experiments described below, a 10x objective (Atlanta Microscope Service; Atlanta, GA) was used. Microscope images were captured on a Hamamatsu (Bridgewater, NJ) C9100-14 ImageM-1k EM-CCD Camera. The microscope and camera were controlled by Slidebook 5.0 software (Imaging Innovations, Inc.; Denver, CO).
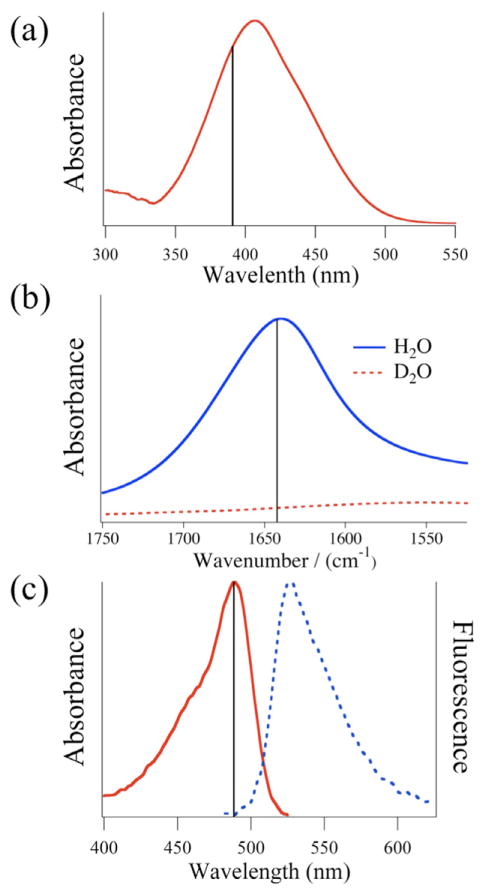
The UV/visible absorbance flow experiment used a halogen lamp source that was coupled through the sample with the microscope to obtain absorbance images. The dye dimethyl yellow (MY) was chosen for its strong UV/visible absorbance. The probe light was passed through a bandpass filter at 388 ± 20 nm (Semrock Inc.; Lake Forest, IL), corresponding to the peak absorbance of MY (figure 3(a)). The filtered light was passed through the sample, top to bottom, collected by the objective, and directed to the EM-CCD camera. Both MY and ethanol had flow rates of 20 μL min−1 in the serpentine-mixer. Absorbance images were collected with a 100 ms camera integration time.
Figure 3.
The three spectroscopic probes used in the current study. (a) Dye (MY) absorbance in the visible region. The bandpass filter used for absorbance measurements is centered at 388 ± 20 nm (solid line). (b) The absorbance spectrum of H2O (solid line) and D2O (dashed line) in the mid-infrared region. For the current study, measurements were taken at 1643 cm−1 (solid line), corresponding to the strong bending vibrational mode of water. (c) Absorbance (solid) and fluorescence (dashed) spectrum of fluorescein. The excitation filter is a bandpass filter centered at 482 ± 9 nm (solid line) and the fluorescence filter is a long-pass filter at 510 nm.
The fluorescence flow experiment used the water soluble dye, fluorescein, which was excited at 482 nm using the filtered output of a HBO mercury short-arc lamp from Osram (Danvers, MA). Emission from the sample, which peaks at 530 nm as shown in figure 3(c), was transmitted through a long-pass filter at 510 nm and directed to the camera. Separate fluorescein and KI solutions were flowed at a rate of 0.25 μL min−1 while the hexanes flow rate was 14 μL min−1 in the droplet-mixer. Fluorescence images were collected with a 50 ms integration time.
II.D. Infrared absorbance microscopy
A Varian 600 Series FTIR Microscope (Agilent Technologies, Inc.; Santa Clara, CA) was used, with modifications, to collect IR absorbance images of flow experiments. An external quantum cascade laser IR source (QCL; Daylight Solutions, San Diego, CA) first travelled through a shutter (to aid in subtracting dark noise from each image) and then was fed into the microscope using its transmission optical path. After the collimated beam passed through the sample, it was magnified by a broadband infrared transmissive ZnSe objective (Edmund Optics Inc; Barrington, NJ). The objective magnified the beam onto a Hg:Cd:Te focal plane array (FPA) detector for imaging. The FPA detector contains a grid of 128 × 128 pixels that is used to acquire an image of the transmitted IR intensity in the range of 2–12 μm. The final magnification due to the objective was 14 ×. The detector integration time was set to 100 μs while the detector gain, bias, and DC offset were adjusted to use the full dynamic range of the detector. For the H2O/D2O flow experiment the QCL was tuned to 1643 cm−1, corresponding to the strong bending vibrational mode of H2O, as shown in figure 3(b).
An infrared absorbance image for the H2O/D2O flow experiment was produced by acquiring both a sample and background image and then computing absorbance as the negative log of the ratio of sample to background. Here, the sample image is acquired with an D2O sample flow and H2O sheath flow, whereas the background image is acquired with only D2O flowing through the mixer. D2O had a sample flow of 3 μL min−1 and the H2O sheath had a flow of 50 μL min−1 for each side in the cross-mixer.
II.E. Sample preparation
All liquid solutions were flowed from disposable plastic syringes using syringe pumps (KD Scientific; Holliston, MA), through PEEK tubing and into the assembled mixer via Nanoport connections (both from Idex; Oak Harbor, WA).
III.E.1. Fluorescence experiments
Fluorescein sodium salt was purchased from Sigma-Aldrich (St. Louis, MO) and dissolved in deionized water at a concentration of 4 μM. Potassium iodide (KI) pellets (Alfa Aesar; Ward Hill, MA) were dissolved in deionized water to a concentration of 1 M. Hexanes (EMD Chemicals; Gibbstown, NJ) was used as the organic phase to form aqueous fluorescein/KI droplets.
II.E.2. Visible absorbance experiments
Dimethyl yellow was purchased from Sigma-Aldrich (St. Louis, MO) and dissolved in ethanol at a concentration of 50 ng mL−1.
II.E.3. IR mixing experiments
Filtered, deionized H2O was used along with D2O purchased from Cambridge Isotopes (Tewksbury, MA) and used straight from the bottle.
II.F. Theoretical modeling
In order to apply a timescale to the flow experiments, COMSOL Multiphysics Version 4.3a (Comsol Inc.; Stockholm, Sweden) was used to simulate each mixer. A series of visible images were taken on the Olympus microscope with the 10× objective in order to obtain the actual geometry of each mixer. The geometry was then recreated in COMSOL and a laminar flow, stationary study was carried out to compute the linear flow velocity of each mixer corresponding to the volumetric pump flow rates and cross-sectional area of the channels of the mixers. The flow velocity, u, is dictated by the incompressible Navier–Stokes equation:
| (1) |
where ρ is the fluid density, u is the velocity field, p is the pressure, μ is the dynamic viscosity, and F is a volume force, such as gravity. Parameters for the simulations can be found in the supplementary information (stacks.iop.org/JMM/25/124002/mmedia).
III. Results and discussion
Three different mixer designs were coupled with three spectroscopic probes to demonstrate the utility and versatility of pairing the sandwich-format mixer with 3D printing spacers. The three mixer designs were chosen to represent commonly used mixer designs found in the literature, since these are most likely to be useful to the field. The droplet-forming mixer has previously been shown to be a useful mixer to follow chemical kinetics [34] and the dynamics of mixing within droplet mixers was recently reviewed [35]. A second mixer type, the serpentine mixer, has been shown to be a viable design to follow reactions kinetics on a timescale ranging from milliseconds to minutes [23]. Finally, the cross-shaped mixer, which perhaps is the simplest and most widely used hydrodynamic focusing fast-mixer was pioneered by the elegant study from Knight et al, which characterized the mixing of a microfluidic cross-shaped mixer [36].
The mixer spacers were first 3D printed as described above along with the parameters described in table S2 the supplementary information. A grid of 12 mixers was printed at a time to increase throughput. Typically, of the 12 mixers printed per batch, 4–6 mixers were useable. The others sometimes had smudged material or sealed channels. The useable mixers were collected and subjected to the annealing process in order to smooth out the faces of the print as well as reduce the diameter of the channels. Data were collected from three separate prints of the same region in the droplet mixer in order to determine the reproducibility of both the 3D printed mixer pre-annealing and post-annealing and is shown in table S3. The pre-annealed mixers had an average channel diameter of 406 ± 38.9 μm. The annealing process effectively reduced the average channel diameter to 151 ± 29.1 μm. The amount of reduction could be controlled with temperature and length of time of the annealing process. The annealed mixers with the narrowest channel diameter that still maintained the integrity of the original printed design were chosen for experimentation. Due to the resolution limitations of the printer as well as imperfect reduction in the diameter of the mixer channels during the annealing process, small aberrations are visible in the channels. However, under the conditions described here, fluid flow was still well within the laminar regime and therefore the small aberrations did not cause disruptions in flow by phenomena such as turbulent mixing zones.
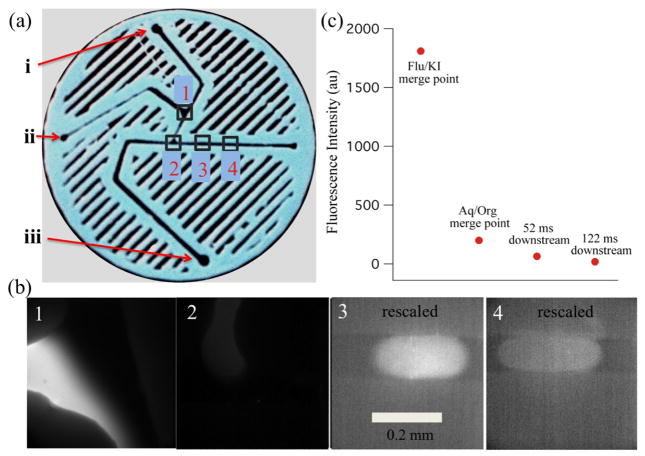
Figure 4 shows results obtained with the droplet-forming mixer coupled with fluorescence imaging to probe the mixing process. The entire field of view was illuminated with the 482 nm probe beam, corresponding to fluorescein absorbance and then a long-pass filter directed the resulting fluorescein emission having a wavelength of 510 nm or greater to the CCD camera (figure 3(c)). The fluorescein sample was mixed with a diffusion limited fluorescence quencher, KI, upstream from where the actual droplets were produced (figures 4(a) and (b), box 1). The fluorescein and KI mixed while travelling down the channel to where the aqueous solution merged with the organic phase, in this case hexanes, and droplets were formed (figures 4(a) and (b), box 2). The organic phase traveled at more than 20 times the volumetric flow rate of the total aqueous phase, and therefore soon after the fluorescein/KI mixture protruded into the hexanes channel, it was quickly pinched off into small droplets that continued down the hexanes channel for analysis.
Figure 4.
Droplet mixer with fluorescence detection. (a) Image of the droplet mixer along with numbered boxes, corresponding to the fluorescence images. (b) Box 1 shows the region where the fluorescein (from left) and KI solution (from top) streams merged. Box 2 shows the region where the aqueous fluorescein/KI solution (from top) meets the organic hexanes (from left) and the droplet is starting to form. Box 3, which has been rescaled to show contrast, shows the fluorescein/KI droplet (moving left to right) at a point equivalent to 52 ms downstream from the aqueous/organic merge point. Box 4, which has been rescaled to show contrast, shows the droplet farther downstream (moving left to right), equivalent to 122 ms from the aqueous/organic merge point. The contrast of each image was adjusted to make important details visible (the maximum intensity decreases from left to right), therefore the apparent brightness in each image does not reflect actual fluorescence intensity. (c) Plot of the average fluorescence intensity (counts) with respect to each of the imaged regions of the mixer.
In figure 4(a), an image of the mixer is shown with the KI, fluorescein, and hexanes inlets labelled as (i), (ii), and (iii), respectively. The fluorescence images shown in figure 4(b), labelled 1–4, correspond to images taken at the corresponding locations shown in figure 4(a). Images from boxes 3 and 4 show the fluorescein/KI droplets at 52 and 122 ms downstream from droplet formation. It should be noted that the contrast of images 3 and 4 was adjusted to permit the visualization of the fluorescence, which is highly quenched at these points (nothing is visible in images 3 and 4 if they are plotted with the same contrast as 1). In image 2, the fluorescence is slightly dimmer at the interface of the forming droplet with the organic phase, which appears to be due to a difference in the focus of the image. This effect is due to the difference in refractive index of the two media, which perturbs the focus at the interface. Nevertheless, this effect is minor compared to the overall quenching of the sample. Figure 4(c) shows the actual average fluorescence intensity of the fluorescein in each image from figure 4(b). The initial fluorescence intensity was high before mixing with KI, but was almost fully quenched by the time the droplet formed, and therefore was mixed completely in the 1.6 s it took the aqueous solution to merge with the organic one. Changing the flow rates of the aqueous solution or altering the design of where the two aqueous solutions meet with respect to the organic can tune the amount of time from merge point to droplet formation. From the aqueous/organic merge point to further downstream, the fluorescence continued to decrease slightly, but the small decrease in intensity levels indicate that mixing was almost fully completed by droplet formation. These results show that the droplet mixer is useful to follow reactions on the scale of hundreds of milliseconds to seconds.
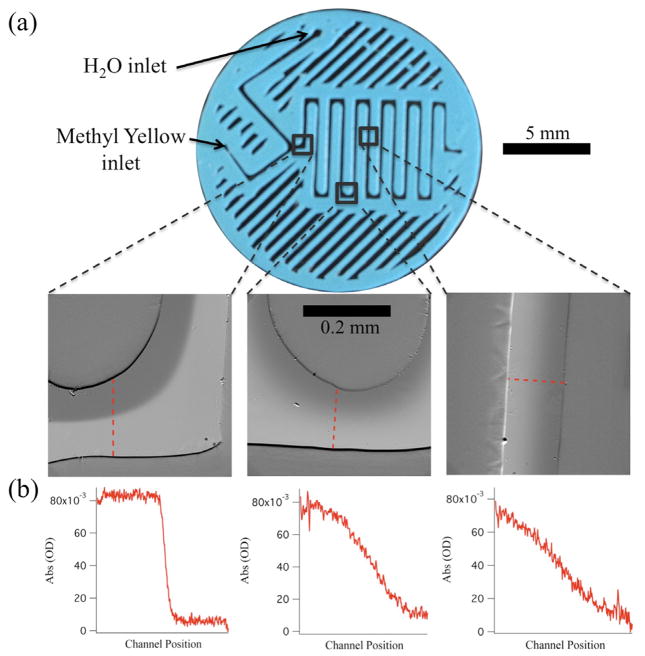
We have coupled a second probe spectroscopy, UV/visible absorbance to the serpentine mixer to demonstrate the versatility of sandwich-format mixers (figure 5). UV/visible absorbance images were obtained by transmitting a probe beam through the transparent mixer. The probe beam consists of a narrow spectral bandwidth centered at 388 nm, near the absorbance maximum of the dimethyl yellow (MY) sample (figure 3(a)). The transmitted probe beam was collected by the microscope objective and imaged by the CCD camera. Figure 5 shows the results from the MY flow experiment. Figure 5(a) shows the overall geometry of the printed serpentine mixer along with labelled inlets and outlined portions that correspond to the location of the absorbance images shown below the mixer. Each absorbance image was produced by calculating the negative log of the ratio of a sample image (MY flowing) to a background image (no MY flowing, only ethanol). Absorbance intensity is plotted in greyscale, with the lighter shade of grey corresponding to higher absorbance. From left to right, the time from the merge point of MY and water was increasing from 22 ms, to 730 ms, to 1.04 s, respectively, and therefore the distinct boundary of MY and water that exists in early time fades as slow diffusion across the channel occurs. Figure 5(b) shows the calculated absorbance level from the cross-section of the channels, defined by the dashed lines in each absorbance image. The spectral resolution of each image is limited by the width of the bandpass filter used to select the probe wavelengths, which in this case has a FWHM = 20 nm. Figure 5(b) clearly shows the gradual mixing between the MY sample and ethanol, by the smearing of the boundary. The results also demonstrate that UV/visible absorbance spectroscopy is a viable probe of mixing and more generally of reactivity in a sandwich-format mixer.
Figure 5.
Serpentine mixer with UV/visible absorbance detection. (a) Image of the mixer; the three outlined regions represent the positions along the flow corresponding to the absorbance images below the mixer. From left to right, the images represent times of 22 ms, 730 ms, and 1.04 s after the initial merge point. Absorbance was calculated as the negative logarithm of the ratio between sample image intensity with MY/ethanol flowing through the mixer and background image intensity with only ethanol flowing through the mixer. (b) Plots of the cross-sectional absorbance of the MY sample at the designated positions shown in the absorbance images above.
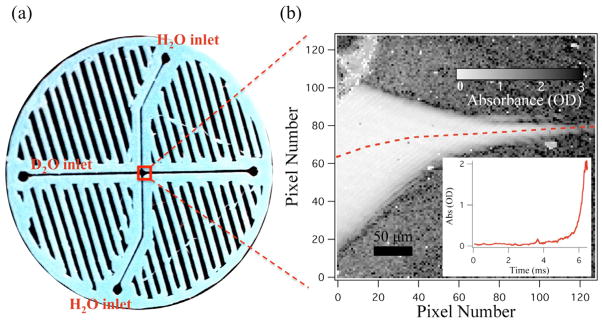
We coupled three different spectroscopic probes, fluorescence, UV/visible absorbance, and infrared spectroscopy to the cross-shaped mixer because it is the simplest, fastest, and most widely used mixer. Figure 6 shows the implementation of IR absorbance imaging with the cross-shaped mixer. In this case, a simple mixing experiment was conducted between a D2O sample stream that was hydrodynamically focused by H2O side flows. The absorbance at 1643 cm−1 was used to probe the mixing, corresponding to the strong bending vibrational mode of H2O and minimal absorbance of D2O (figure 3(b)). Figure 6(a) shows the overall geometry of the cross-shaped printed mixer, along with labelled D2O and H2O inlets. The outlined portion of figure 6(a) represents the mixing region; a magnified IR absorbance image at 1643 cm−1 of this region is shown in figure 6(b). The absorbance was calculated from the negative log of the ratio of a sample image (D2O sample flowing through H2O side flow) and a background image (only D2O flooding the mixer). Absorbance intensity is represented as a greyscale image, with light grey representing small absorbance. The dark regions are due to the strongly absorbing H2O in the side flow. The inset on figure 6(b) plots absorbance versus time from the line profile marker out by the dotted line on the absorbance image. The absorbance level stays very close to zero at early times before the D2O jet is focused to its final width. Once the jet is hydrodynamically focused, advective diffusion works to rapidly mix the D2O and H2O, causing the absorbance intensity to quickly increase.
Figure 6.
Cross mixer with mid-infrared detection. (a) Image of the cross-mixer showing the D2O sample inlet and H2O side flow inlets. (b) Magnified mid-infrared absorbance image (grey scale of the mixing region) at 1643 cm−1. Absorbance is calculated as the negative logarithm of the ratio of sample and background images as described in the text. The H2O side flows squeeze the D2O into a jet, causing mixing, and an increase in the absorbance as shown in the inset. The pixel position to time conversion was done through COMSOL simulations. D2O had a sample flow of 3 μL min−1 and the H2O sheath had a flow of 50 μL min−1 for each side in the cross-mixer.
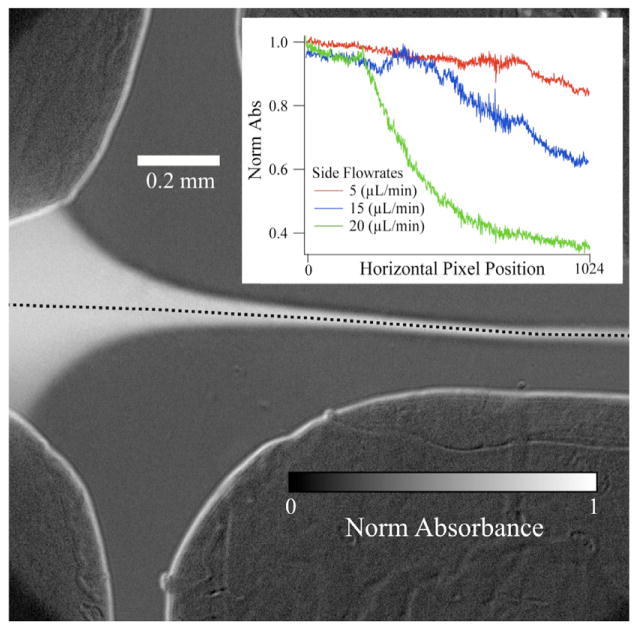
The cross-shaped mixer was also integrated with UV/visible absorbance and fluorescence probes to further demonstrate the utility and versatility of the sandwich-format mixer. Figure 7 shows a UV/visible absorbance image of a sample stream (MY dye in ethanol solution) flowing in the cross-shaped mixer. The experiment follows the change in absorbance of the MY sample versus time (position along the jet), and thus measures the dilution caused by hydrodynamic focusing and advective mixing (dilution) of the sample stream with the ethanol side streams. The inset in figure 7 plots the absorbance of MY, normalized to the highest value, versus the horizontal pixel position within the detector for three different side flow rates. As the side flow rate increases, hydrodynamic focusing occurs quicker. Therefore advective diffusion mixes the MY and water sooner, and the absorbance levels decrease faster, due to dilution of the sample.
Figure 7.
Cross mixer with UV/visible absorbance detection. An ethanol solution of MY flowed through the sample channel at 3 μL min−1 and was hydrodynamically focused by ethanol side flows. Inset, absorption intensity of MY jet along dashed line (in main image), normalized to its maximum value, with respect to horizontal (left to right) pixel position of the camera for three separate side flow rates. As the side flow rate increases, the amount of advective diffusion increases and the sample is diluted more rapidly, hence the faster decrease in absorbance.
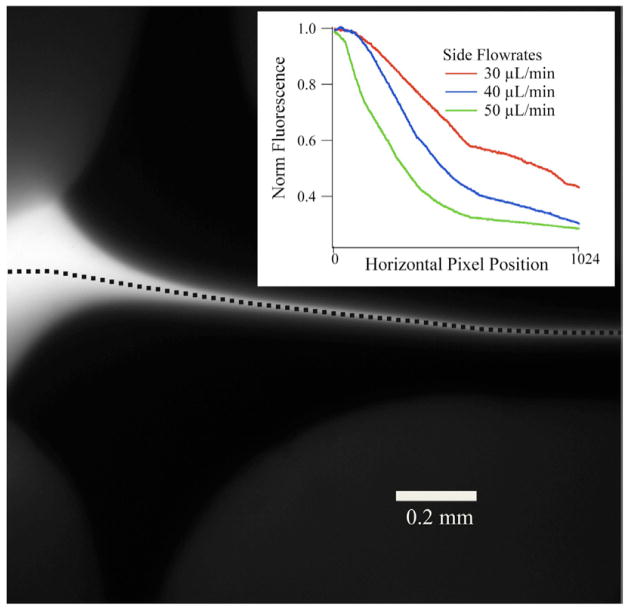
Figure 8 shows the results of applying the third spectroscopic probe, fluorescence spectroscopy to the cross-shaped mixer. The same fluorescein sample as shown above with the droplet mixer (figure 4) was flowed as the sample in the cross-shaped mixer and KI solution flowing through the side channels at various flow rates. The KI quenches the emission from fluorescein at different positions along the jet, according to the magnitude of the KI flow rate. As the flow rate increases for KI, the fluorescein jet is focused to its final width sooner and the KI molecules quench the fluorescence at earlier positions in the mixer (figure 8, inset).
Figure 8.
The same cross mixer as figure 6, applied to another probe technique. In figure 6, the cross mixer was used with an infrared spectroscopy probe. Here, the cross mixer is applied to fluorescence spectroscopy with the same fluorescein sample as in figure 4. The fluorescein is flowing at 3 μL min−1 and is hydrodynamically focused by the side flows. Inset, fluorescence intensity normalized to the maximum intensity along the dashed line of the jet (in main image), with respect to the horizontal (left to right) pixel position of the camera for three separate KI side flow rates.
IV. Conclusions
We have implemented the sandwich-format mixer fabrication technique in three uniquely designed 3D printed mixers, in order to assess the utility of the technique with respect to multiple spectroscopic probes. The sandwich format mixer create mixers with far wider applicability to different spectroscopic probes than previous fabrication techniques. Two optically transparent windows sandwich a spacer for the assembly of the mixer. In this case, the spacer was a 3D printed polymer with the microfluidic channels defined by lack of printed material and the only optically transparent requirement was the sandwiching windows. Serpentine, droplet, and cross-shaped mixers were printed and incorporated into the sandwich-format mixer and used alongside three separate spectroscopic probes. Fluorescence, visible absorption, and IR absorption spectroscopies were the three types of spectroscopic probes used to exhibit the versatility of the sandwich-format mixer. In addition to showing all three spectroscopic probes with different mixer designs, the same mixer was also implemented with the three probes as well, in order to prove its utility.
Furthermore, the coupling of the sandwich-format mixer with 3D printed spacers helps to extend the versatility of the mixer, creating more of a custom microfluidic production platform. 3D printing provided an effective method to quickly and cheaply design and produce the spacers for the mixer, which completely determine the geometry of the microfluidic channels. We believe this fabrication method can be applied to extending versatility within the microfluidic mixing community and make that community more appealing to new users.
Supplementary Material
Acknowledgments
This work was supported by NIH grants GM053640 and GM068036 (RBD) and by an NSF graduate fellowship DGE-0940903 (MJR). We acknowledge Michael Hu, a high school intern from The Gwinnett School of Mathematics, Science, and Technology (Atlanta, GA), who was helpful in developing techniques to 3D print very small and detailed objects. We also thank G Raghunath for the H2O/D2O infrared spectrum.
Footnotes
Online supplementary data available from stacks.iop.org/JMM/25/124002/mmedia
References
- 1.Buchegger W, Haller A, van den Driesche S, Kraft M, Lendl B, Vellekoop M. Studying enzymatic bioreactions in a millisecond microfluidic flow mixer. Biomicrofluidics. 2012;6:012803–9. doi: 10.1063/1.3665717. [DOI] [PMC free article] [PubMed] [Google Scholar]
- 2.Li Y, Xu F, Liu C, Xu Y, Feng X, Liu B-F. A novel microfluidic mixer based on dual-hydrodynamic focusing for interrogating the kinetics of DNA-protein interaction. Analyst. 2013;138:4475–82. doi: 10.1039/c3an00521f. [DOI] [PubMed] [Google Scholar]
- 3.Park HY, Kim SA, Korlach J, Rhoades E, Kwok LW, Zipfel WR, Waxham MN, Webb WW, Pollack L. Conformational changes of calmodulin upon Ca2+ binding studied with a microfluidic mixer. Proc Natl Acad Sci. 2008;105:542–7. doi: 10.1073/pnas.0710810105. [DOI] [PMC free article] [PubMed] [Google Scholar]
- 4.Duncanson WJ, Lin T, Abate AR, Seiffert S, Shah RK, Weitz DA. Microfluidic synthesis of advanced microparticles for encapsulation and controlled release. Lab Chip. 2012;12:2135–45. doi: 10.1039/c2lc21164e. [DOI] [PubMed] [Google Scholar]
- 5.Li W, Greener J, Voicu D, Kumacheva E. Multiple modular microfluidic (M3) reactors for the synthesis of polymer particles. Lab Chip. 2009;9:2715–21. doi: 10.1039/b906626h. [DOI] [PubMed] [Google Scholar]
- 6.Nightingale AM, de Mello JC. Microscale synthesis of quantum dots. J Mater Chem. 2010;20:8454–63. [Google Scholar]
- 7.Burke KS, Parul D, Reddish MJ, Dyer RB. A simple 3D-focusing, continuous-flow mixer for the study of fast protein dynamics. Lab Chip. 2013;13:2912–21. doi: 10.1039/c3lc50497b. [DOI] [PMC free article] [PubMed] [Google Scholar]
- 8.Hertzog DE, Michalet X, Jäger M, Kong X, Santiago JG, Weiss S, Bakajin O. Femtomole mixer for microsecond kinetic studies of protein folding. Anal Chem. 2004;76:7169–78. doi: 10.1021/ac048661s. [DOI] [PMC free article] [PubMed] [Google Scholar]
- 9.Gilmanshin R, Dyer RB, Callender RH. Structural heterogeneity of the various forms of apomyoglobin: Implications for protein folding. Prot Sci. 1997;6:2134–42. doi: 10.1002/pro.5560061008. [DOI] [PMC free article] [PubMed] [Google Scholar]
- 10.Li Y, Liu C, Feng X, Xu Y, Liu B-F. Ultrafast microfluidic mixer for tracking the early folding kinetics of human Telomere G-Quadruplex. Anal Chem. 2014;86:4333–9. doi: 10.1021/ac500112d. [DOI] [PubMed] [Google Scholar]
- 11.Zhu L, Ghosh K, King M, Cellmer T, Bakajin O, Lapidus LJ. Evidence of multiple folding pathways for the villin headpiece subdomain. J Phys Chem B. 2011;115:12632–7. doi: 10.1021/jp206238y. [DOI] [PubMed] [Google Scholar]
- 12.Teilum K, Maki K, Kragelund BB, Poulsen FM, Roder H. Early kinetic intermediate in the folding of acyl-CoA binding protein detected by fluorescence labeling and ultrarapid mixing. Proc Natl Acad Sci. 2002;99:9807–12. doi: 10.1073/pnas.152321499. [DOI] [PMC free article] [PubMed] [Google Scholar]
- 13.Gambin Y, Simonnet C, VanDelinder V, Deniz A, Groisman A. Ultrafast microfluidic mixer with 3D flow focusing for studies of biochemical kinetics. Lab Chip. 2010;10:598–609. doi: 10.1039/b914174j. [DOI] [PubMed] [Google Scholar]
- 14.Masten DA, Foy BR, Harradine DM, Dyer RB. In situ Raman-spectroscopy of reactions in supercritical water. J Phys Chem. 1993;97:8557–9. [Google Scholar]
- 15.Barnes SE, Cygan ZT, Yates JK, Beers KL, Amis EJ. Raman spectroscopic monitoring of droplet polymerization in a microfluidic device. Analyst. 2006;131:1027–33. doi: 10.1039/b603693g. [DOI] [PubMed] [Google Scholar]
- 16.Ro KW, Lim K, Shim BC, Hahn JH. Integrated light collimating system for extended optical-path-length absorbance detection in microchip-based capillary electrophoresis. Anal Chem. 2005;77:5160–6. doi: 10.1021/ac050420c. [DOI] [PubMed] [Google Scholar]
- 17.Chan KLA, Kazarian SG. Label-free chemical detection in microfabricated devices using FT-IR spectroscopic imaging. Spectroscopy. 2012;27:22–30. [Google Scholar]
- 18.Kauffmann E, Darnton NC, Austin RH, Batt C, Gerwert K. Lifetimes of intermediates in the β-sheet to α-helix transition of β-lactoglobulin by using a diffusional IR mixer. Proc Natl Acad Sci. 2001;98:6646–9. doi: 10.1073/pnas.101122898. [DOI] [PMC free article] [PubMed] [Google Scholar]
- 19.Bart J, et al. A microfluidic high-resolution NMR flow probe. J Am Chem Soc. 2009;131:5014–5. doi: 10.1021/ja900389x. [DOI] [PubMed] [Google Scholar]
- 20.Kane AS, Hoffmann A, Baumgärtel P, Seckler R, Reichardt G, Horsley DA, Schuler B, Bakajin O. Microfluidic mixers for the investigation of rapid protein folding kinetics using synchrotron radiation circular dichroism spectroscopy. Anal Chem. 2008;80:9534–41. doi: 10.1021/ac801764r. [DOI] [PubMed] [Google Scholar]
- 21.Lee KS, Boccazzi P, Sinskey AJ, Ram RJ. Microfluidic chemostat and turbidostat with flow rate, oxygen, and temperature control for dynamic continuous culture. Lab Chip. 2011;11:1730–9. doi: 10.1039/c1lc20019d. [DOI] [PubMed] [Google Scholar]
- 22.Greener J, Tumarkin E, Debono M, Kwan CH, Abolhasani M, Guenther A, Kumacheva E. Development and applications of a microfluidic reactor with multiple analytical probes. Analyst. 2012;137:444–50. doi: 10.1039/c1an15940b. [DOI] [PubMed] [Google Scholar]
- 23.Wunderlich B, Nettels D, Benke S, Clark J, Weidner S, Hofmann H, Pfeil SH, Schuler B. Microfluidic mixer designed for performing single-molecule kinetics with confocal detection on timescales from milliseconds to minutes. Nat Protocols. 2013;8:1459–74. doi: 10.1038/nprot.2013.082. [DOI] [PubMed] [Google Scholar]
- 24.Yao S, Bakajin O. Improvements in mixing time and mixing uniformity in devices designed for studies of protein folding kinetics. Anal Chem. 2007;79:5753–9. doi: 10.1021/ac070528n. [DOI] [PubMed] [Google Scholar]
- 25.Cai DK, Neyer A, Kuckuk R, Heise HM. Optical absorption in transparent PDMS materials applied for multimode waveguides fabrication. Opt Matls. 2008;30:1157–61. [Google Scholar]
- 26.Mata A, Fleischman A, Roy S. Characterization of polydimethylsiloxane (PDMS) properties for biomedical micro/nanosystems. Biomed Microdevices. 2005;7:281–93. doi: 10.1007/s10544-005-6070-2. [DOI] [PubMed] [Google Scholar]
- 27.Kise DP, Magana D, Reddish MJ, Dyer RB. Submillisecond mixing in a continuous-flow, microfluidic mixer utilizing mid-infrared hyperspectral imaging detection. Lab Chip. 2014;14:584–91. doi: 10.1039/c3lc51171e. [DOI] [PMC free article] [PubMed] [Google Scholar]
- 28.Martino C, Berger S, Wootton RCR, deMello AJ. A 3D-printed microcapillary assembly for facile double emulsion generation. Lab Chip. 2014;14:4178–82. doi: 10.1039/c4lc00992d. [DOI] [PubMed] [Google Scholar]
- 29.Erkal JL, Selimovic A, Gross BC, Lockwood SY, Walton EL, McNamara S, Martin RS, Spence DM. 3D printed microfluidic devices with integrated versatile and reusable electrodes. Lab Chip. 2014;14:2023–32. doi: 10.1039/c4lc00171k. [DOI] [PMC free article] [PubMed] [Google Scholar]
- 30.Shallan AI, Smejkal P, Corban M, Guijt RM, Breadmore MC. Cost-effective 3D printing of visibly transparent microchips within minutes. Anal Chem. 2014;86:3124–30. doi: 10.1021/ac4041857. [DOI] [PubMed] [Google Scholar]
- 31.Kitson PJ, Rosnes MH, Sans V, Dragone V, Cronin L. Configurable 3D-Printed millifluidic and microfluidic ‘lab on a chip’ reactionware devices. Lab Chip. 2012;12:3267–71. doi: 10.1039/c2lc40761b. [DOI] [PubMed] [Google Scholar]
- 32.O’Neill PF, Ben Azouz A, Vázquez M, Liu J, Marczak S, Slouka Z, Chang HC, Diamond D, Brabazon D. Advances in 3D rapid prototyping of microfluidic devices for biological applications. Biomicrofluidics. 2014;8:052112. doi: 10.1063/1.4898632. [DOI] [PMC free article] [PubMed] [Google Scholar]
- 33.Rogers CI, Qaderi K, Woolley AT, Nordin GP. 3D printed microfluidic devices with integrated valves. Biomicrofluidics. 2015;9:016501. doi: 10.1063/1.4905840. [DOI] [PMC free article] [PubMed] [Google Scholar]
- 34.Bringer MR, Gerdts CJ, Song H, Tice JD, Ismagilov RF. Microfluidic systems for chemical kinetics that rely on chaotic mixing in droplets. Phil Trans R Soc A. 2004;362:1087–104. doi: 10.1098/rsta.2003.1364. [DOI] [PMC free article] [PubMed] [Google Scholar]
- 35.Baroud CN, Gallaire F, Dangla R. Dynamics of microfluidic droplets. Lab Chip. 2010;10:2032–45. doi: 10.1039/c001191f. [DOI] [PubMed] [Google Scholar]
- 36.Knight JB, Vishwanath A, Brody JP, Austin RH. Hydrodynamic focusing on a silicon chip: mixing nanoliters in microseconds. Phys Rev Lett. 1998;80:3863–6. [Google Scholar]
Associated Data
This section collects any data citations, data availability statements, or supplementary materials included in this article.


