Abstract
Early detection of oral cancer and its curable precursors can improve patient survival and quality of life. Hyperspectral imaging (HSI) holds the potential for noninvasive early detection of oral cancer. The quantification of tissue chromophores by spectral unmixing of hyperspectral images could provide insights for evaluating cancer progression. In this study, non-negative matrix factorization has been applied for decomposing hyperspectral images into physiologically meaningful chromophore concentration maps. The approach has been validated by computer-simulated hyperspectral images and in vivo tumor hyperspectral images from a head and neck cancer animal model.
Keywords: Hyperspectral imaging, spectral unmixing, non-negative matrix factorization, early cancer detection
1. INTRODUCTION
Around half a million patients receive the diagnosis of oral cancer worldwide each year, thus creating a significant worldwide health problem [1]. Oral cancer often goes undiagnosed until late stages of development when treatment is more expensive and less successful than early interventions, resulting in high mortality and morbidity rate. The overall 5-year survival rates for oral cancer have remained low at approximately 30% for the advanced disease. Early detection of oral cancer and its curable precursors remains the best way to ensure patient survival and improved quality of life. White light examination, which is the current approach to screening and identification of oral cancer, has low sensitivity and specificity for detecting precancerous or early cancerous lesions [2]. If a suspicious lesion is identified, biopsy and histological examination are required to assess its type and cancerous potential. Biopsy is an invasive, painful, expensive, and time-consuming procedure which relies heavily on the familiarity and skills of the clinicians.
Hyperspectral imaging (HSI) has emerged as a promising technique for noninvasive early detection of oral cancer [3]. When tissue is illuminated, light undergoes multiple scattering and absorption, the amount of which depends on the tissue structure and its pigment contents. As biochemical and morphological changes associated with pre-cancer perturb tissue absorption, scattering and fluorescence properties, the spectral fingerprint of the light emitted from the tissue is likely to change, thus enabling hyperspectral imaging to probe pre-cancerous changes. In our previous studies, we were able to distinguish cancer from healthy tissue in animal models using advanced image classification methods [4–9], which are indirect ways to link physiological parameters to disease states. While spectral unmixing can directly link the chromphore concentrations to cancerous states by decomposing the spectrum of each pixel into its constituent spectrum and corresponding abundances.
By capturing optical information at a large area of tissue across a wide range of narrow wavebands of light, hyperspectral imaging extends the capacities of spectroscopy and conventional color imaging. Quantitative analysis of the spectral information at each image point allows hyperspectral imaging to evaluate the spatial distribution of chromophores in tissue for diagnostic purposes. For example, hyperspectral imaging has been used to image blood perfusion in tissue [10] and to create maps of hemoglobin saturation in blood vessels [11]. Non-negative matrix factorization (NMF) is a blind source separation (BSS) algorithm that has been recently applied for spectral unmixing in medical hyperspectral imaging to estimate skin concentrations of hemoglobin and melanin [12] and to recover macular pigment spectra of retina [13]. The spatial distribution of hemoglobin concentration and oxygen saturation can be used to analyze the angiogenesis and hypoxic states of tissues, both of which are important hallmarks of carcinogenesis [14].
In this paper, we propose to apply non-negative matrix factorization for spectral unmixing of hyperspectral dataset and the quantification of the main chromophores in tissue. We present experimental results on simulation images, blood vessel phantoms, and tumor vascularity visualization.
2. MATERIALS AND METHODS
2.1 Instrumentation
A CRI Maestro in-vivo imaging system was used to acquire hyperspectral images. This is a wavelength-scanning system consisting of a Xenon light source, a solid-state liquid crystal filter and a 16-bit high-resolution charge-coupled device (CCD). Details about this system has been described in previous papers [5, 6]. This system is capable of obtaining reflectance images over the range of 450 nm – 950 nm with various wavelength intervals, including 2 nm, 5 nm, 10 nm, etc.
2.2 Pre-processing
The purpose of pre-processing is to remove the spectral nonuniformity of the illumination device and the influence of the dark current. The white reference cube Iwhite(x, y, λi) was acquired by placing a standard white reference board in the field of view, with white excitation source, interior IR source. The dark reference cube Idark(x, y, λi) was captured by keeping the camera shutter closed. Hyperspectral raw dataset I(x, y, λi) was converted into the so-called apparent absorption A(x, y, λi) by the following equation:
| (1) |
2.3 Spectral unmixing
The absorbance spectrum A(x, y, λi) depends on the absorbing components in the tissue. According to the modified Beer-Lambert law, the absorbance can be estimated with the following equation [11] [15]:
| (2) |
where C (x, y) is a molar concentration [mol/L] at the coordinate (x, y), and ε(λ) is a spectral molar extinction coefficient [cm−1/(mol/L)]. “oxy” and “deoxy” refer to oxyhemoglobin (HbO2) and deoxyhemoglobin (Hb), which are the primary chromophores responsible for absorption of visible light. The mean-free path L [cm] is the average distance traveled by a photon within the tissue before it is diffusely reflected due to multiple scattering within the tissue. The term G accounts for the light scattering effect. The spectral molar extinction coefficients εoxy(λi) and εoxy(λi) can be found from [16]. The mean free path L was unknown, so the products Coxy(x, y) L and Cdeoxy(x, y) L were denoted by unitless effective concentrations aoxy and adeoxy, respectively. Oxygenation saturation (SO2) can be computed by the following equation:
| (5) |
Based on this fundamental linear model, we apply NMF in order to retrieve the unknown parameters aoxy, adeoxy and G at each location (x, y). The main goal of NMF is to approximate the matrix A by the product of two matrices W and H, enforcing the constraint that all matrices are non-negative [17]:
| (3) |
Where An×m (n is the total number of pixels and m is the total number of wavelength bands in the hyperspectral images) is the absorbance data, each column in the matrix Wn×k is the estimated non-negative spatial abundance at each pixel of the region of interest (ROI), and each row of Wk×m is the constituent positive spectral component. The positivity constraints on the spectra component and spatial abundance images are consistent with physical reality, which allows a physically meaningful interpretation of the spatio-spectral hyperspectral dataset.
NMF finds W and H by minimizing the difference between A and WH [17]:
| (4) |
The most popular approach to solve equation (4) is the multiplicative updated algorithm [18], which lacks convergence results. The multiplicative update starts from non-negative initial conditions for W and H, and follows iteration of update rules to find an approximate factorization A ≈ WH by converging to a local maximum of the objective function. In this study, we applied the projected gradients method proposed by Lin [17] to solve the optimization problem in equation (4). This method has shown strong optimization properties and faster convergence than the multiplicative update method [17].
In the following section, we only used a two chromophore (HbO2 and Hb) absorption model to estimate the absorbance and to validate the use of NMF for unmixing hyperspectral dataset. The initial inputs are the molar extinction coefficients of HbO2 and Hb [16], and they are allowed to vary during the update of the NMF algorithm to achieve the best fit and the most realistic spectra. This method can be applied to extract other physiological parameters as well.
3. RESULTS AND DISCUSSION
3.1 Validation of Parameter Extraction with Synthetic Data
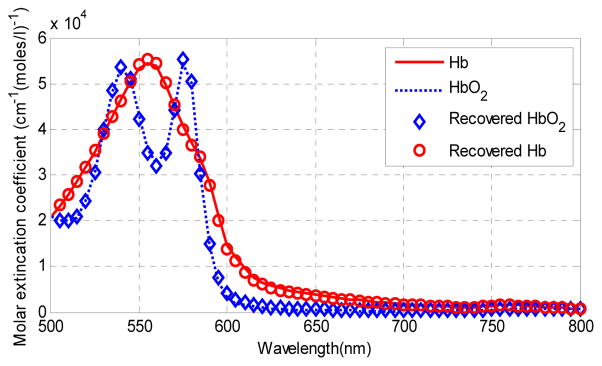
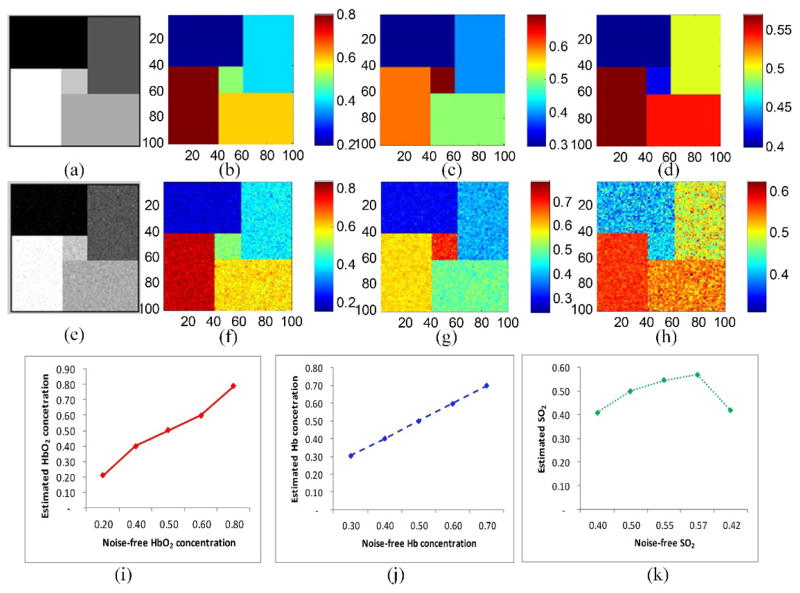
The ability of NMF to recover correct parameter values from the image spectra was tested on computer-generated data. The input data was in the form of 100×100×61 parametric cube formed of five regions of different combinations of oxyhemoglobin and deoxyhemoglobin concentrations. The data cube was contaminated with Gaussian noise to match the mean SNR of the real image data of 20 dB. Figure 1 shows the input spectral components (the extinction coefficients of oxy- and deoxy-hemoglobin) and the recovered spectral components. The recovered spectra was accurate in spite of noise. Figure 2 shows the unmixing results for the simulated data. The difference between the gold standard parameters and the model-based estimation is small.
Fig. 1.
Input spectra components and recovered spectral components.
Fig. 2.
Parameter recovery results and the comparison of noise-free input data and the recovered data using NMF. (a) the 20th spectral image of the input data cube. (e) the noise-contaminated spectral image corresponding to the 20th spectral image. (b), (c), and (d) are the input HbO2 and Hb concentration maps, and the oxygen saturation maps, respectively. (f), (g), and (h) are the corresponding concentration maps recovered from the noisy input data. (i), and (j) compare the noise-free input parameters (x-axis) and the recovered parameters (y-axis) for the five regions in the simulated images. The mean value with standard deviations of HbO2 and Hb concentrations and SO2 are shown in (i) (j) and (k), respectively, where the standard deviations are quite small and not obvious in the figures.
3.2 Blood Vessel Phantom
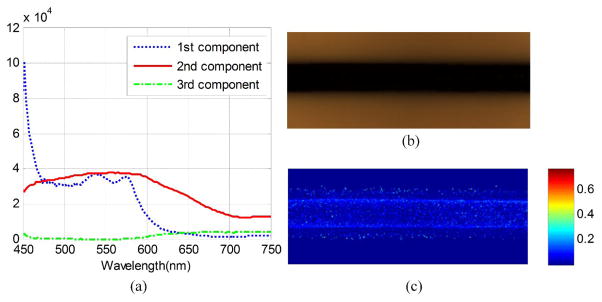
To further validate the algorithm, we created a blood vessel phantom consisted of a glass capillary tube, 10% Intralipid (Sigma-Aldrich) and horse blood (Innovative Research Inc.) inside a container. The glass capillary tube with an inside diameter of 1.15 mm is used to mimic the blood vessels and the intralipid strongly scattered incident light to simulate the living tissue around blood vessel [19]. Deoxyhemoglobin solutions were created by adding to every 5 mg of Sodium Dithionite per 1 ml of blood to achieve a sample with oxygen saturation of 0% [11]. As shown in Figure 3 (a), the first spectral component by the dotted line has the characteristic peaks of oxygenated hemoglobin, and the second spectral component by the solid line has a similar peak as deoxygenated hemoglobin. (b) and (c) shows the RGB composite image of blood phantom and the distribution of oxygen saturation in this phantom. The decomposition result is consistent with the oxygen saturation of 0%.
Fig. 3.
Blood oxygen saturation map calculated by NMF from phantom data set. (a) the decomposed pure spectrum. (b) the RGB composite image of the blood phantom. (c) the decomposed blood oxygen saturation map.
3.3 Tumor Vascularity Visualization
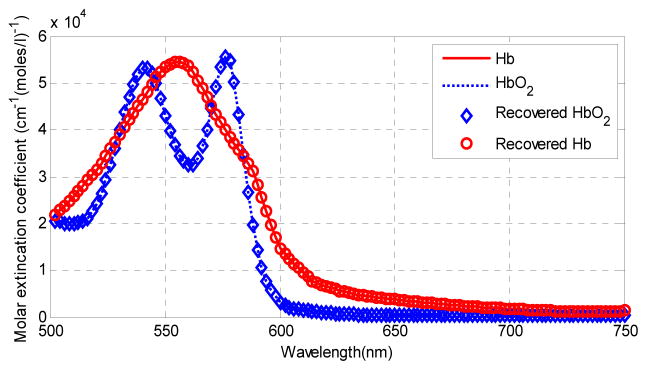
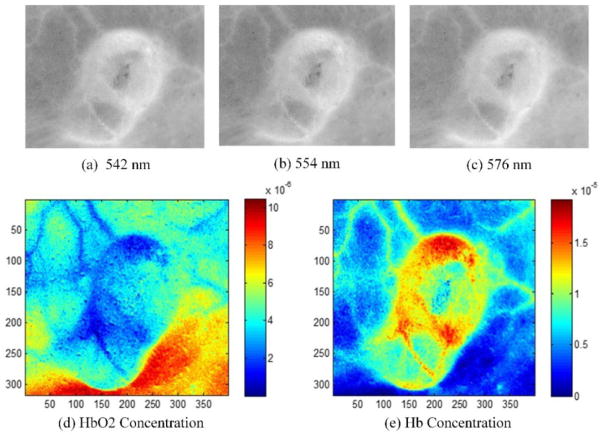
We applied the NMF method to in vivo tumor hyperspectral images in order to extract the HbO2 and Hb concentration as well as the oxygen saturation maps. The hyperspectral images were acquired from a tumor-bearing mouse with head and neck cancer. Figure 4 shows the absorption extinction coefficient of HbO2 and Hb, and the estimated their extinction coefficients. Figure 5 shows the absorbance images at the wavelength 542 nm, 554 nm and 576 nm. The absorption peaks of HbO2 are at the wavelength 542 nm and 576 nm, and the absorption peak of Hb is at 554 nm. Figure 5 also shows the recovered HbO2 and Hb concentration maps, which well match the absorbance images at absorption peaks. The blood vessel regions could be clearly visualized on the concentration maps. The HbO2 concentration map shows higher concentration in the lower right shaded region. This may be due to the intensity variation caused by tumor curvature. In addition, the oxy- and deoxygenated hemoglobin spectra in the in vivo environment of mice tumors may not be exactly the same as the spectra of purified hemoglobin of human in vitro. In the future study, we plan to measure the pure spectra from mouse blood with HSI first and then use these for computing the hemoglobin concentration and oxygen saturation.
Fig. 4.
Recovered spectral components from in vivo tumor images.
Fig. 5.
In vivo imaging experimental results of the unmixing method. Images (a), (b) and (c) are the absorbance images at the wavelength 542, 554 and 576 nm. Images (d) and (e) are the recovered HbO2 and Hb concentration map and oxygen saturation map of hyperspectral tumor images.
4. CONCLUSIONS
In this paper, we presented a spectral unmxing framework for hyperspectral images. Non-negative matrix factorization is used to decompose the hyperspectral dataset into chromphore concentration maps. The method was validated with simulated hyperspectral images and in vivo tumor hyperspectral images. The decomposed HbO2 and Hb concentration and oxygen saturation maps may provide useful information for potential use in early detection of oral cancer.
Acknowledgments
This research is supported in part by NIH grants R21CA176684, R01CA156775 and P50CA128301, Georgia Cancer Coalition Distinguished Clinicians and Scientists Award, and the Center for Systems Imaging (CSI) of Emory University School of Medicine.
References
- 1.Messadi DV. Diagnostic aids for detection of oral precancerous conditions. Int J Oral Sci. 2013;5(2):59–65. doi: 10.1038/ijos.2013.24. [DOI] [PMC free article] [PubMed] [Google Scholar]
- 2.Lingen MW, Kalmar JR, Karrison T, et al. Critical evaluation of diagnostic aids for the detection of oral cancer. Oral Oncol. 2008;44(1):10–22. doi: 10.1016/j.oraloncology.2007.06.011. [DOI] [PMC free article] [PubMed] [Google Scholar]
- 3.Lu G, Fei B. Medical hyperspectral imaging: a review. J Biomed Opt. 2014;19(1):10901. doi: 10.1117/1.JBO.19.1.010901. [DOI] [PMC free article] [PubMed] [Google Scholar]
- 4.Lu G, Halig L, Wang D, et al. Spectral-spatial classification for noninvasive cancer detection using hyperspectral imaging. J Biomed Opt. 2014;19(10):106004. doi: 10.1117/1.JBO.19.10.106004. [DOI] [PMC free article] [PubMed] [Google Scholar]
- 5.Lu G, Halig L, Wang D, et al. Spectral-Spatial Classification Using Tensor Modeling for Cancer Detection with Hyperspectral Imaging. Proc SPIE. 2014;9034:903413. doi: 10.1117/12.2043796. [DOI] [PMC free article] [PubMed] [Google Scholar]
- 6.Lu G, Halig L, Wang D, et al. Hyperspectral Imaging for Cancer Surgical Margin Delineation: Registration of Hyperspectral and Histological Images. Proc SPIE. 2014;9036:90360s. doi: 10.1117/12.2043805. [DOI] [PMC free article] [PubMed] [Google Scholar]
- 7.Pike R, Patton SK, Lu G, et al. A Minimum Spanning Forest Based Hyperspectral Image Classification Method for Cancerous Tissue Detection. Proc SPIE. 2014;9034:90341w. doi: 10.1117/12.2043848. [DOI] [PMC free article] [PubMed] [Google Scholar]
- 8.Akbari H, Halig LV, Schuster DM, et al. Hyperspectral imaging and quantitative analysis for prostate cancer detection. J Biomed Opt. 2012;17(7):076005. doi: 10.1117/1.JBO.17.7.076005. [DOI] [PMC free article] [PubMed] [Google Scholar]
- 9.Akbari H, Halig LV, Zhang H, et al. Detection of Cancer Metastasis Using a Novel Macroscopic Hyperspectral Method. Proc SPIE. 2012;8317:831711. doi: 10.1117/12.912026. [DOI] [PMC free article] [PubMed] [Google Scholar]
- 10.Chin MS, Freniere BB, Lo YC, et al. Hyperspectral imaging for early detection of oxygenation and perfusion changes in irradiated skin. J Biomed Opt. 2012;17(2):026010. doi: 10.1117/1.JBO.17.2.026010. [DOI] [PubMed] [Google Scholar]
- 11.Sorg BS, Moeller BJ, Donovan O, et al. Hyperspectral imaging of hemoglobin saturation in tumor microvasculature and tumor hypoxia development. J Biomed Opt. 2005;10(4):44004. doi: 10.1117/1.2003369. [DOI] [PubMed] [Google Scholar]
- 12.Galeano J, Jolivot R, Marzani F, et al. Unmixing of human skin optical reflectance maps by Non-negative Matrix Factorization algorithm. Biomedical Signal Processing and Control. 2013;8(2):169–175. [Google Scholar]
- 13.Fawzi AA, Lee N, Acton JH, et al. Recovery of macular pigment spectrum in vivo using hyperspectral image analysis. Journal of Biomedical Optics. 2011;16(10):106008–9. doi: 10.1117/1.3640813. [DOI] [PMC free article] [PubMed] [Google Scholar]
- 14.Hanahan D, Weinberg RA. Hallmarks of cancer: the next generation. Cell. 2011;144(5):646–74. doi: 10.1016/j.cell.2011.02.013. [DOI] [PubMed] [Google Scholar]
- 15.Nouvong A, Hoogwerf B, Mohler E, et al. Evaluation of diabetic foot ulcer healing with hyperspectral imaging of oxyhemoglobin and deoxyhemoglobin. Diabetes Care. 2009;32(11):2056–61. doi: 10.2337/dc08-2246. [DOI] [PMC free article] [PubMed] [Google Scholar]
- 16.Prahl S. Tabulated Molar Extinction Coefficient for Hemoglobin in Water. 2014 http://omlc.ogi.edu/spectra/hemoglobin/summary.html.
- 17.Lin CJ. Projected gradient methods for nonnegative matrix factorization. Neural computation. 2007;19(10):2756–2779. doi: 10.1162/neco.2007.19.10.2756. [DOI] [PubMed] [Google Scholar]
- 18.Lee DD, Seung HS. Learning the parts of objects by non-negative matrix factorization. Nature. 1999;401(6755):788–91. doi: 10.1038/44565. [DOI] [PubMed] [Google Scholar]
- 19.Kaneko K, Yamaguchi H, Saito T, et al. Hypoxia Imaging Endoscopy Equipped with Laser Light Source from Preclinical Live Animal Study to First-In-Human Subject Research. PLoS ONE. 2014;9(6):e99055. doi: 10.1371/journal.pone.0099055. [DOI] [PMC free article] [PubMed] [Google Scholar]


