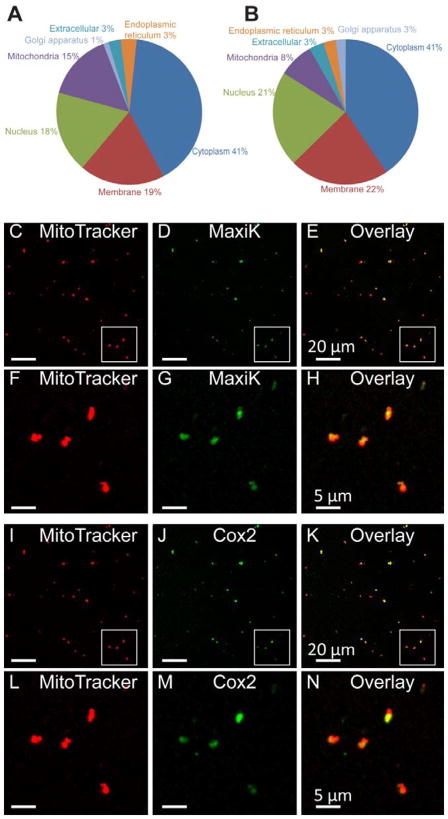
Figure 2. Mass spectrometry analysis of brain MaxiK channel sub-proteome.
A. Pie chart showing distribution of MaxiK channel interactome in experiments using IgG as controls. B. Pie chart summarizing the distribution of MaxiK channel interactome using Kcnma1−/− as controls. MaxiK channel interactome pointed to proteins localized to mitochondria as MaxiK interactors. C–H. On probing with anti-MaxiK antibodies, MaxiK channel was found to be present in MitoTracker loaded brain mitochondria. I–N. As control, the same preparation of mitochondria loaded with MitoTracker was also probed with anti-cytochrome c oxidase IV subunit II (Cox 2) antibodies. Cox2 also localizes to the mitochondria (n= 3 independent experiments).

