

Abstract
Mutant Kras and chronic pancreatitis are the most common pathologic events involved in human pancreatic cancer. It has been demonstrated that c-Raf is responsible for transmitting signals from mutant Ras to its downstream signals including MEK-ERK and for initiating carcinogenesis. The soluble epoxide hydrolase (sEH), a pro-inflammatory enzyme, generally inactivates anti-inflammatory and anti-pain epoxyeicosatrienoic acids (EETs). Herein, we have synthesized a novel compound of trans-4-{4-[3-(4-chloro-3-trifluoromethyl-phenyl)-ureido]-cyclohexyloxy}-pyridine-2-carboxylic acid methylamide (t-CUPM) via modifying the central phenyl ring of sorafenib and confirmed its dual inhibition of sEH and c-Raf by recombinant kinase activity assay. Pharmacokinetic analysis revealed that oral dosing of t-CUPM resulted in the higher blood levels than that of sorafenib throughout the complete time course (48 h). The effect of t-CUPM on the inhibition of mutant KrasG12D–initiated murine pancreatic cancer cell growth was determined using the mouse pancreatic carcinoma cell model obtained from LSL-KrasG12D/Pdx1-Cre mice and showed that t-CUPM significantly inhibited this murine pancreatic carcinoma cell growth both in vitro and in mice in vivo. Inhibition of mutant Kras-transmitted phosphorylations of cRAF/MEK/ERK was demonstrated in these pancreatic cancer cells using Western blot assay and immunohistochemical approach. Modulation of oxylipin profile, particularly increased EETs/DHET ratio by sEH inhibition, was observed in mice treated with t-CUPM. These results indicate that t-CUPM is a highly potential agent to treat pancreatic cancer via simultaneously targeting c-Raf and sEH.
Keywords: Pancreatic carcinoma, c-Raf, Soluble epoxide hydrolase, growth inhibition
1. Introduction
Over one-third of human tumors carry an activated mutant Ras oncogene, including human pancreatic carcinomas in which more than 90% have the Kras gene mutation [1, 2]. However, efforts to directly inhibit Ras posttranslational modifications have thus far been unsuccessful. An alternative approach is the development of inhibitors targeting signaling pathways downstream of RAS, including the mutant Ras-activated Raf-MEK-ERK pathway. b-Raf selective inhibitors block proliferation of b-Raf mutant cells in vitro and in vivo. But, surprisingly they are not only ineffective but also paradoxically cause MEK-ERK activation in Ras mutant cells [3–5]. Further studies indicate that activation of MEK-ERK pathway in the context of mutant Ras requires c-Raf [6]. Using mutant Kras-driven lung tumorigenesis in mice, it has been demonstrated that signaling through c-Raf, MEK and ERK, but not b-Raf, are essential for tumor initiation by mutant Kras, and c-Raf is responsible for transmitting signals from mutant Ras to MEK-ERK [6]. Thus, targeting c-Raf would be crucial for suppressing mutant Kras activated signaling and tumorigenesis.
Chronic pancreatitis is a well-recognized risk factor for pancreatic cancer [7]. In the process of long-standing chronic inflammation, aberrant metabolites of arachidonic acid, particularly cyclooxygenase and lipoxygenase mediated metabolites, play crucial role in promoting carcinogenesis [8]. The third pathway of arachidonic acid metabolism is cytochrome P450-mediated epoxygenated and hydroxynated products. Epoxygenated products such as epoxyeicosatrienoic acids (EETs) inhibit inflammation through decreasing cytokine-induced endothelial cell adhesion molecule (VCAM) and reducing NF-κB and Iκκ kinase activities [9]. The soluble epoxide hydrolase (sEH) catalyzes the conversion of epoxyeicosatrienoic acids (EETs) into the dihydroxyeicosatrienoic acids (DHETs) and inactivates the EETS anti-inflammatory activities [10]. sEH inhibitor results in stabilizing EETs and increasing levels of EET/DHET ratios and have shown a potent anti-inflammatory activity in various rodent inflammatory disease models, mainly via reducing the production of nitric oxide, pro-inflammatory lipid mediators as well as inflammatory cell infiltration [9, 11, 12].
Sorafenib is a multiple kinase inhibitor, especially for pan-Raf and vascular endothelial growth factor (VEGF) receptor kinase inhibitor, and has a dramatic effect in treating highly angiogenic malignancies [13]. Recently we have found that sorafenib possesses sEH inhibitory activity, which is due to structural similarity with sEH inhibitor trans/-4-[4-(3-adamantan-1-yl-ureido)-cyclohexyloxy]-benzoic acid (t-AUCB) [13]. To improve the inhibitory activity against sEH and c-Raf, we have modified the central phenyl ring of sorafenib based on: first, replacement of a phenyl ring with a cyclohexyl ring in t-AUCB increases sEH inhibitory activity [14], and second, the structure-activity relationship (SAR) study of sorafenib focus on similar planar heterocyclic ring [15]. Such structural modification led us to first synthesize cyclohexyl derivatives (trans- and cis-) replacing sorafenib, and expect these compound/s having the high potent activities against c-Raf and sEH.
In the present study, we have first synthesize a novel trans-cyclohexyl derivative, called trans- trans-5-{4-[3-(4-chloro-3-trifluoromethyl-phenyl)-ureido]-cyclohexyloxy}-pyridine-2 carboxylic acid methylamide (t-CUPM). t-CUPM contains the relatively flexible cyclohexyl ring present in t-AUCB and has the left side of the molecule of a 4-chloro-3-(trifluoromethyl) phenyl ring and right side of pyridine-2-carboxylic acid methyl amide of sorafenib. The effect of t-CUPM against b-Raf, c-Raf and sEH and on inhibiting mutant Kras activated Raf-MEK-ERK pathway was examined using sEH enzyme assay, recombinant kinase activity assay, and in vitro and in vivo mouse pancreatic ductal carcinoma cell model derived from LSL-KrasG12D/Pdx1-Cre mice. Pharmacokinetic (PK) profiles of t-CUPM and its comparison with sorafenib and t-AUCB were analyzed in mice. Using a unique mutant Kras–driven murine pancreatic carcinoma cells, the effects of t-CUPM on inhibiting pancreatic carcinoma cell growth and mutant Kras–activated signals and on modulation of oxylipin metabolic profile using LC-MS/MS approach were further analyzed in vivo in mice.
2. Materials and methods
2.1. t-CUPM Synthesis and Recombinant Kinase Activity Assay
The detailed synthetic procedures and methods of t-CUPM were described in the supplementary data. t-AUCB was also synthesized with our previously published method [14]. Sorafenib (free base) was purchased from LC Laboratories (Worburn, MA).
sEH enzyme assay followed our previous published method[14]. Recombinant kinase activity assay of b-Raf and c-Raf was performed using the ADP-Glo™ Kinase Assay (Promega, Madison, WI) as described by the manufacturer. IC50 values were calculated by quantifying the end-point ADP production from each kinase reaction. Individual data sets were performed in duplicate and each IC50 was determined by three separate experiments. The data were fit to a saturation curve using KaleidaGraph graphing program (Synergy Software) to determine the inhibition at 50% activity (IC50).
2.2. Analysis of Effect of t-CUPM, Sorafenib, and t-AUCB on Mouse Pancreatic Carcinoma Cell Growth in vitro and in vivo
The mouse pancreatic ductal carcinoma cell line (PK03) was established from our lab that derived from the LSL-KrasG12D/Pdx1-Cre mice [16]. Pdx1-Cre recombined or activated mutant KrasG12D gene was confirmed with PCR assay using genomic DNA extracted from the cell line. The expression of cytokeratin-19, amylase, and E-cadherin was determined immunocytochemically.
The colony formation assay was performed to determine effect of t-CUPM on inhibiting PK03 cell growth in dose dependent manner. Giemsa staining was used to highlight the colony, the cell cluster for more than 50 cells was considered as a colony. PK03 cells were further treated with t-CUPM, sorafenib or t-AUCB at a final concentration of 3, 10 or 30μM for 24 hours. The cells were harvested and cell lysate was used for extracting protein and western blot assay.
For in vivo PK03 cell growth in C57 B6/J mice, PK03 cells (3×10⁶ cells per 100ul per mouse) were injected subcutaneously to two hind legs of 8- to 10-week-old mice. t-CUPM, sorafenib or t-AUCB was administered to mice in the drinking water in the dose of 10mg/kg body weight (n=5 mice/group). Animals were fed with AIN93M diet until the end of experiment. Food and water consumption, and body weight were monitored weekly. Mice were housed under pathogen-free conditions in the facilities of Laboratory Animal Services, Northwestern University. All studies were conducted in compliance with the Northwestern University IACUC guidelines. Tumor development was monitored daily. Mice were sacrificed at the end of 35 days when tumor size reached to 1 cm in diameter. Blood and plasma were collected via heart acupuncture after euthanized by CO2 and stored in a −80°C freezer until analysis. Tumors were dissected and measured for size (length and width) and weight. Tumor volume was determined using the equation V (mm3) = L*W2/2, Tumors were then fixed in 10% buffered formalin and processed for paraffin sections for histopathological and immunohistochemical analyses.
Immunohistochemical staining was performed according to our routine protocol using an avidin-biotin-peroxidase method [16]. The primary antibodies include rabbit polyclonal anti-myeloperoxidase (MPO) (Abcam, Cambridge, MA, USA.), mouse monoclonal anti-Ki-67 antibody (Calbiochem, Gibbstown, New Jersey, USA), and rabbit monoclonal anti-phospho-ERK1/2 (Cell Signaling Technology, Boston, MA, USA) antibody. The appropriate biotinylated secondary antibody and avidin-biotin-peroxidase complex (Vector Lab, Burlingame, CA, USA) were used for detecting antigen–primary antibody complex. A characteristic brown color was developed by incubation with 3,3-diaminobenzidine substrate chromogen system (Sigma-Aldrich, St. Louis, MO, USA). The negative control was established by replacement of primary antibody with normal serum, and an appropriate positive control was used for each primary antibody. Positive cells and staining intensity were quantified for all antibodies using a Olympus BX45 microscope and DP70 digital Camera. The full image of each pancreas was snapped under X2.5 and X20 objective lens and saved with >2560 resolution image. Using ‘histogram analysis’ in the Photoshop program, specific staining intensity and percentage of positive staining cell number in total cells counted were be measured for at least 10 defined area/image in each tumor and automatically expressed as mean value ± SD.
2.3. Protein Extraction and Western Blot Assay
Freshly harvested pancreases or cultured cell pellets were homogenized and lysed in ice-cold RIPA lysis buffer (Santa Cruz). The lysates were separated by centrifugation at 12,000 × g for 5 minutes at 4°C; the supernatants were collected and aliquot. All protein concentrations were determined using the Bradford reagent (Thermo Scientific, IL, USA). An aliquot (30μg protein/lane) of the tissue lysate was separated by 10% SDS-PAGE gel, and then the proteins were transferred onto a polyvinylidene fluoride (PVDF) membrane. The primary antibodies included antibodies against c-Raf, MEK, ERK and their phosphorylated form protein, and all of these antibodies were from Cell Signaling Technology (Boston, MA, USA). The membranes were further incubated with HRP-linked anti-rabbit IgG and HRP-linked anti-biotin antibodies (Cell Signaling Technology). The protein-antibody complexes were detected by using the chemiluminescent substrate according to the manufacturer’s instructions and the emitted light captured on X-ray film. The intensity of each band was analyzed using ‘histogram analysis’ in the Photoshopprogram.
2.4. Pharmacokinetic (PK) Study of t-CUPM, Sorafenib, and t-AUCB in Mice
Male Swiss Webster mice (10-week-old, 30–35 g) were used for PK studies. Equal amount of sorafenib, t-AUCB and t-CUPM was dissolved in oleic acid-rich triglyceride containing 10% PEG400 (v/v) to give a clear solution for cassette oral administration at a dose of 1 mg/kg body weight (N=3). Blood (10 μL) was collected from the tail vein using a pipette tip rinsed with 7.5% EDTA(K3) at 0, 0.5, 1, 1.5, 2, 4, 6, 8, 24 and 48 h after administration of the inhibitors. Each blood sample was immediately transferred to a tube containing 50 μL of water containing 0.1% EDTA. After being mixed strongly on a Vortex for 1 min, all samples were stored at −80 °C until analysis.
The extraction of these inhibitors from blood was performed by a slight modification of a previous method [17]. The blood concentrations of compounds were determined using a HPLC-MS/MS method which was validated to assure acceptable accuracy and precision (accuracy more than 95% with RSD less than 10%). Analytes were detected by negative mode electrospray ionizations tandem quadrupole trap mass spectrometry in multiple reaction-monitoring mode (MRM) on a Trap 4000 Mass Spectrometer (ABI, Milford, MA). The parameters of MS condition were the same as presented previously [17]. The precursor and dominant product ions used to set up the transition monitored in the MRM mode were 463.1 and 194 for sorafenib, and 469.1 and 194 for t-CUPM, respectively.
2.5. Analysis of Oxylipin Metabolic Profile Using a Liquid Chromatography/Tandem Mass Spectrometry (LC-MS/MS) Method
Plasma specimens were spiked with 10 μL of 50 nM internal standard (d11-14, 15-DHET, d11-11(12)-EET, d4-PGE2, d4-LTB4, and d8-5-HETE) and were extracted by solid phase extraction using Oasis HLB cartridges (3cc 60mg, Waters, Milford, MA). LC-MS/MS analysis of oxylipins was performed using a modified method based on the previous publication [18]. An Agilent 1200 SL liquid chromatography series (Agilent Corporation, Palo Alto, CA) with an Agilent Eclipse Plus C18 2.1 × 150 mm, 1.8 μm column were used for the separation of the oxylipins. The detailed procedures were described in the supplemented data.
2.6. Statistical Analysis
Each analyzed parameter was expressed as Mean ± SD, unless otherwise stated. Continuous variables were compared with the Student’s t-test, whereas categorical variables were compared with Chi-square test. All statistical tests were two-sided, statistical significance was taken as p<0.05.
3. Results
3.1. Inhibitory activity of t-CUPM, c-CUPM, Sorafenib and t-AUCB on sEH, c-Raf and b-RafV600E
Chemical synthesis of cyclohexyl derivatives (trans- and cis-) replacing sorafenib including t-CUPM and c-CUPM was described in our supplementary data; and the chemical structures and similarity of t-CUPM, sorafenib, and t-AUCB were shown in Fig. 1A. Inhibitory effect on sEH, c-Raf and b-RafV600E were determined using the enzyme and kinase activity assays and summarized in Table 1. t-CUPM exhibited the most potent effect on inhibiting the sEH activity with IC50 of 0.5 ± 0.2 nM, and the similar inhibitory effect as sorafenib on c-Raf with IC50 of 75 ± 5 nM, but much less effect on b-Raf inhibition with IC50 of 1 ± 0.1 μM. t-AUCB and c-CUPM only displayed the activity against sEH, but no effect on c-Raf and b-Raf.
Fig. 1.

A. Chemical structures of t-CUPM, sorafenib, and t-AUCB. B. Superposition of the compounds sorafenib (blue), t-CUPM (yellow), and c-CUPM (red) docked in the active site of b-Raf V600E (cyan) and comparison with c-Raf (green).
Table 1.
Inhibition of sEH, c-Raf, and B-raf V600E (IC50 values)
| sEH (nM) | C-raf (nM) | B-raf V600E (nM) | |
|---|---|---|---|
| Sorafenib | 17 ± 4 | 45 ± 5 | 12.7 ± 1.5 |
| t-AUCB | 1.5 ± 0.2 | >5000 | ND |
| t-CUPM | 0.5 ± 0.2 | 75 ± 5 | 1000 ± 100 |
| c-CUPM | 0.5 | >5000 | >5000 |
Because c-Raf X-ray crystal structure complexed with sorafenib is not available, we manually docked t-CUPM and c-CUPM of b-Raf X-ray crystal structure complexed with sorafenib (PBD number: 1UWJ) and further overlapping with c-Raf [3], as shown in Fig. 1B. While trans-isomer (t-CUPM) matched well with sorafenib, cis-isomer (c-CUPM) showed dramatic changes at the active site due to non-planner cyclohexyl group at the center. As expected, c-CUPM totally lost inhibitory activities against both Raf enzymes (IC50 > 5 μM). It has been found that numerous interactions are formed between the b-Raf and sorafenib, and residues that contact sorafenib are conserved in c-Raf [19]. While t-CUPM keep c-Raf inhibitory activity [75 nM vs. 45 nM], surprisingly its b-Raf inhibitory activity decreased dramatically (1 μM vs. 13 nM) as compared to sorafenib. While two enzymes are extremely well-conserved, the DFG motif [DFG (asp-phe-gly) motif which is conserved among most of proteins belonging to the kinase protein family and located in the activation loop] in both b-Raf and c-Raf were shifted, which might contribute to dramatic decrease on b-Raf inhibition by t-CUPM via constricting its active site compare to c-Raf.
3.2. Pharmacokinetic (PK) profiles of t-CUPM, t-AUCB and Sorafenib in Mice
The blood levels of t-CUPM, t-AUCB and sorafenib were analyzed following cassette oral administration to mice at a dose of 1 mg/kg body weight of each compound using a HPLC-MS/MS. Oral dosing of t-CUPM resulted in the higher blood levels than that of t-AUCB and sorafenib throughout the complete time course (48 h), as seen in the Fig. 2. The major PK parameters based on a non-compartmental analysis were summarized in Table 2, and revealed that t-CUPM had significantly higher Cmax and AUCt than Sorafenib and t-AUCB, but similar Tmax and t1/2 to that of sorafenib.
Fig. 2.
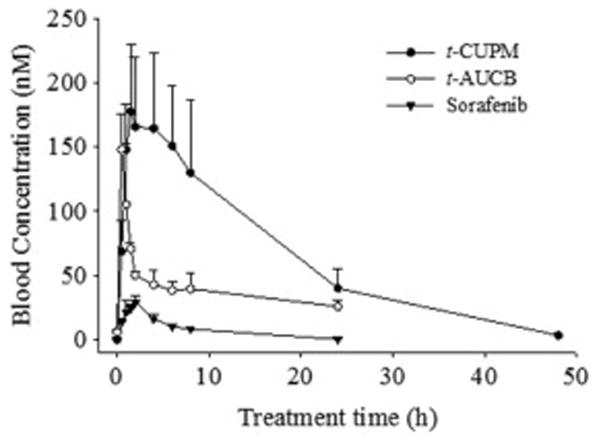
Blood concentration - time courses of t-CUPM, t-AUCB and sorafenib after cassette oral administration to mice at the dose of 1 mg/kg body weight. Each point represents the mean ± s.d. of three mice.
Table 2.
Pharmacokinetic parameters of t-CUPM and sorafenib after cassette oral dosing with a non-compartmental analysis
| Inhibitors | R2 | Cmax (nM) | Tmax (h) | t 1/2 | AUCt (nM*h) |
|---|---|---|---|---|---|
| t-CUPM | 0.97 ± 0.04 | 190 ± 50 | 1.7 ± 0.8 | 2.2 ± 1.6 | 3000 ± 550 |
| sorafenib | 0.98 ± 0.01 | 30 ± 5 | 2 ± 0 | 1.5 ± 0.5 | 200 ± 12 |
| t-AUCB | 0.98 ± 0.05 | 150 ± 23 | 0.5 ± 0 | 13.5 ± 3 | 1380 ± 300 |
R2 is the square of the correlation coefficient between predict and observed value; Tmax, the time of maximum concentration; Cmax, the maximum blood concentration; t1/2, half-life; AUCt, area under the concentration–time curve to terminal time.
3.3. Inhibition of murine pancreatic carcinoma growth in vitro and in vivo by t-CUPM, sorafenib and t-AUCB
Mouse pancreatic ductal carcinoma cell line (called PK03) was derived from the pancreas of 6 month-old LSL-KrasG12D/Pdx1-Cre mice, and has been cultured in vitro for more than two years and with more than 50 passages [16]. PK03 cells expressed E-cadherin and cytokeratine 19 (CK19) immunocytochemically, but not amylase (Fig. 3A); and western blot assay further demonstrated these biomarker expression in PK03 cells (Fig. 3A bottom photo), indicating pancreatic ductal epithelium origin. PK03 cell line displayed a tumorigenetic feature with tumor formation when it was inoculated subcutaneously into C57BL/6J wild type mice (data not shown). A dose-dependent inhibitory effect on PK03 cell growth by t-CUPM, sorafenib and t-AUCB was observed with IC50 dose of 8.1 μM for t-CUPM, 9.0 μM for sorafenib, and >50 μM for t-AUCB using colony formation assay (Fig. 3B). Western blot assay showed that the phosphorylation of MEK1/2 and ERK1/2 (mutant Kras-activated signals) were significantly inhibited by t-CUPM and sorafenib treatment in a dose-dependent manner, but not by t-AUCB, as shown in Fig. 3C. Further Western blot assay demonstrated that the phosphorylation of c-RAF (mutant Kras-activated signal) was significantly inhibited by t-CUPM treatment in a dose-dependent manner, but not by sorafenib or t-AUCB, as shown in Fig. 3D.
Fig. 3. Inhibition of cell growth and MEK-ERK activation by t-CUPM, sorafenib and t-AUCB in the mutant Kras-transformed mouse pancreatic ductal carcinoma cell line PK03 in vitro.
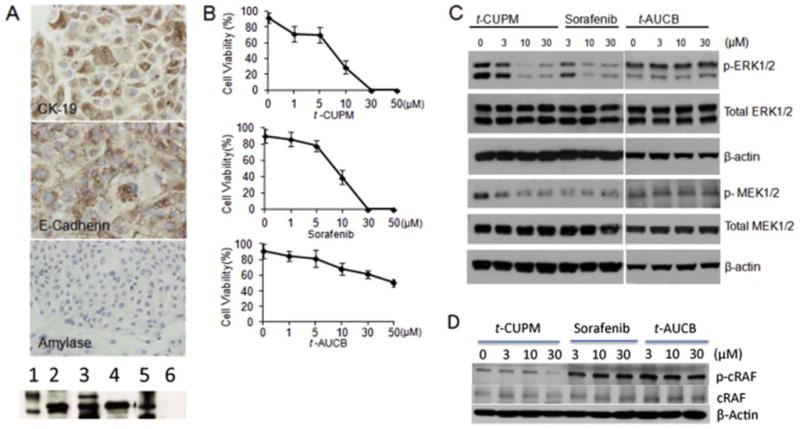
A: PK03 cell lines showing CK19 and E-Cadherin expression with no expression of amylase by immunocytochemistry assay (upper panel) and by Western blot assay {bottom photo, 1. Molecular weight control (Mt), 2. Cytokeratin-19, 3. Mt, 4. E-Cadherin, 5. Mt, 6. Amylase}; B: A dose-dependent inhibitory effect on cell growth by t-CUPM, sorafenib and t-AUCB in PK03 cell line using colony formation assay; and C: A dose-dependent effect on inhibiting phosphorylation of MEK1/2 and ERK1/2 in PK03 cell line treated with t-CUPM, sorafenib and t-AUCB using Western blot approach. D: A dose-dependent effect on inhibiting phosphorylation of c-RAF in PK03 cell line treated with t-CUPM, sorafenib and t-AUCB using Western blot approach.
To determine the effect of t-CUPM, t-AUCB, and sorafenib on tumorigenesis in vivo, we injected 3 × 10⁶ cells of PK03 cells (n = 5/group) into both sides of hind limbs in C57 B6/J mice. 10mg/kg body weight of each compound was administered to mice. Since the test for maximum tolerant dose in mice showed 50 mg/kg did not have any toxicity (data not show) and pharmacokinetic study showed an excellent plasma levels of these three compounds for single oral dose of each compound (1 mg/kg), a dose of 10mg/kg body of each compound was used for this anti-tumorigenesis study. When tumor size reached to 10mm in diameter at the end of 5 weeks, the experiment was terminated. The tumors were removed from the sites, and were measured and weighted. The tumors treated by t-CUPM were significantly smaller in size (275.9 ± 68.9 mm3 vs. 582.7 ± 10.5.6 mm3, p < 0.03), and in weight (0.25 ± 0.06 g vs. 0.52 ± 0.07 g, p < 0.01 by Student t-test) than the PK03 control, but not t-AUCB, and sorafenib treated tumors, as seen in Fig. 4.
Fig. 4. Inhibition of in vivo PK03 pancreatic carcinoma cell growth by t-CUPM in mice.
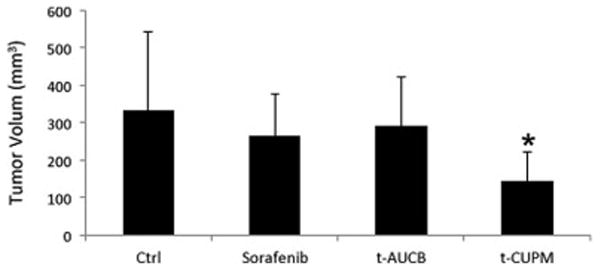
Subcutaneous inoculation of 5×10⁶ PK03 cells into the hints of mice and further treated with or without t-CUPM, t-AUCB or Sorafenib (10mg/kg body weight in drinking fluid) (n=5 mice for each treatment). Histogram of average tumor sizes. Results were reported as mean ± SD. The statistically significant difference was labeled in the figure (p<0.05).
3.4. Inhibition of cell proliferation, inflammation and mutant kras activated phosphorylated ERK signals by t-CUPM, sorafenib and t-AUCB
Histopathologic and immunohistochemical approaches were further used to analyze cell proliferation, inflammation and mutant Kras activated phosphorylated ERK signals in the tumor treated with these compounds. As seen in Fig. 5, compared to PK03 control tumors, tumors treated with t-CUPM, t-AUCB, and sorafenib exhibited more glandular differentiation with lumen formation and less inflammatory cells reaction in the tumor adjacent to the normal tissues (Fig. 5). To further determine the inflammatory cell reaction to the implanted tumor, active inflammatory cells or neutrophils labeled by myeloperoxidase (MPO) immunostaining were analyzed immunohistochemically. MPO-labeled neutrophils/macrophages were frequently observed in the tumor adjacent to normal tissues and rare positive cells were seen within tumor (Fig. 5). The number of MPO-labeled neutrophils/macrophages per high power field (40X objective lens) (at least ten fields each tumor slide) was counted. Compared to PK03 tumors, the significant decreased MPO-labeled neutrophils/macrophages were observed in the tumors treated with t-CUPM, t-AUCB, and sorafenib (average 32 ± 9.9 vs. 12.4 ± 6.1, 14.3 ± 7.2, or 15.1 ± 9.8, P< 0.05 by Student t-test). Numerous Ki-67-labled proliferative cells were identified in the PK03 tumors, and the markedly decreased Ki-67-labeled proliferative cells were observed in the tumors treated with t-CUPM (Fig. 5). The semi-quantitative analysis showed that the proliferation index (percentage of Ki-67-positive cells in the total cells counted) was significantly decreased in the tumors treated with t-CUPM (28 ± 9.2% vs 59 ± 9.7% in the PK03 control tumors, p<0.05 by Student t-test), but not t-AUCB, and sorafenib treated tumors. A decreased positive staining intensity of phosphorylated ERK1/2 was also identified in the tumors treated with t-CUPM and sorafenib compared to PK03 control tumors, but not t-AUCB treated tumors (Fig. 4). Immunohistochemical staining intensity of phosphorylated ERK1/2 were quantitatively analyzed for at least 10 snapped images (under X20 objective lens) of each tumor (n = 3 mice/group) in Photoshop. Compared to PK03 control tumors, the significant differences in staining intensity of phosphorylated ERK1/2 were observed in the tumors treated with t-CUPM or sorafenib (123 ± 17.7 vs. 60 ± 19.2 or 63 ± 21.2, p<0.05 by Student t-test), but not t-AUCB treated tumors.
Fig. 5. Representative photos of morphology and immunohistochemistry of PK03 carcinoma in mice treated with or without t-CUPM, t-AUCB or Sorafenib.

Columns from left to right showed morphology, MPO-labeled neutrophils, Ki-67-labeled cell proliferation, and Phospho-Erk1/2 immunostaining; Rows from up to bottom displayed Control PK03 tumor, and PK03 tumor treated with t-AUCB, Sorafenib or t-CUPM.
Immunohistochemical staining for COX-2 and VEGF was further performed on the tumors tissues. There were no differences in the COX-2 and VEGF immunostaining intensity in the tumor cells observed on t-CUPM, sorafenib and t-AUCB treated tumors tissues compared to non-treated tumor tissues (data not shown).
3.5. Modulation of plasma oxylipin metabolic profile by t-CUPM, sorafenib and t-AUCB in mice implanted with PK03 Pancreatic Cancer Cells
To determine the sEH inhibitory effect by t-CUPM, plasma oxylipin metabolic profile was analyzed using a LC-MS/MS approach. The metabolic profile of both omega-6 and omega-3 fatty acids particularly focused on epoxide metabolites for EETs/DHETs and EpoME/DiHom ratio as biomarkers of sEH inhibition. As seen in Fig. 6, the most significant effects on enhancing epoxide metabolites (the ratios of EETs/DHETs and EpoME/DiHom) derived from both omega-6 fatty acids including linoleic acid (LA) and arachidonic acid (AA) and omega-3 fatty acids including alpha-linolenic acid (ALA), eicosapentaenoic acid (EPA) and docosahexaenoic acid (DHA) were observed in t-CUPM treated mice, compared to the control mice and the mice treated with t-AUCB and Sorafenib. The detailed serum levels of free oxylipins in mice implanted PK03 pancreatic carcinoma treated with or without t-CUPM, t-AUCB and Sorafenib were summarized in a Table in the supplementary data. In addition, the effect on cyclooxygenase and lipoxygenase mediated metabolites were analyzed including prostaglandins, thromboxane, leukotrienes, and hydroxyicosatetraenoic acid (HETE). There was no significant difference observed in the mice treated either t-CUPM, t-AUCB or Sorafenib.
Fig. 6. Oxylipin metabolic profile analysis using a LC-MS/MS approach.

The ratios of plasma EETs to DHETs of omega-6 fatty acids including linoleic acid (LA) and arachidonic acid (AA) and omega-3 fatty acids including alpha-linolenic acid (ALA), eicosapentaenoic acid (EPA) and docosahexaenoic acid (DHA). Results were reported as mean ± SD for 5 mice each group. The statistically significant difference by Student t-test was labeled in the figure (p<0.05).
4. Discussion
Inhibition of mutant Kras-activated signaling pathway/s and crucial inflammatory event/s is considered the most promising approach for cancer chemoprevention, particularly for pancreatic cancer [1, 20]. In the present study, we have reported a newly synthesized and novel compound of t-CUPM and demonstrated its dual inhibitory activity against c-Raf and proinflammatory enzyme sEH, and significant inhibition of mutant KrasG12D-driven murine pancreatic carcinoma growth both in vitro and in vivo. At a clinically achievable plasma concentration of 10 μM for sorafenib [21], both t-CUPM and sorafenib showed comparable IC50 dose (8.1 μM and 9.0 μM, respectively) for inhibiting growth of mutant KrasG12D-transformed mouse pancreatic carcinoma cells PK03 in vitro, and further demonstrated the inhibitory effect on phosphorylated MEK-ERK signals at this dose range. In vivo study demonstrated that t-CUPM at dose of 10mg/kg body weight in drinking water had a significant inhibition of pancreatic carcinoma growth in mice subcutaneously implanted PK03 cells, but not same dose of Sorafenib or t-AUCB.
Our previous PK study for sEH inhibitor t-AUCB with 1 mg/kg body weight in mice shows that it is orally bioavailable with significant value of Cmax 150 ± 23 nM and AUCt (nM*h) 1380 ± 300; at this dose range it is highly efficient on inhibiting sEH activity and LPS-induced systemic inflammation [17]. Same dosing of t-CUPM resulted in the higher blood levels than that of sorafenib and t-AUCB, and the Cmax was greater than 2 fold IC50 of c-Raf inhibition and > 390 fold of IC50 of sEH inhibition. Four (35 days –Five weeks) weeks treatment with t-CUPM did not produce any toxic effect in mice grossly and histopathologically. Thus, t-CUPM has the significantly higher Cmax and AUCt than sorafenib and t-AUCB, indicating it may be a more potent and highly potential for translating into animal and clinical studies.
Mutant Ras impairs the intrinsic GTPase activity, leading to persistent activation of the Raf/MEK/ERK pathway, which results in cell proliferation and immortalization [22]. The mutant Kras-transformed mouse PK03 pancreatic ductal carcinoma cell line is a parallel in vitro and in vivo cell model of LSL-KrasG12D/Pdx1-Cre mice with a persistent activation of Raf/MEK/ERK pathway. Using this unique PK03 carcinoma cell line, we have demonstrated that t-CUPM significantly inhibits both in vitro and in vivo tumor growth and mutant Kras-activated phosphorylated-MEK1/2 and ERK1/2. Similar inhibitory effect was also observed in the PK03 cell line treated with pan-Raf inhibitor sorafenib in vitro, but not sEH inhibitor t-AUCB. These results indicating t-CUPM has high potential to translate into clinical trial to inhibit Kras-initiated carcinogenesis.
sEH plays a critical role in regulatory cascades influenced by epoxide-containing lipids. The endogenous sEH substrates are predominantly anti-inflammatory EETs, including 8,9-, 11,12- and 14,15-EET[9, 12]. Epoxide hydrolysis not only eliminates the biological activity of EETs, but also produce pro-inflammatory dehydro metabolites[23]. With enzyme activity assay, we have demonstrated t-CUPM is a most potent sEH inhibitor with IC50 0.5 ± 0.2 nM. Extensive metabolic profile analysis demonstrated that t-CUPM was the most significant increase of the ratios of EET/DHET and EpoME/DiHom in both Omega-6 and Omega-3 fatty acid, indicating its sEH inhibiting activity. Recent studies indicated that ω-3 PUFAs are predominantly metabolized by CYP epoxygenase/s, leading to an accumulation of ω-3 epoxy fatty acid (ω-3 epoxides) including 17,18-epoxyeicosatetraenoic acid (EEQ) derived from EPA and 19,20-epoxydocosapentaenoic acid (EDP) from DHA [24–26]; and ω-3 PUFAs are poor substrates of COX and LOX [27–29]. Functional studies indicate that ω-3 epoxides are highly potent metabolites responsible for anti-inflammatory/carcinogenic actions, possibly via targeting inflammatory signals and MAP kinase [30–33]. Our study showed t-CUPM significantly increased omega-3 epoxide metabolites, implying this effect is at least partially corresponding to its anti-tumor growth.
In summary, with a reasonable oral-bioavailability and dual inhibitory activities of sEH and c-Raf, t-CUPM is a very promising reagent to translate into animal experiment and clinical trial in future for preventing and treating the lethal malignant disease of pancreatic cancer.
Supplementary Material
Highlights.
Findings demonstrated a newly synthesized compound, t-CUPM, was a dual small molecule inhibitor of c-Raf and proinflammatory enzyme soluble epoxide hydrolase and had high potential for inhibiting Kras-initiated carcinogenesis.
Acknowledgments
This study was supported by NIH R01CA164041 and R01CA172431 to Dr. Guang-Yu Yang.
Footnotes
Conflict of interest statement
None
Publisher's Disclaimer: This is a PDF file of an unedited manuscript that has been accepted for publication. As a service to our customers we are providing this early version of the manuscript. The manuscript will undergo copyediting, typesetting, and review of the resulting proof before it is published in its final citable form. Please note that during the production process errors may be discovered which could affect the content, and all legal disclaimers that apply to the journal pertain.
References
- 1.Gao J, Liao J, Yang GY. CAAX-box protein, prenylation process and carcinogenesis. Am J Transl Res. 2009;1(3):312–325. [PMC free article] [PubMed] [Google Scholar]
- 2.Lohr M, Kloppel G, Maisonneuve P, Lowenfels AB, Luttges J. Frequency of K-ras mutations in pancreatic intraductal neoplasias associated with pancreatic ductal adenocarcinoma and chronic pancreatitis: a meta-analysis. Neoplasia. 2005;7(1):17–23. doi: 10.1593/neo.04445. [DOI] [PMC free article] [PubMed] [Google Scholar]
- 3.Hatzivassiliou G, Song K, Yen I, Brandhuber BJ, Anderson DJ, Alvarado R, Ludlam MJ, Stokoe D, Gloor SL, Vigers G, et al. RAF inhibitors prime wild-type RAF to activate the MAPK pathway and enhance growth. Nature. 2010;464(7287):431–435. doi: 10.1038/nature08833. [DOI] [PubMed] [Google Scholar]
- 4.Heidorn SJ, Milagre C, Whittaker S, Nourry A, Niculescu-Duvas I, Dhomen N, Hussain J, Reis-Filho JS, Springer CJ, Pritchard C, et al. Kinase-dead BRAF and oncogenic RAS cooperate to drive tumor progression through CRAF. Cell. 2010;140(2):209–221. doi: 10.1016/j.cell.2009.12.040. [DOI] [PMC free article] [PubMed] [Google Scholar]
- 5.Poulikakos PI, Zhang C, Bollag G, Shokat KM, Rosen N. RAF inhibitors transactivate RAF dimers and ERK signalling in cells with wild-type BRAF. Nature. 2010;464(7287):427–430. doi: 10.1038/nature08902. [DOI] [PMC free article] [PubMed] [Google Scholar]
- 6.Blasco RB, Francoz S, Santamaria D, Canamero M, Dubus P, Charron J, Baccarini M, Barbacid M. c-Raf, but not B-Raf, is essential for development of K-Ras oncogene-driven non-small cell lung carcinoma. Cancer Cell. 2011;19(5):652–663. doi: 10.1016/j.ccr.2011.04.002. [DOI] [PMC free article] [PubMed] [Google Scholar]
- 7.Lowenfels AB, Maisonneuve P, Cavallini G, Ammann RW, Lankisch PG, Andersen JR, Dimagno EP, Andren-Sandberg A, Domellof L. Pancreatitis and the risk of pancreatic cancer. International Pancreatitis Study Group. The New England journal of medicine. 1993;328(20):1433–1437. doi: 10.1056/NEJM199305203282001. [DOI] [PubMed] [Google Scholar]
- 8.Yang GY, Taboada S, Liao J. Inflammatory bowel disease: a model of chronic inflammation-induced cancer. Methods Mol Biol. 2009;511:193–233. doi: 10.1007/978-1-59745-447-6_9. [DOI] [PubMed] [Google Scholar]
- 9.Node K, Huo Y, Ruan X, Yang B, Spiecker M, Ley K, Zeldin DC, Liao JK. Anti-inflammatory properties of cytochrome P450 epoxygenase-derived eicosanoids. Science. 1999;285(5431):1276–1279. doi: 10.1126/science.285.5431.1276. [DOI] [PMC free article] [PubMed] [Google Scholar]
- 10.Inceoglu B, Schmelzer KR, Morisseau C, Jinks SL, Hammock BD. Soluble epoxide hydrolase inhibition reveals novel biological functions of epoxyeicosatrienoic acids (EETs) Prostaglandins & other lipid mediators. 2007;82(1–4):42–49. doi: 10.1016/j.prostaglandins.2006.05.004. [DOI] [PMC free article] [PubMed] [Google Scholar]
- 11.Kim IH, Morisseau C, Watanabe T, Hammock BD. Design, synthesis, and biological activity of 1,3-disubstituted ureas as potent inhibitors of the soluble epoxide hydrolase of increased water solubility. Journal of medicinal chemistry. 2004;47(8):2110–2122. doi: 10.1021/jm030514j. [DOI] [PubMed] [Google Scholar]
- 12.Schmelzer KR, Kubala L, Newman JW, Kim IH, Eiserich JP, Hammock BD. Soluble epoxide hydrolase is a therapeutic target for acute inflammation. Proc Natl Acad Sci U S A. 2005;102(28):9772–9777. doi: 10.1073/pnas.0503279102. [DOI] [PMC free article] [PubMed] [Google Scholar]
- 13.Liu JY, Park SH, Morisseau C, Hwang SH, Hammock BD, Weiss RH. Sorafenib has soluble epoxide hydrolase inhibitory activity, which contributes to its effect profile in vivo. Molecular cancer therapeutics. 2009;8(8):2193–2203. doi: 10.1158/1535-7163.MCT-09-0119. [DOI] [PMC free article] [PubMed] [Google Scholar]
- 14.Hwang SH, Tsai HJ, Liu JY, Morisseau C, Hammock BD. Orally bioavailable potent soluble epoxide hydrolase inhibitors. Journal of medicinal chemistry. 2007;50(16):3825–3840. doi: 10.1021/jm070270t. [DOI] [PMC free article] [PubMed] [Google Scholar]
- 15.Lowinger TB, Riedl B, Dumas J, Smith RA. Design and discovery of small molecules targeting raf-1 kinase. Curr Pharm Des. 2002;8(25):2269–2278. doi: 10.2174/1381612023393125. [DOI] [PubMed] [Google Scholar]
- 16.Zhang W, Li H, Yang Y, Liao J, Yang GY. Knockdown or inhibition of aldo-keto reductase 1B10 inhibits pancreatic carcinoma growth via modulating Kras-E-cadherin pathway. Cancer Lett. 2014;355(2):273–280. doi: 10.1016/j.canlet.2014.09.031. [DOI] [PMC free article] [PubMed] [Google Scholar]
- 17.Liu JY, Tsai HJ, Hwang SH, Jones PD, Morisseau C, Hammock BD. Pharmacokinetic optimization of four soluble epoxide hydrolase inhibitors for use in a murine model of inflammation. Br J Pharmacol. 2009;156(2):284–296. doi: 10.1111/j.1476-5381.2008.00009.x. [DOI] [PMC free article] [PubMed] [Google Scholar]
- 18.Yang J, Schmelzer K, Georgi K, Hammock BD. Quantitative profiling method for oxylipin metabolome by liquid chromatography electrospray ionization tandem mass spectrometry. Anal Chem. 2009;81(19):8085–8093. doi: 10.1021/ac901282n. [DOI] [PMC free article] [PubMed] [Google Scholar]
- 19.Wan PT, Garnett MJ, Roe SM, Lee S, Niculescu-Duvaz D, Good VM, Jones CM, Marshall CJ, Springer CJ, Barford D, et al. Mechanism of activation of the RAF-ERK signaling pathway by oncogenic mutations of B-RAF. Cell. 2004;116(6):855–867. doi: 10.1016/s0092-8674(04)00215-6. [DOI] [PubMed] [Google Scholar]
- 20.Rivera JA, Rall CJ, Graeme-Cook F, Fernandez-del Castillo C, Shu P, Lakey N, Tepper R, Rattner DW, Warshaw AL, Rustgi AK. Analysis of K-ras oncogene mutations in chronic pancreatitis with ductal hyperplasia. Surgery. 1997;121(1):42–49. doi: 10.1016/s0039-6060(97)90181-1. [DOI] [PubMed] [Google Scholar]
- 21.Fabian MA, Biggs WH, 3rd, Treiber DK, Atteridge CE, Azimioara MD, Benedetti MG, Carter TA, Ciceri P, Edeen PT, Floyd M, et al. A small molecule-kinase interaction map for clinical kinase inhibitors. Nature biotechnology. 2005;23(3):329–336. doi: 10.1038/nbt1068. [DOI] [PubMed] [Google Scholar]
- 22.Mebratu Y, Tesfaigzi Y. How ERK1/2 activation controls cell proliferation and cell death: Is subcellular localization the answer? Cell Cycle. 2009;8(8):1168–1175. doi: 10.4161/cc.8.8.8147. [DOI] [PMC free article] [PubMed] [Google Scholar]
- 23.Newman JW, Morisseau C, Hammock BD. Epoxide hydrolases: their roles and interactions with lipid metabolism. Progress in lipid research. 2005;44(1):1–51. doi: 10.1016/j.plipres.2004.10.001. [DOI] [PubMed] [Google Scholar]
- 24.Fischer RKA, Mehling H, Blossey K, Gapelyuk A, Wessel N, von Schacky C, Dechend R, Muller DN, Rothe M, Luft FC, Weylandt K, Schunck WH. Dietary omega-3 fatty acids modulate the eicosanoid profile in man primarily via the CYP-epoxygenase pathway. J Lipid Res. 2014;55(6):1150–1164. doi: 10.1194/jlr.M047357. [DOI] [PMC free article] [PubMed] [Google Scholar]
- 25.Arnold C, Markovic M, Blossey K, Wallukat G, Fischer R, Dechend R, Konkel A, von Schacky C, Luft FC, Muller DN, Rothe M, Schunck WH. Arachidonic acid-metabolizing cytochrome P450 enzymes are targets of {omega}-3 fatty acids. J Biol Chem. 2010;285(43):32720–32733. doi: 10.1074/jbc.M110.118406. [DOI] [PMC free article] [PubMed] [Google Scholar]
- 26.Astarita GM, Wang JH, Strassburg B, Doneanu K, Johnson A, Baker J, Hankemeier A, Murphy T, Vreeken J, Langridge RJ, Kang J, JX A protective lipidomic biosignature associated with a balanced omega-6/omega-3 ratio in fat-1 transgenic mice. PloS one. 2014;9(4):e96221. doi: 10.1371/journal.pone.0096221. [DOI] [PMC free article] [PubMed] [Google Scholar]
- 27.Jump DB. The biochemistry of n-3 polyunsaturated fatty acids. J Biol Chem. 2002;277(11):8755–8758. doi: 10.1074/jbc.R100062200. [DOI] [PubMed] [Google Scholar]
- 28.Malkowski MG, Thuresson ED, Lakkides KM, Rieke CJ, Micielli R, Smith WL, Garavito RM. Structure of eicosapentaenoic and linoleic acids in the cyclooxygenase site of prostaglandin endoperoxide H synthase-1. J Biol Chem. 2001;276(40):37547–37555. doi: 10.1074/jbc.M105982200. [DOI] [PubMed] [Google Scholar]
- 29.Laneuville O, Breuer DK, Xu N, Huang ZH, Gage DA, Watson JT, Lagarde M, DeWitt DL, Smith WL. Fatty acid substrate specificities of human prostaglandin-endoperoxide H synthase-1 and -2. Formation of 12-hydroxy-(9Z, 13E/Z, 15Z)- octadecatrienoic acids from alpha-linolenic acid. J Biol Chem. 1995;270(33):19330–19336. doi: 10.1074/jbc.270.33.19330. [DOI] [PubMed] [Google Scholar]
- 30.Zhang GPD, Mahakian LM, Yang J, Liu JY, Stephen Lee KS, Wettersten HI, Ulu A, Hu X, Tam S, Hwang SH, Ingham ES, Kieran MW, Weiss RH, Ferrara KW, Hammock BD. Epoxy metabolites of docosahexaenoic acid (DHA) inhibit angiogenesis, tumor growth, and metastasis. Proc Natl Acad Sci U S A. 2013;110(16):6530–6535. doi: 10.1073/pnas.1304321110. [DOI] [PMC free article] [PubMed] [Google Scholar]
- 31.Morin C, Sirois M, Echave V, Albadine R, Rousseau E. 17,18-epoxyeicosatetraenoic acid targets PPARgamma and p38 mitogen-activated protein kinase to mediate its anti-inflammatory effects in the lung: role of soluble epoxide hydrolase. American journal of respiratory cell and molecular biology. 2010;43(5):564–575. doi: 10.1165/rcmb.2009-0155OC. [DOI] [PubMed] [Google Scholar]
- 32.Kubota TAM, Isobe Y, Iwamoto R, Goto T, Yoshioka T, Urabe D, Inoue M, Arai H. Eicosapentaenoic acid is converted via omega-3 epoxygenation to the anti-inflammatory metabolite 12-hydroxy-17,18-epoxyeicosatetraenoic acid. FASEB journal: official publication of the Federation of American Societies for Experimental Biology. 2014;28(2):586–593. doi: 10.1096/fj.13-236224. [DOI] [PubMed] [Google Scholar]
- 33.Cui PH, Petrovic N, Murray M. The omega-3 epoxide of eicosapentaenoic acid inhibits endothelial cell proliferation by p38 MAP kinase activation and cyclin D1/CDK4 down-regulation. Br J Pharmacol. 2011;162(5):1143–1155. doi: 10.1111/j.1476-5381.2010.01113.x. [DOI] [PMC free article] [PubMed] [Google Scholar]
Associated Data
This section collects any data citations, data availability statements, or supplementary materials included in this article.