

Abstract
Aim
Positive outcomes for paediatric rhabdomyosarcoma (RMS) were high in Sweden during the 1990s, but the last decade has seen decreasing trends in overall survival rates. We investigated the incidence, patient and disease characteristics, treatment and outcome of RMS to see whether any reason could be found for this decline.
Methods
This study included 210 children under the age of 15 who were diagnosed with RMS and whose details were recorded in the population‐based Swedish Childhood Cancer Registry from 1984 to 2010.
Results
The overall annual incidence of RMS was 4.9 per million, and the 5‐year overall survival rates were 59 ± 7% in 1984–1989, 78 ± 5% in 1990–1999 and 71 ± 5% in 2000–2010. When patients with localised disease were analysed separately, there was no difference in the 5‐year survival rates between 1990 and 1999 (82 ± 5%) and 2000–2010 (81 ± 5%), but the outcome in 1984–1989 (53 ± 8%) was significantly worse. The prevalence of metastatic disease was unexpectedly high during 2000–2010 (28%, p = 0.010), compared to an overall mean of 18% for the whole study period.
Conclusion
Our results suggest that a higher rate of metastatic disease may explain the declining trend in overall survival rates in paediatric RMS in Sweden over the last decade.
Keywords: Cancer, Metastatic disease, Overall survival, Paediatric rhabdomyosarcoma, Swedish Childhood Cancer Registry
Key notes.
The last decade has seen a declining trend in 5‐year overall survival rates for Swedish children with rhabdomyosarcoma.
We investigated whether any reason could be found for this by mapping outcome and patient characteristics using data from a national cancer registry.
The results suggest that a higher rate of metastatic disease in the latter years of the study may explain the declining trend in overall survival rates.
Introduction
Rhabdomyosarcoma (RMS) is the largest subgroup of soft tissue sarcomas, with an incidence of four to six per million children 1, 2, 3, 4, 5, 6. There is a slight predominance in boys 3, 5, 6, 7, 8, who also have a better prognosis 1, 9. It is a rare disease in adults, and the median age is 5 years of age 7, 10. Of the two main groups of histological classification, alveolar RMS and embryonal RMS, the latter is the more common and has a better prognosis 10, 11. The tumours can be located in all parts of the body where there is mesenchymal tissue, but the most frequent sites are in the head and neck region, in genitourinary sites and in limbs 3, 10, 12. Treatment consists of multimodal therapy involving chemotherapy combined with surgery and, or, radiotherapy. To achieve optimal results at the lowest risks for side effects, the therapy must be planned with regard to known prognostic factors. Such factors include the extent of the disease, the age of the patient, the pathological subtype and site of the tumour and the predicted risk of sequelae as a result of the treatment 10.
The prognosis for RMS in Sweden has improved considerably over the last 50 years, as for all childhood cancers, with the most dramatic improvement occurring in the 1970 and 1980s. However, in Sweden a declining trend in survival rates for RMS has been detected during the last decade and was shown in the report from the Swedish Childhood Cancer Registry (Fig. 1) 13. The aim of this study was to map out the incidence, patient and clinical characteristics, treatment and outcome, to see whether there was a significant decline in prognosis and, if so, investigate the possible underlying causes. An additional aim was to investigate how the characteristics, treatment and outcome had changed over time from 1984 to 2010 inclusive.
Figure 1.
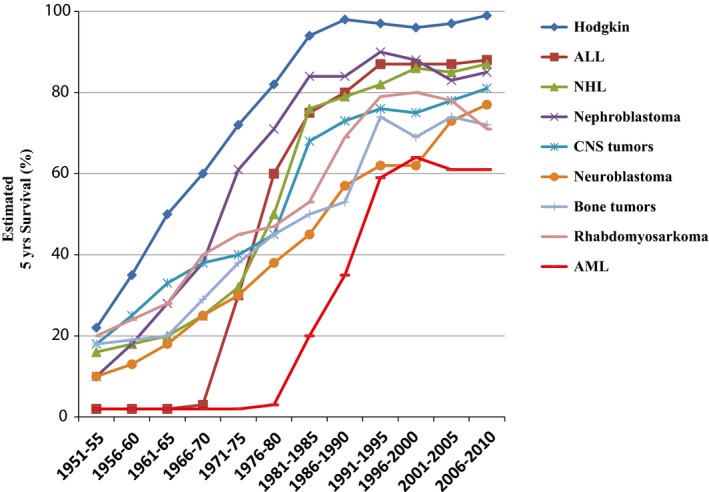
The estimated prognosis (5‐year survival) over time for selected diagnostic groups. The figure is obtained from the report Childhood Cancer Incidence and Survival in Sweden 1984–2010 13.
Material and methods
Patients
This study included all children from birth to 14 years of age with RMS diagnosed in Sweden during the years 1984–2010, in the population‐based Swedish Childhood Cancer Registry, which was frozen on 1 January 2013. Complementary information was collected from the medical charts at the six childhood cancer centres that were included in the Registry. In general, children with cancer in Sweden are treated in paediatric oncology units if they are diagnosed below the age of 18 years. When we carried out our study, all children aged 0–17 years were included in the Swedish Childhood Cancer Registry, but 20–30 years ago not all children were treated in paediatric units and there was a risk of unregistered children in the upper teens. Therefore, this study only included children aged 0–14 years of age. This also made it comparable with other studies 1, 13.
Ethics
The Swedish Childhood Cancer Registry was ethically approved by all the different regional ethics review committees in Sweden headed by the Karolinska Institute ethics review committee (KI Dnr 03‐642). Informed consent to register data was obtained from the parents. In addition, ethical approval to retrieve data from the register was obtained (Dnr 2014/137).
Statistical methods
Descriptive statistics were used for incidence, sex, age, pathological subtypes, tumour size and sites, metastatic status, treatment, relapse and cause of death. The chi‐square test was used for comparisons between groups. The population statistics that were used to estimate incidence were extracted from Statistics Sweden 14. Annual incidence is presented per million children aged 0–14 years. To investigate whether there were differences in incidence, patient and clinical characteristics or in outcome over time, the cases were split into three groups, according to the time period of diagnosis: 1984–1989, 1990–1999 and 2000–2010. The rationale for this division was based on different treatments before and after 1990, as explained below. The last two periods were divided so that they were approximately equal. The probability of overall survival and event‐free survival was estimated using the Kaplan–Meier method. The log‐rank test was used to compare survival between different groups. Patients who had not experienced any negative events were censored at the last follow‐up date. SPSS software 15 was used for the statistical analyses. Statistical significance was assumed if p was <0.05.
Definitions
Event‐free survival was defined as the time from diagnosis to relapse or death, and overall survival was defined as the time from diagnosis to death from any cause. The endpoint of event‐free survival reflected the percentage of patients who remained alive during the study, without relapse or death from any cause, and the endpoint for overall survival was the percentage who remained alive with or without any relapse. Survival data were obtained from the Swedish Childhood Cancer Registry. The subdivision into sites of primary tumour, metastatic status and resection status was based on the information available from the Registry, and resection status was based on the definition in the Cooperative Weichteilsarkom Studiengruppe (CWS) guidance protocol. Resection status R0 implies microscopically complete with a radical resection, R1 implies microscopically incomplete with a marginal resection, and R2 implies macroscopically incomplete with an intralesional resection.
Treatment
The patients had been treated with chemotherapy combined with surgery and/or radiotherapy. During the first time period, 1984–1989, most patients received chemotherapy consisting of ifosfamide, vincristine and actinomycin D (IVA) or vincristine, actinomycin D and cyclophosphamide with the addition of doxorubicin (superVAC). During the two last periods, 1990–1999 and 2000–2010, all but one of the patients received systemic treatment with multi‐agent conventional chemotherapy according to the respective CWS protocol. The prescribed chemotherapeutical regimens were vincristine, actinomycin D, ifosfamide and doxorubicin (VAIA) for all patients in CWS‐86 9 and vincristine, actinomycin D, cyclophosphamide and doxorubicin (VACA) or etoposide, vincristine, actinomycin D, ifosfamide and doxorubicin (EVAIA) for localised RMS in CWS‐91 16. Patients with metastatic disease in CWS‐91 were recommended treatment according to the protocol of the International Society of Paediatric Oncology. In later CWS protocols, combinations of drugs such as vincristine and actinomycin D (VA) and, or, ifosfamide, vincristine and actinomycin D (IVA) were prescribed for patients in low and standard risk groups. Patients in higher risk groups received treatment that consisted of VAIA or carboplatin, epirubicin, vincristine, actinomycin D, ifosfamide and etoposide (CEVAIE) in CWS‐96 17, VAIA in CWS 2002 P, CEVAIE in CWS‐IV 2002 and VAIA or CEVAIE in the CWS guidance. During the three time periods, surgery and radiotherapy recommendations were largely the same.
Results
Patient and clinical characteristics
During the period 1984‐2010, 218 children from birth to the age of 14 who had been diagnosed with RMS were registered in the Swedish Childhood Cancer Registry. Of the 218 children, eight were ineligible and were excluded: four had cancer diagnoses other than RMS, two had diagnostic procedures that had not been carried out in Sweden, and two children had no malignancy at all. This left 210 eligible for the study. The overall annual incidence was 4.9 per million, with a slight predominance in boys, based on a male female ratio of 1.10 corrected for the natural sex distribution (Fig. 2). The median and mean follow‐up times were 8.8/10.3 years (range 0–27.9 years) for all children and 13.5/13.8 years (range 2–27.9 years) for survivors.
Figure 2.
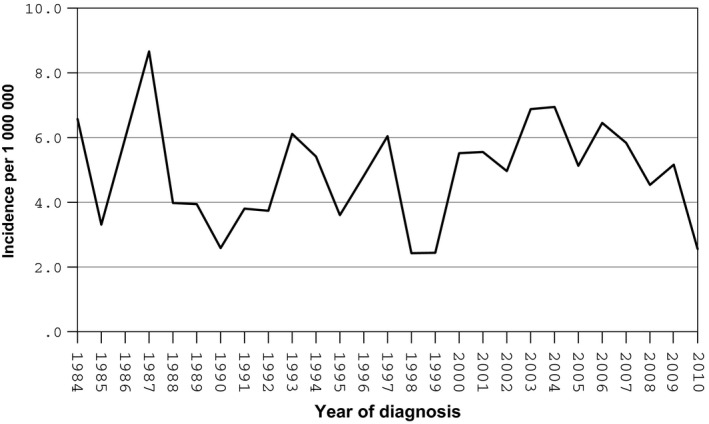
Incidence of RMS in Swedish children 0–14 years of age during 1984–2010.
The median and mean ages at diagnosis were 4/5.2 years (range 0–14 years). Further patient and clinical characteristics are shown in Table 1. There were no significant differences in sex distribution regarding age groups under the age of one, 1–9 years and 10–14 years. No significant differences in the distribution of size groups (≤5 cm and >5 cm) could be found regarding sex or age. Tumours of more than 5 cm were more common in other sites, extremities and genito‐urinary bladder or prostate compared with tumours under or equal to 5 cm, which were more common in orbit, genito‐urinary not bladder or prostate, nonparameningeal head and neck and parameningeal head and neck sites. Metastatic disease was more common in girls, in patients with alveolar RMS, in patients with tumours located in unfavourable sites (Table 2) and in patients diagnosed during the last time period (Table 1). We found no difference in the distribution of the pathological subtype according to sex and age groups. Table 3 shows surgery and radiotherapy frequency, as well as resection status and radiation doses. More than half (54%) of the patients received radiotherapy as part of their treatment and radiation doses were reported in 73 of the 111 cases. The mean dose given was 43 Gy, with doses of <40 Gy given in 25 cases, 40–50 Gy in 16 cases and >50 Gy in 18 cases.
Table 1.
Patient and clinical characteristics of children with RMS, based on all patients (n = 210) and according to time periods
| 1984–2010 (n = 211) | 1984–1989 (n = 49) | 1990–1999 (n = 68) | 2000–2010 (n = 94) | p Value* | |
|---|---|---|---|---|---|
| Sex (%) | |||||
| Male | 113 (54) | 27 (55) | 37 (55) | 49 (52) | NS |
| Female | 97 (46) | 22 (45) | 30 (45) | 45 (48) | |
| Age (years) (%) | |||||
| <1 | 24 (11) | 8 (16) | 9 (13) | 7 (7) | NS |
| 1–9 | 152 (72) | 31 (63) | 50 (75) | 71 (76) | |
| 10–14 | 34 (16) | 10 (20) | 8 (12) | 16 (17) | |
| Subtype (%) | |||||
| Embronal RMS | 151 (81) | 33 (87) | 48 (81) | 70 (78) | NS/0.015 |
| Alveolar RMS | 36 (19) | 5 (13) | 11 (19) | 20 (22) | |
| Others1 | 23 | 11 | 8 | 4 | |
| Tumour size (%) | |||||
| ≤5 cm | 92 (58) | 9 (50) | 31 (53) | 52 (62) | NS/<0.001 |
| >5 cm | 68 (43) | 9 (50) | 27 (47) | 32 (38) | |
| Missing | 50 | 31 | 9 | 10 | |
| Primary site (%) | |||||
| HNPM2 | 54 (26) | 12 (25) | 14 (21) | 28 (30) | 0.002/0.006 |
| HN‐nonPM3 | 26 (13) | 6 (13) | 13 (20) | 7 (8) | |
| UG‐nonBP4 | 26 (13) | 7 (15) | 9 (14) | 10 (11) | |
| EXT5 | 26 (13) | 2 (4) | 10 (15) | 14 (15) | |
| UG‐BP6 | 25 (12) | 2 (4) | 10 (15) | 13 (14) | |
| ORB7 | 15 (7) | 2 (4) | 2 (3) | 11 (12) | |
| OTH8 | 35 (17) | 17 (35) | 8 (12) | 10 (11) | |
| Missing | 3 | 1 | 1 | 1 | |
| Favourable9 | 69 (33) | 15 (31) | 25 (38) | 29 (31) | NS/NS |
| Unfavourable10 | 138 (67) | 33 (69) | 41 (62) | 64 (69) | |
| Missing | 3 | 1 | 1 | 1 | |
| Metastatic status (%) | |||||
| Localised RMS | 161 (81) | 40 (91) | 56 (88) | 65 (72) | 0.010/0.021 |
| Metastatic RMS | 37 (19) | 4 (9) | 8 (13) | 25 (28) | |
| Missing | 12 | 5 | 3 | 4 | |
*p Value determined by chi‐square test (missing information excluded/included). 1Includes patients diagnosed with RMS without further specified subtype or missing information about subtype in the registry. 2Head and neck (parameningeal), 3Head and neck (nonparameningeal), 4Genitourinary (not bladder or prostate), 5Extremities, 6Genitourinary (bladder or prostate), 7Orbit, 8Other sites, 9Orbit, genitourinary (not bladder or prostate) and head and neck (nonparameningeal), 10Extremities, genitourinary (bladder or prostate), head and neck (parameningeal), and other sites.
Table 2.
Distribution of localised versus metastatic RMS according to patient and clinical characteristics
| Localised RMS | Metastatic RMS | Missing | p Value* | |
|---|---|---|---|---|
| Sex (%) | ||||
| Male | 91 (87) | 14 (13) | 8 | 0.040/NS |
| Female | 70 (75) | 23 (25) | 4 | |
| Age (years) (%) | ||||
| <1 | 19 (91) | 2 (10) | 3 | NS/NS |
| 1–9 | 116 (80) | 29 (20) | 7 | |
| 10–14 | 26 (81) | 6 (19) | 2 | |
| Subtype (%) | ||||
| Embryonal RMS | 126 (88) | 18 (13) | 7 | <0.001/<0.001 |
| Alveolar RMS | 19 (56) | 15 (44) | 2 | |
| Other1 | 16 (80) | 4 (20) | 3 | |
| Tumour size (%) | ||||
| ≤5 cm | 75 (85) | 13 15) | 4 | NS/NS |
| >5 cm | 48 (74) | 17 (26) | 3 | |
| Missing | 38 | 7 | 5 | |
| Primary site (%) | ||||
| Favourable2 | 56 (90) | 6 (10) | 7 | 0.033/0.007 |
| Unfavourable3 | 104 (78) | 30 (22) | 4 | |
| Missing | 1 | 1 | 1 | |
*p Value determined by chi‐square test (missing information excluded/included). 1Includes patients diagnosed with RMS without further specified subtype, or missing information about subtype in the registry. 2Orbit, genitourinary (not bladder or prostate) and head and neck (nonparameningeal), 3Extremities, genitourinary (bladder or prostate), head and neck (parameningeal), and other sites.
Table 3.
Treatment for children with RMS, based on all patients (n = 210) and according to time periods
| 1984–2010 | 1984–1989 | 1990–1999 | 2000–2010 | p Value* | |
|---|---|---|---|---|---|
| Surgery (%) | |||||
| Yes | 141 (68) | 31 (65) | 52 (79) | 58 (62) | NS/NS |
| No | 66 (32) | 17 (35) | 14 (21) | 35 (38) | |
| Missing | 3 | 1 | 1 | 1 | |
| Resection status1 (%) | |||||
| R0 | 46 (39) | 6 (26) | 19 (44) | 21 (40) | NS/NS |
| R1 | 49 (41) | 12 (52) | 17 (40) | 20 (38) | |
| R2 | 24 (20) | 5 (22) | 7 (16) | 12 (23) | |
| Missing | 25 | 9 | 10 | 6 | |
| Radiotherapy (%) | |||||
| Yes | 111 (54) | 26 (53) | 30 (46) | 55 (60) | NS/NS |
| No | 95 (46) | 23 (47) | 36 (55) | 36 (40) | |
| Missing | 4 | 0 | 1 | 3 | |
| Mean dose given (Gy) | 43 (n = 71) | 45 (n = 18) | 39 (n = 27) | 45 (n = 28) | |
*p Value determined by chi‐square test (missing information excluded/included). 1Patients who did not have surgery (n = 66) excluded.
Patient and clinical characteristics in three diagnostic time periods
The incidence was 5.4, 4.1 and 5.4 per million in 1984–1989, 1990–1999 and 2000–2010, respectively. When tumours with rhabdomyosarcoma not otherwise specified subtype or missing information about subtype were excluded from analysis, there was no significant difference between the time periods regarding pathological subtype. Nearly two‐thirds (63%) of the cases lacked information on the size of the tumour during the first time period, compared to about one in eight cases during the second and third time periods. There were also differences in the distribution of primary sites (Table 1). Furthermore, in 2000–2010, the frequency of metastasis at diagnosis was significantly higher than in the earlier time periods (28 versus 9%, p = 0.014 and 28 versus 13%, p = 0.026, respectively) (Table 1).
As for the remaining patient and clinical characteristics, no significant differences between the time periods were found (Table 1). Table 3 shows the types of treatments given during the different time periods. The only significant difference we found was that the percentage of children receiving surgery was higher in 1990–1999 than in 2000–2010.
Outcome
In this study, overall survival and event‐free survival were 76 ± 3 and 63 ± 3%, respectively, at 3 years, 71 ± 3 and 61 ± 3% at 5 years and 70 ± 3 and 61 ± 3% at 10 years.
There was no significant differences in 5‐year overall survival for boys compared to girls (74 ± 4 versus 68 ± 5%, p = 0.071).
No significant difference in survival rates could be found between children under 10 years of age and 10–14 years of age or between children under 1 year of age and children of 10–14 years of age. Children from one to 9 years of age had a superior 5‐year overall survival rate compared to children under the age of one (77 ± 4 versus 50 ± 10%, p = 0.002), as well as compared to children of 10–14 years of age (77 ± 4 versus 58 ± 9%, p = 0.021). Patients with embryonal RMS had a superior 5‐year overall survival rate compared to patients with alveolar RMS (77 ± 4 versus 61 ± 8%, p = 0.030) and also compared to patients with RMS without further specification or with information missing concerning subtype (77 ± 4 versus 44 ± 10%, p < 0.001). Patients with a tumour with a diameter of ≤5 cm had a higher 5‐year overall survival rate than patients with a tumour with a diameter of >5 cm (82 ± 4 versus 65 ± 6%, p = 0.003) and with a tumour with no registered size (82 ± 4 versus 58 ± 7%, p = 0.001). There were no significant differences between the last two groups. Patients with a tumour in a favourable site (orbit, genito‐urinary nonbladder or prostate and nonparameningeal head and neck) had superior prognoses compared with patients with a tumour in an unfavourable site (extremities, genito‐urinary bladder or prostate, parameningeal head and neck and other sites). The comparable 5‐year overall survival rates were 81 ± 5 versus 66 ± 4% (p = 0.020).
Patients with an orbital tumour had the best prognosis and patients with a tumour located in the category other sites had the worst prognosis, with a 5‐year overall survival rate of 93 ± 6 versus 51 ± 9% (p = 0.006). Five‐year overall survival was better for children with localised RMS than with children with metastatic RMS (74 ± 4 versus 48 ± 8%) (Fig. 3). There were no significant differences between the results of the three largest groups of treatment protocols – CWS‐91, CWS‐96 and CWS 2002 P – or between the patients who received radiotherapy and those who did not.
Figure 3.
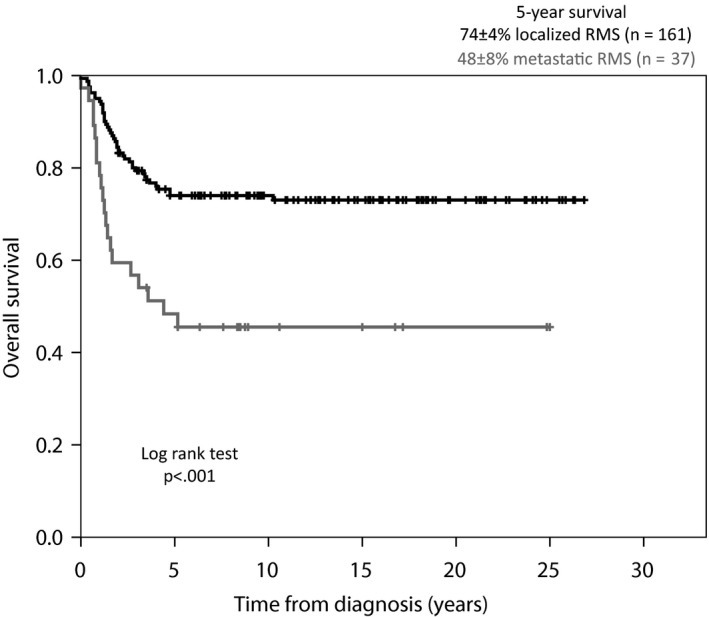
Overall survival curve. The present material according to metastatic status at time of diagnosis.
Regarding resection status, R0 was associated with a higher 5‐year overall survival rate compared to R2 (87 ± 5 versus 62 ± 10%, p = 0.014) and compared to patients who did not receive surgery (87 ± 5 versus 58 ± 6%, p = 0.001). There were no other significant differences between the resection status groups, but the difference in the 5‐year overall survival rate between R0 and R1 (87 ± 5 versus 71 ± 7%, p = 0.054) did indicate a trend.
Just under a third of the children (n = 67, 32%) suffered a relapse and 19 of them survived, with a 5‐year overall survival rate of 29 ± 6%. The median and mean time from diagnosis to relapse was 14/17.4 months (range 4–45 months), and the median and mean time from relapse to death was 7.0/10.1 months (range 0–42). A total of 63 patients died and, in addition to the relapse‐related deaths, eleven patients died from progressive disease, three died early before remission, and one died later on from heart failure suspected to be caused by anthracyclines.
Outcome in the three diagnostic time periods
The prognosis improved significantly over time during 1984–1989 and 1990–1999, with a 5‐year overall survival rate of 59 ± 7 versus 78 ± 5% (Fig. 4). The differences between 1990 and 1999 and 2000–2010 rates (78 ± 5 versus 71 ± 5%) and the 1984–1989 and 2000–2010 rates (59 ± 7 versus 71 ± 5%) were not significant. The 5‐year event‐free survival rates did not differ significantly between the time periods: 1984–1989 (59 ± 7%), 1990–1999 (63 ± 6%) and 2000–2010 (61 ± 5%). The prognosis for localised RMS improved over time (Fig. 5). The survival rates were significantly higher in 1990–1999 (82 ± 5%) and 2000–2010 (81 ± 5%) compared to the first period (53 ± 8%), and there was no significant difference between the last two periods. The relapse frequency did not differ significantly between the three time periods. No patients in the first period with relapse survived, while the 5‐year overall survival rate for patients with relapse was 46 ± 11% in 1990–1999 and 33 ± 9% in 2000–2010. There was no significant difference between the last two periods. Of the three patients who were registered as early deaths before remission, two were registered in the last time period and one of them died before receiving any treatment.
Figure 4.
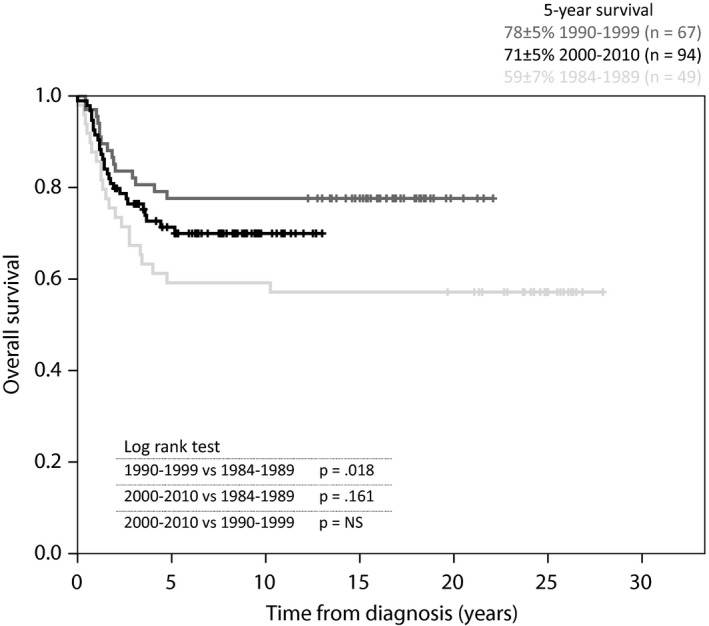
Overall survival curve. All patients (n = 210) according to diagnostic time periods.
Figure 5.
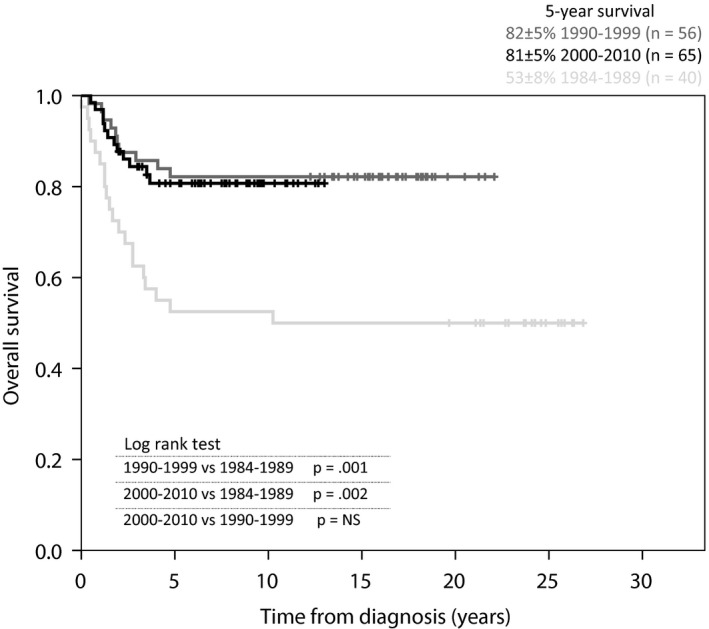
Overall survival curve. Patients with localised RMS (n = 161) according to diagnostic time periods.
Discussion
The Swedish incidence of RMS was stable over time and similar to that reported in earlier publications 1, 2, 3, 4, 5, 6. As expected, there was a slight male predominance and the age distribution was comparable to international data published, as was the distribution of pathological subtype, size and primary site 3, 6, 7, 8, 9, 10. The frequency of metastatic disease for the total cohort was equivalent to that reported in earlier publications 5, 7, 8, 9, 10, but during the last time period, 2000–2010, the metastasis rate at diagnosis was surprisingly high. During the last time period, the rate of metastatic disease was significantly higher than the earlier time periods, with a metastasis rate of 28% compared to 9% in 1984–1989 and 13% in 1990–1999. This increased rate occurred in parallel with a declining trend in overall survival. When only children with localised disease were analysed, the survival rate during the last time period was as good as during 1990–1999 and reflected corresponding international results. There were no further significant differences over time regarding patient and clinical characteristics, except that in 1984–1989 the registered size of the tumour was missing in a larger number of cases and there was a different distribution of primary sites. These differences may be due to the fact that the majority of cases during the first time period were not included in any CWS study, in which information about the size and site was required. As these data were of little clinical interest at that time, the justification for registering this information was weak and may be the reason behind the larger number of cases where there were missing or indistinct data.
The prognosis regarding sex, age, pathological subtype and size was in accordance with earlier studies 9, 16, 18. Just as the report by Dantonello et al. 16 showed, the primary site category with the best prognosis was the orbit and the worst was the category called other sites. As indicated in the report from the Swedish Childhood Cancer Registry 13, the overall 5‐year survival rate was higher in 1990–1999 (78 ± 5%) than in 2000–2010 (71 ± 5%), but this difference was not significant. However, there was a significant increase in survival rates between the first two periods. Compared with earlier publications, the outcomes from 1984 to 1989 were not very good, with a 5‐year overall survival of 59 ± 7% 2, 7, 9. A report from the Nordic Society of Paediatric Haematology and Oncology, which provided data from 1991–1995 and 1996–2000, showed 5‐year overall survival rates of 68% and 75% respectively 2. According to Stiller et al. 19, the 5‐year overall survival results in a British population were 63% in 1989–1995, 67% in 1995–2003 and 63% in 2003–2005, revealing a similar trend to those in Sweden, with a slight decrease in survival rates in the later years. In comparison with both the Nordic and British results, as well as the 5‐year overall survival rate of 66% for American children with RMS in 1999–2006 4, the present study showed better results. The survival rate for localised RMS in 1984–1989 was worse than expected with a 5‐year overall survival of 53 ± 8% and in an international comparison this survival rate was far from satisfactory 7, 9. Gratifyingly, the survival rates for localised RMS increased significantly during the two last periods compared to the first period and there was no difference between the last two periods. Accordingly, when patients with metastatic disease were excluded, the result from 2000 to 2010 was as good as for 1990–1999. No decrease in survival could be shown. The result from 1990 to 2010 was similar to those in the third and fourth intergroup Rhabdomyosarcoma Studies and our results were better than those in CWS‐91 16, 20. As expected, the prognosis was worse for patients with metastatic disease than for patients with localised disease. The 5‐year overall survival rate for metastatic disease (48 ± 8%) was better than corresponding previously published results 7, 21, 22.
There are limitations with all register‐based studies, and the reliability is dependent both on the quality and the frequency of reporting. The Swedish Childhood Cancer Registry is reported to have maintained a high standard 1. However, the Registry has been adjusted to suit many different cancer types and does not always perfectly suit RMS, which may risk confusion and incorrect reporting. During the period that we studied, knowledge about the risk factors as well as the diagnostic methods and treatment developed, leading to differences in documentation over time. In the majority of cases when the information was missing or confusing, or when there was a suspicion of inaccuracy, a control of the medical charts was performed. Some of the publications that are used for comparison with our results had a slightly different patient population, with older patients and/or RMS‐like tumours included. As most of the patients were younger than 15 years of age, and within the age range that was used for the present study, comparisons are considered justified. RMS‐like tumours constitute a small part of the cases, have many similarities with RMS regarding the prognosis and characteristics, and are therefore also considered appropriate for comparisons. When comparing outcome by patient and clinical characteristics, some publications use failure free survival or event‐free survival to assess the prognosis instead of overall survival and some of them only include localised RMS. As the comparison focuses on relative differences between groups, they are, to a certain extent, considered valid for comparison.
The higher rate of metastatic disease may explain the declining trend in overall survival in paediatric RMS in Sweden over the last decade. However, the reason for the higher frequency remains unclear and it would be of great interest to find out more about underlying causes, if there are any as perhaps the higher frequency is just a coincidence. Another possible cause could be that there may have been delays by the doctor, parents or patient, due to inadequate accessibility to medical care, but this seems less plausible. The time from the first clinical symptoms to diagnosis or treatment was not investigated in the present study, but it may be interesting to examine this in future studies. Yet another conceivable cause could be that diagnostic resources have developed over time and metastases revealed in the last decade would not have been detected in earlier periods. In other words, a disease that would earlier have been considered as localised RMS could, with new diagnostic tools, be considered and treated as metastatic RMS. This would result in a higher rate of registered metastatic disease. If the metastases were true and of clinical relevance, the patients concerned would have been under‐treated during earlier periods, when the metastases had been unrevealed. If so, more adequate and intensive treatment would lead to increased survival during the last decade, when the metastases were revealed. The survival would not decrease, as seen in the present study. On the contrary, if the revealed metastases were not of clinical relevance, some patients would have falsely been considered to be afflicted with metastatic disease during the last decade. This would have caused a risk for over treatment. However, only one of the deaths in the last decade was caused by suspected toxicity. Therefore, the latter theory is less likely to be true.
Conclusion
We conclude that the results of this study were generally in line with earlier international studies. However, an important exception was the high proportion of patients with metastatic disease during the last decade. The metastasis rate in 2000–2010 was higher than both earlier periods and international data. As expected, metastatic disease had a worse prognosis than localised disease and when only localised RMS was analysed, no decline in survival rate in the last decade could be revealed. Therefore, the results may suggest that the declining trend in overall survival in paediatric RMS in Sweden over the last decade can be explained by the higher rate of metastatic disease.
Funding
Financial support was obtained from the Swedish Childhood Cancer Foundation.
Conflict of interest
The authors have no conflicts to declare.
References
- 1. Ljungman G, Jakobson Å, Behrendtz M, Ek T, Friberg L‐G, Hjalmars U, et al. Incidence and survival analyses in children with solid tumours diagnosed in Sweden between 1983 and 2007. Acta Paediatr 2011; 100: 750–7. [DOI] [PubMed] [Google Scholar]
- 2. Frandsen T, Hellebostad M. Report on epidemiologic and therapeutic results from registries and working groups. [Internet] Turku: Nordic Society of Pediatric Haematology and Oncology, 2011. Available from: http://www.nopho.org/member_pages/member_area/organization/nopho_report/Final%20NOPHO%20ann%20rep%20TURKU%202011-v3.pdf. (accessed on 18 Feb 2014). [Google Scholar]
- 3. Stevens MCG, Caron HN, Biondi A, Ferrari A, Bisogno G. Soft tissue sarcomas. Cancer in Children 6. Oxford: Oxford University Press, 2012: 274–84. [Google Scholar]
- 4. Howlader N, Noone A, Krapcho M, Garshell J, Neyman N, Altekruse S, et al. SEER Cancer Statistics Review, 1975–2010 CSR tables 29.1, 29.2 and 29.6 [Internet]. Bethesda: National Cancer Institute. Available from: http://seer.cancer.gov/csr/1975_2010/. (accessed on 2 Feb 2014).
- 5. Paulino AC, Okcu MF. Rhabdomyosarcoma. Curr Probl Cancer 2008; 32: 7–34. [DOI] [PubMed] [Google Scholar]
- 6. Weihkopf T, Blettner M, Dantonello T, Jung I, Klingebiel T, Koscielniak E, et al. Incidence and time trends of soft tissue sarcomas in German children 1985–2004 – A report from the population‐based German Childhood Cancer Registry. Eur J Cancer 2008; 44: 432–40. [DOI] [PubMed] [Google Scholar]
- 7. Crist W, Gehan EA, Ragab AH, Dickman PS, Donaldson SS, Fryer C, et al. The third intergroup rhabdomyosarcoma study. J Clin Oncol 1995; 13: 610–30. [DOI] [PubMed] [Google Scholar]
- 8. Maurer HM, Gehan EA, Beltangady M, Crist W, Dickman PS, Donaldson SS, et al. The intergroup rhabdomyosarcoma study‐II. Cancer 1993; 71: 1904–22. [DOI] [PubMed] [Google Scholar]
- 9. Koscielniak E, Harms D, Henze G, Jürgens H, Gadner H, Herbst M, et al. Results of treatment for soft tissue sarcoma in childhood and adolescence: a final report of the German Cooperative Soft Tissue Sarcoma Study CWS‐86. J Clin Oncol 1999; 17: 3706–19. [DOI] [PubMed] [Google Scholar]
- 10. Stevens MCG. Treatment for childhood rhabdomyosarcoma: the cost of cure. Lancet Oncol 2005; 6: 77–84. [DOI] [PubMed] [Google Scholar]
- 11. Newton WA, Gehan EA, Webber BL, Marsden HB, van Unnik AJM, Hamoudi AB, et al. Classification of rhabdomyosarcomas and related sarcomas. Pathologic aspects and proposal for a new classification‐an intergroup rhabdomyosarcoma study. Cancer 1995; 76: 1073–85. [DOI] [PubMed] [Google Scholar]
- 12. Crist WM, Anderson JR, Meza JL, Fryer C, Raney RB, Ruymann FB, et al. Intergroup rhabdomyosarcoma study‐IV: results for patients with nonmetastatic disease. J Clin Oncol 2001; 19: 3091–102. [DOI] [PubMed] [Google Scholar]
- 13. Gustafsson G, Kogner P, Heyman M. Childhood Cancer Incidence and Survival in Sweden 1984–2010. Report 2013 from the Swedish Childhood Cancer Registry [Internet], Stockholm: Childhood Cancer Epidemiology Research Group, Karolinska Institute, 2013. Available from: http://www.cceg.ki.se/documents/ChildhoodCancerIncidenceandSurvivalinSweden1984_2010.pdf. (accessed on 26 Mar 2014). [Google Scholar]
- 14. Statistiska Centralbyrån . [Internet] Stockholm: Statistiska Centralbyrån; Folkmängden efter region, civilstånd, ålder och kön. År 1968–2012. Available from: http://www.scb.se/Pages/SSD/SSD_SelectVariables.aspx?id=340487&px_tableid=ssd_extern:BefolkningNy&rxid=44b38369-e605-4e10-b177-fc8addc84cd2. (accessed on 19 Oct 2013). [Google Scholar]
- 15. IBM Corp . IBM SPSS Statistics for Windows, Version 20.0. Armonk, NY: IBM Corp, Released 2011. [Google Scholar]
- 16. Dantonello TM, Int‐Veen C, Harms D, Leuschner I, Schmidt BF, Herbst M, et al. Cooperative trial CWS‐91 for localized soft tissue sarcoma in children, adolescents, and young adults. J Clin Oncol 2009; 27: 1446–55. [DOI] [PubMed] [Google Scholar]
- 17. Klingebiel T, Boos J, Beske F, Hallmen E, Int‐Veen C, Dantonello T, et al. Treatment of children with metastatic soft tissue sarcoma with oral maintenance compared to high dose chemotherapy: report of the HD CWS‐96 trial. Pediatr Blood Cancer 2008; 50: 739–45. [DOI] [PubMed] [Google Scholar]
- 18. Joshi D, Anderson JR, Paidas C, Breneman J, Parham D m, Crist W. Age is an independent prognostic factor in rhabdomyosarcoma: a report from the soft tissue sarcoma committee of the children's oncology group. Pediatr Blood Cancer 2004; 42: 64–73. [DOI] [PubMed] [Google Scholar]
- 19. Stiller CA, Kroll ME, Pritchard‐Jones K. Population survival from childhood cancer in Britain during 1978–2005 by eras of entry to clinical trials. Ann Oncol 2012; 23: 2464–9. [DOI] [PubMed] [Google Scholar]
- 20. Meza JL, Anderson J, Pappo AS, Meyer WH. Analysis of prognostic factors in patients with nonmetastatic rhabdomyosarcoma treated on intergroup rhabdomyosarcoma studies III and IV: the Children's Oncology Group. J Clin Oncol 2006; 24: 3844–51. [DOI] [PubMed] [Google Scholar]
- 21. Breneman JC, Lyden E, Pappo AS, Link MP, Anderson JR, Parham DM, et al. Prognostic factors and clinical outcomes in children and adolescents with metastatic rhabdomyosarcoma—a report from the intergroup rhabdomyosarcoma study IV. J Clin Oncol 2003; 21: 78–84. [DOI] [PubMed] [Google Scholar]
- 22. Oberlin O, Rey A, Lyden E, Bisogno G, Stevens MCG, Meyer WH, et al. Prognostic factors in metastatic rhabdomyosarcomas: results of a pooled analysis from United States and European cooperative groups. J Clin Oncol 2008; 26: 2384–9. [DOI] [PMC free article] [PubMed] [Google Scholar]