

ABSTRACT
Heritable connective tissue diseases are a highly heterogeneous family of over 200 disorders that affect the extracellular matrix. While the genetic basis of several disorders is established, the etiology has not been discovered for a large portion of patients, likely due to rare yet undiscovered disease genes. By performing trio‐exome sequencing of a 55‐year‐old male proband presenting with multiple symptoms indicative of a connective disorder, we identified a heterozygous missense alteration in exon 1 of the Elastin Microfibril Interfacer 1 (EMILIN1) gene, c.64G>A (p.A22T). The proband presented with ascending and descending aortic aneurysms, bilateral lower leg and foot sensorimotor peripheral neuropathy, arthropathy, and increased skin elasticity. Sanger sequencing confirmed that the EMILIN1 alteration, which maps around the signal peptide cleavage site, segregated with disease in the affected proband, mother, and son. The impaired secretion of EMILIN‐1 in cells transfected with the mutant p.A22T coincided with abnormal protein accumulation within the endoplasmic reticulum. In skin biopsy of the proband, we detected less EMILIN‐1 with disorganized and abnormal coarse fibrils, aggregated deposits underneath the epidermis basal lamina, and dermal cells apoptosis. These findings collectively suggest that EMILIN1 may represent a new disease gene associated with an autosomal‐dominant connective tissue disorder.
Keywords: EMILIN‐1, connective tissue, neuropathy, diagnostic exome sequencing, autosomal dominant
Introduction
Heritable disorders of connective tissue comprises a family of genetically determined diseases caused by mutations in genes encoding extracellular matrix (ECM) proteins and these alterations dramatically affect the mechanical properties of connective tissues, which leads to dysfunction of critical properties such as elasticity of the skin, heart, large blood vessels and joints, and motility of the gastrointestinal tract. For instance, mutations in fibrillin genes are associated with Marfan syndrome (MFS) and congenital contractural arachnodactyly [Dietz et al., 1991; Lee et al., 1991; Putnam et al., 1995]. Microfibrils are 10–12 nm diameter connective tissue components that are formed by complex interactions among a number of proteins, including fibrillins, latent TGF‐β‐binding proteins, microfibril‐associated glycoproteins, and fibulins. Microfibril composition determines tissue‐specific functions [Sakai et al., 1986; Gibson et al., 1989; Sakai et al., 1991; Jensen et al., 2001] and microfibrils are found alone or associated with elastin [Kielty et al., 2002]. Microfibrils and elastic fibers reflect the mechanical demands of individual organ systems. In elastic tissues such as the lung, skin, and large blood vessels, microfibrils provide structural integrity and elastic resilience. Microfibrils regulate the assembly of elastic fibers by providing the template that guides elastin deposition during organogenesis [Cleary and Gibson, 1983]. In addition to their structural role, microfibril constituents control bioavailability and activity of various cytokines, including TGF‐β and BMPs [Ramirez and Rifkin, 2009]. The marfanoid habitus is primarily associated with MFS. However, a number of syndromes have features of the marfanoid habitus, but have neither ectopia lentis nor any of the cardiovascular features associated with MFS. Some of these syndromes have characteristic skeletal morphologies. Clinicians often find diagnosis of these conditions challenging because of overlapping symptoms and the broad spectrum of physical findings. Further, the penetrance of these features is variable and not all features are required to suggest the presence of the marfanoid habitus [Loeys et al., 2010]. The elastin microfibrillar interface‐located protein (EMILIN‐1; OMIM #130660) is a member of the EMILIN/Multimerin family, which are homotrimeric glycoproteins that assemble into high molecular weight multimers [Colombatti et al., 2000; Colombatti et al., 2011]. EMILIN‐1, which is strongly expressed in tissues where resilience and elastic recoil are prominent (e.g., the cardiovascular system and connective tissue), is particularly abundant in blood vessels, skin, heart, lung, kidney, and cornea [Colombatti et al., 1985; Zacchigna et al., 2006]. Its deposition precedes the appearance of elastin and is simultaneous with that of fibrillin‐1 [Zanetti et al., 2004]. EMILIN‐1 associates with elastic fibers and microfibrils in blood vessels and is implicated in elastogenesis, blood pressure control, and in the regulation of vessel assembly. Further, EMILIN‐1 is thought to contribute to the cell number and size of smooth muscle cells in arterial walls and it also acts as an adhesive ligand for α4β1 integrin, which binds to the cell surface vascular cell adhesion molecule‐1 on activated endothelium and to the ECM molecule, fibronectin [Colombatti et al., 2011]. EMILIN‐1 also regulates TGF‐β1, a growth factor and key regulator of blood vessel development and maintenance [Zacchigna et al., 2006].
Mice homozygous for disruption of Emilin1 display no gross abnormalities [Zanetti et al., 2004; Zacchigna et al., 2006; Danussi et al., 2008; Danussi et al., 2011]; however, histological and ultrastructural defects in the skin and aorta of such mice are observed. Not only do they show abnormal formation of elastic fibers and altered cell morphology, but they also exhibit defects in the anchorage of endothelial and smooth muscle cells to elastic lamellae [Zanetti et al., 2004]. Further, Emilin1‐/‐ mice display systemic arterial hypertension, they exhibit increased peripheral vascular resistance, and they demonstrate a striking reduction in the diameter of isolated second‐branch mesenteric arteries [Zacchigna et al., 2006]. Structural and functional defects of the lymphatic vessels are also observed in Emilin1‐deficient mice [Danussi et al., 2008]. Dermal/epidermal hyperproliferation and accelerated wound closure implicate Emilin1 in skin homeostasis [Danussi et al., 2011].
Since its inception as a clinical test in 2011, diagnostic exome sequencing or DES has rapidly gained acceptance by the medical community. This technology has transformed the field of medical genetics through its ability to pinpoint rare and difficult‐to‐detect genetic lesions. Moreover, it has allowed thousands of patients who had previously undergone a battery of invasive, expensive, and uninformative tests to finally receive a definitive diagnosis for their symptoms [Yang et al., 2013; Farwell et al., 2014; Iglesias et al., 2014; Lee et al., 2014; Soden et al., 2014; Srivastava et al., 2014; Yang et al., 2014].
Herein, we report the successful application of DES to identify the genetic lesion in a family suffering from an undiagnosed connective tissue disorder. We reveal that it is a heterozygous missense mutation in the signal peptide cleavage site of EMILIN1 and demonstrate the causative nature of this mutation by characterizing its functional consequences, both in vitro and in vivo.
Materials and Methods
DNA samples from the family of a patient with hereditary connective tissue disease seen in the Genetics clinic of the of NorthShore Research Institute, Northwestern University (Evanston, IL) were referred to Ambry Genetics (Aliso Viejo, CA) for DES. The Research Institute does not consider case reports (n = 1) to meet the federal definition of “research.” Thus, there was no need to obtain IRB approval as long as the study focused on one patient for the clinic tests for biopsy as long as the patient agreed. The proband is 55‐year‐old male with a history of two separate aortic aneurysms (ascending aorta and descending aorta) without evidence of dissection; left lower lobe bronchiectasis; “friable” connective tissue noted during multiple surgeries; bilateral lower leg and foot neuropathy; sensorimotor peripheral neuropathy with both axonal and demyelinating features (no evidence for myopathic disorder); and low‐grade inflammatory arthropathy that was initially diagnosed as possible psoriatic arthritis without dermatologic involvement (Fig. 1). Surgical history included multiple arthroscopic knee procedures, lumbar spine fusions, and rotator cuff and tendon repairs and revisions. Physical examination focused on investigating features suggestive of previously characterized autosomal‐dominant connective tissue syndromes such as MFS, Loeys‐Dietz syndrome (LDS), and Ehlers Danlos syndrome (EDS) (hypermobility, classical, and vascular subtypes). These conditions have a high degree of variability and the underlying genetic etiology is not known for some of these syndromes; thus, clinical criteria were relied upon to establish a potential diagnosis and guidance for genetic testing.
Figure 1.
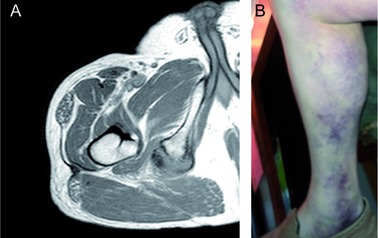
Clinical images of the proband. A: MRI of right femur demonstrates complete avulsion of the conjoined semitendinous and long biceps femoris tendons from the ischial tuberosity. B: Ecchymosis related to right hamstring tendon tear.
His personal history of aortic aneurysms was suggestive of MFS; however, he did not meet the revised diagnostic criteria for MFS; specifically, his aortic aneurysms did not appear to involve the aortic root per imaging reports and he did not satisfy the other criteria.
Features suggestive of LDS were examined since our proband had aortic aneurysms beyond the aortic root. The majority of patients with LDS exhibit distinct features such as arterial tortuosity, bifid uvula, widely spaced eyes and craniosynostosis in its most severe phenotype. However, some patients have milder external features that can overlap with features of vascular EDS including velvety, translucent skin with atrophic scarring. Our proband did exhibit increased skin elasticity on the dorsum of the hands but lacked the other dermatologic findings suggestive of LDS or vascular EDS including atrophic scarring and unusual translucency to the skin [Loeys et al., 2006]. We also considered classic and hypermobile EDS in our differential as a portion of patients with these two conditions will have aortic enlargement without apparent progression to dissection [Wenstrup et al., 2002]. Although our proband had hypermobility involving the small joints, hips, winging of his scapula (clavicles present), and his personal history is notable for numerous tendon ruptures requiring multiple revisions and repairs, he had a normal Beighton score (even by history) and did not have widened atrophic scars consistent with classical EDS [Beighton et al., 1998]. Given his normal Beighton score and lack of other sequela, he did not fulfill criteria hypermobility EDS.
Prior genetic testing, which included PMP22, GJB1, MPZ, EGR2, NEFL, PRX, GDAP1, LITAF, MFN2, and myotonic dystrophy, was all reported as normal (CTG repeat sizes were 11 and 13).
The proband's mother has a history of bilateral lower extremity and foot neuropathy (upper extremities reportedly unaffected), pes planus, easy bruising, and decreased clotting. The proband's son has a history of degenerative joint disease, right foot neuropathy, and pes cavus. Both mother and son have no reported history of aortic aneurysms. Family history was unremarkable for other stigmata of a connective tissue disorder, with the exception of a maternal uncle who died at the age of 63, reportedly from a spontaneous bowel rupture. Since the proband did not meet clinical criteria for any of these syndromes and the possibility of an autosomal‐dominant hereditary neuropathy in the family, the team felt the most cost‐effective approach to possibly confirm one or more diagnoses was with a clinical whole exome. Samples from the unaffected father and daughter were also referred to Ambry Genetics for analysis.
Genomic Analyses and Data Processing
Exome library preparation, sequencing, bioinformatics, and data analysis were performed as previously described [Butterfield et al., 2014; Farwell et al., 2014; Gandomi et al., 2014; Lee et al., 2014; Soden et al., 2014; Farwell Gonzalez et al., 2015]. Briefly, samples were prepared using the SureSelect Target Enrichment System (Agilent Technologies, Santa Clara, CA) [Gnirke et al., 2009] and sequenced using paired‐end, 100‐cycle chemistry on the Illumina HiSeq 2000 (Illumina, San Diego, CA). The sequence data were aligned to the reference human genome (GRCh37) and variant calls were generated using CASAVA and Pindel [Ye et al., 2009]. Stepwise filtering included the removal of common SNPs, intergenic and 3’/5’ UTR variants, nonsplice‐related intronic variants, and lastly synonymous variants. Variants were then filtered further based on family history and possible inheritance models. Data are annotated with the Ambry Variant Analyzer tool (AVA) [LaDuca et al., 2014].
Identified candidate alterations were confirmed using automated fluorescence dideoxy sequencing. Cosegregation analysis was performed using the proband, his parents, and his son and daughter. Amplification primers were designed using PrimerZ [Guenther et al., 2009]. PCR primers were tagged with established sequencing primers on the 5′ end. Sequencing was performed on an ABI3730 (Life Technologies, Carlsbad, CA) using standard procedures.
Preparation of His‐Tagged Wild‐Type EMILIN‐1 and p.A22T‐EMILIN‐1 Expression Plasmids
Step 1: Insertion of a C‐Terminal 6xHIS Tag
A first PCR reaction utilizing a forward oligonucleotide primer (TGGCCGGCTCAGTGACAGTGCTG) and a reverse primer containing the HIS‐tag coding sequence and the NotI restriction site (ATAGTTTAGCGGCCGCCTAATGGTGATGGTGATGATGCGCGTGTTCAAGCTCTGGGTCCCCATAG) was performed. The plasmid pcCEP‐Pu/AC7 containing the human EMILIN1 (NM_007046.3) cDNA sequence was used as a template [Mongiat et al., 2000]. Note that cDNA numbering was used as previously reported [Doliana et al., 1999]; nucleotide numbering +1 corresponds to A of the ATG translation initiation codon in the reference sequence. The amplification product was gel purified (Geneclean Turbo Kit, MP) and digested with SacII and Not I enzymes.
Step 2: Insertion of EMILIN1 Native SP Sequence
Native EMILIN1 SP sequence was obtained by performing RT‐PCR on RNA extracted from human SK‐LMS‐1 cells (ATCC). The first‐strand DNA was synthesized from this RNA according to standard protocols and using the RT2 first strand kit (Quiagen, Hilden, Germany). The PCR reaction was performed using a forward primer containing the NheI restriction site (ATAAGAATGCTAGCAAGGAAACTGGGACGGACGG), and a reverse primer (AGGCGGGAGGCCAAGCTGGTGTAG). The amplification product was gel purified and digested with the NheI and SacII enzymes.
Step 3: Generation of the c.64G>A (p.A22T) Mutation in the EMILIN1 Native SP Sequence
The c.64G>A codon mutation within the N‐terminal fragment of EMILIN1 was generated by site‐directed mutagenesis using the overlapping PCR approach. Briefly, in a first PCR, the primers carrying the desired mutation (bold and underlined: forward CAGCTGCAGGGGCCACCAGCTACCCTCCTCGAGGTTTC; reverse: GAAACCTCGAGAAGGGTAGCTGG>TGGCCCCTGCAGCTG) were used in combination with 5′‐ and 3′‐flanking primers (see Step 2) to generate two overlapping sequences. The overlapping fragments were gel purified and used as templates in a two‐step PCR consisting of 12 elongation cycles in which the overlapping region worked; subsequently, 25 amplification cycles were performed utilizing the 5′‐ and 3′‐flanking primers. The mutated N‐terminal fragment was gel purified and digested with the enzymes NheI and SacII.
Step 4: Cloning in pCDNA 3.1 Expression Vector
The recombinant N‐terminal wild‐type (WT)/64G>A and C‐terminal fragments were cloned into the expression vector pCDNA 3.1 (Invitrogen, Milan, Italy) at the NheI and NotI sites usingT4 DNA Ligase kit (New England Biolabs, Euroclone, Milan, Italy). All constructs were confirmed by DNA sequencing.
Cell Culture and Transfection
Human HEK293 and mouse NIH/3T3 cells were cultured in Dulbecco's modified Eagle's medium containing 10% fetal bovine serum (FBS; GIBCO, Milan, Italy), 4500 mg/l glucose, and antibiotics. HEK293 cells were transiently transfected with plasmids containing WT and p.A22T mutant EMILIN1 sequences using FuGENE HD Transfection Reagent (Promega, Madison, WI) as per the manufacturer's instructions. NIH3T3 cells were stably transfected with plasmids containing WT and p.A22T mutant EMILIN1 sequences using FuGENE HD Transfection Reagent. Transfected NIH3T3 cells were maintained under continuous puromycin selection (bulk cultures) and used for experiments after at least six passages.
Generation of EMILIN‐1 Mutated Signal Peptides Fused to a Reporter Gene, Cell Transfection, and Analysis
The TurboLuc vector [Mezzanotte et al., 2014], expressing a dual reporter gene resulting from the fusion between luciferase and the red fluorescent protein TurboFP635, was modified inserting a linker coding for the p.A22T or WT sequence of the EMILIN‐1 signal peptide with the NheI recognition site (5‐GCTAGCCGCCACCATGGCCCCCCGCACCCTCTGGAGCTGCTACCTCTGCTGCCTGCTGACGGCAGCTGCAGGGGCCRCCAGCAGGCTAGC‐3), with R meaning G or A and the NheI recognition sites underlined. The linker was ligated in the NheI restriction site of TurboLuc vector, in frame with the N‐terminal end of the luciferase‐coding sequence. The ligation products were transformed in DH5 strain, and the resulting clones selected for sense insertion and WT or mutated nucleotide presence by Sanger sequencing. Two clones coding for WT EMILIN‐1 signal peptide (WTSP‐TurboLuc) or p.A22T mutated EMILIN‐1 signal peptide (A22TSP‐TurboLuc) were obtained.
WTSP‐TurboLuc or p.A22TSP‐TurboLuc were transfected in HEK293 cells by FuGENE HD Transfection Reagent (Promega), together with the pRL Renilla luciferase control reporter vector (Promega) for luciferase assay normalization. After 48 hr, analysis of fluorescence signal from cells seeded on cover glass was done by a Leica TCS SP2 confocal microscope system (Leica Microsystem, Heidelberg, Mannheim, Germany). For bioluminescence analysis, cells and conditioned medium were analyzed by dual‐luciferase reporter assay (Promega) and detected in a computer‐interfaced Infinite M1000PRO microplate reader (Tecan Italia Srl, Milan, Italy).
Secretion Assay and Immunoblot Analysis
HEK293 cell lysates and conditioned serum‐free media were collected 48 hr post‐transfection. Cells were harvested and lysed by vortexing for 15 sec in cold HNTG buffer (1% Triton X‐100, 20 mM HEPES pH 7.5, 10% glycerol, 150 mM NaCl) containing a protease inhibitors cocktail (Roche, Milan, Italy) and 1 mM sodium orthovanadate followed by incubation on ice for 20 min and centrifugation for 30 min at 16,000g at 4°C. Harvested culture medium was cleared of detached cells and debris by centrifugation for 2 min at 1,500g and secreted proteins were precipitated by trichloroacetic acid. The total protein concentration of the extracts was determined by the Biorad Protein Assay Kit (Bio‐Rad, Milan, Italy), and equal protein amounts were confirmed by tubulin detection in whole‐cell lysates. Proteins were resolved in 4%–20% Criterion Precast Gels (Bio‐Rad). Following electrophoresis, proteins were transferred from gels onto Hybond‐ECL nitrocellulose membranes (GE Healthcare, Milan, Italy). Membranes were blocked with 5% dry milk in Tris‐buffered saline Tween‐20 and were then probed with anti‐His mouse monoclonal antibody (Abgent, San Diego, CA) (1:1,000) and with mouse antitubulin monoclonal antibody (Sigma, Milan, Italy) (1:3,000). A peroxydase‐conjugated secondary antibody (sheep antimouse) was purchased from GE Healthcare and blots were developed using ECL (Western blotting detection; Amersham Biosciences, Milan, Italy) and analyzed using ChemiDoc Touch Imaging System (Bio‐Rad).
For quantitative analysis of the ratio of secreted to intracellular mutant EMILIN‐1 protein, the amount of EMILIN‐1 detected in the conditioned medium was divided by the amount of intracellular EMILIN‐1 normalized with tubulin. Densitometric analysis was performed on low‐exposure images using the Image Lab software (Bio‐Rad). Each quantitation was performed in triplicate and graphically represented using Excel. The extracellular to intracellular ratios of mutant EMILIN‐1 obtained from cells transfected with the mutant were also expressed relative to the ratio obtained from cells transfected with the WT EMILIN‐1.
Primary Fibroblast Cultures from Human Skin Punch Biopsy
Biopsies were collected in sterile RPMI medium, washed in PBS in a Petri dish, cut into small fragments, and transferred to a flask. Tissue pieces were let to adhere to the plastic surface and then RPMI medium with 20% FBS medium was added. Fibroblasts started to grow from the minced fragments in 2–3 days.
Immunofluorescence Staining
Cells
Stably transfected NIH/3T3 cells were grown on glass coverslips in 6‐well culture plates and analyzed by immunofluorescence after 6 days of culture. Cells were fixed in 4% paraformaldehyde (PFA) in PBS for 15 min at RT, saturated with BSA 1% in PBS for 1 hr, and permeabilized with 0.4% Triton X‐100 in PBS for 5 min. Cells were incubated overnight at 4°C with anti‐EMILIN‐1 antibodies (rabbit polyclonal AS 556; mouse monoclonal 1H2; rat monoclonal 1007C11A8) [Danussi et al., 2011] and antiendoplasmic reticulum (ER) markers (Bip/GRP78, AB 21685 and PDI; Abcam (Cambridge, UK); mAb(1D3) ADI‐SPA 891; Enzo Life Sciences (3V Chimica, Rome, Italy)) in PBS containing 0.1% BSA. Coverslips were washed with three changes of PBS and incubated with secondary antibodies for 1 hr at RT; multiple staining was performed using a combination of differently conjugated secondary antibodies: Alexa Fluor 488, Alexa Fluor 568, and Alexa Fluor 633 (Molecular Probes, Invitrogen, Milan, Italy) at a dilution of 1:200 in PBS containing 0.1% BSA. Finally, cells were washed with three changes of PBS and coverslips mounted onto glass slides using Mowiol with 2.5% DABCO. Nuclear staining was performed using TO‐PRO (Invitrogen) at a dilution of 1:5,000. Images were acquired with a Leica TCS SP2 confocal microscope system (Leica Microsystem). The series obtained were then processed with the Volocity 3D image analysis software (Perkin Elmer, Waltham, MA).
Cryostat sections
A skin‐punch biopsy was obtained from the proband after obtaining consent. The biopsy was excised and processed, embedded in Optimal Cutting Temperature compound (Kaltek, Padua, Italy), snap frozen, and stored at −80°C. Cryostat sections of 7 μm were air dried at room temperature and kept at −80°C wrapped in aluminum foil. For immunofluorescence staining, the sections were equilibrated at room temperature, hydrated with PBS for 5 min, and fixed with PBS 4% PFA for 15 min. They were then permeabilized with 0.4% Triton X‐100 in PBS for 5 min and saturated with blocking buffer (PBS, 1% BSA) for 1 hr. The primary antibodies (anti‐EMILIN‐1) were then added (overnight incubation at 4°C). The secondary antibody incubation was performed for 1 hr at RT; nuclei were visualized with TO‐PRO. Images were acquired and examined as described above.
RNA Isolation and qRT‐PCR
Total RNA for PCR analysis was extracted from skin punch biopsy cryosections with the Trizol® reagent (Invitrogen); reverse transcription was performed using AMV–RT and exanucleotides (Promega). Real‐time PCRs were performed with iQ SYBR® green Supermix (Bio‐Rad) using the following oligonucleotides: BIP, 5′‐TGTTCAACCAATTATCAGCAAACTCAAGAGGCGAACACACAAC‐3′ and 5′‐TTCTGCTGTATCCTCTTCACCAG ‐3′; CHOP, 5′‐AGAACCAGGAAACGGAAACAGA‐3′and 5′‐TCTCCTTCATGCGCTGCTTT‐3′; beta‐actin, 5′‐AGAAAATCTGGCACCACAAA‐3′, and 5′‐AGAGGCGTACAGGGATAGCA‐3′. The primer efficiency was about 100%, thus the comparative Ct method (2–ΔΔCt) was applied for the analyses.
N‐Terminal Sequence Determination
For the N‐terminal determination, the full‐length WT and p.A22T EMILIN1 cDNAs were cloned in pCEPu vector and were transfected in HEK293 cells. The secreted recombinant proteins were purified from medium as previously described [Mongiat et al., 2000]. The purified proteins were run in a SDS gel and transferred on PVD membranes. The N‐terminal sequence was determined by Edman degradation at PrimmBiotech (Milan, Italy).
TUNEL Assay
In situ TUNEL staining for apoptotic cells was performed on frozen skin sections. Briefly, cryostat sections were fixed in 4% PFA, permeabilized with 0.1% Triton X‐100 in sodium citrate, and stained using the “In situ Cell Death Detection Kit” (Roche Applied Sciences, Milan, Italy) according to the manufacturer's instructions. Nuclear staining was performed with propidium iodide (Molecular Probes).
Statistical Analyses
Plotted values are shown as means ± standard error (SEM). Statistical significance of the results was determined by using the two‐tailed unpaired Student's t‐test to determine whether two datasets were significantly different. A value of P < 0.05 was considered significant.
Results
Identification of the Proband Mutation
Exome sequencing of the family trio (proband, mother, and father) resulted in an average of ∼14 Gb of sequence per sample (Fig. 2A; Table 1). Mean coverage of captured regions was 125x per sample, with >90% of bases covered at least 10x. An average of 89% of bases had a base call quality of Q30 or greater, and the overall average mean quality score was >Q35. Stepwise filtering for the removal of common SNPs, intergenic and 3’/5’ UTR variants, nonsplice‐related intronic variants, and synonymous variants resulted in ∼12,000 variants per sample (Table 2). Family history inheritance model filtering based on autosomal‐ and X‐linked‐dominant and recessive models, and Y‐linked inheritance models of the proband, mother and father revealed 79 candidate genes (84 unique alterations; Table 3). Manual review of each alteration to rule out sequencing artifacts and polymorphisms, along with medical interpretation to rule out genes lacking clinical overlap with the patient's evaluated phenotype, resulted in 48 candidate genes (50 unique alterations) (Supp. Table S1). From these, one variant in a notable gene with potential clinical relevance underwent confirmation and cosegregation analysis using automated fluorescence dideoxy sequencing: a heterozygous missense alteration (c.64G>A, p.A22T) in the Elastin Microfibril Interfacer 1 (EMILIN1) gene (NM_007046.3) (Fig. 2B). The variant data have been submitted to ClinVar (http://www.ncbi.nlm.nih.gov/clinvar/).
Figure 2.
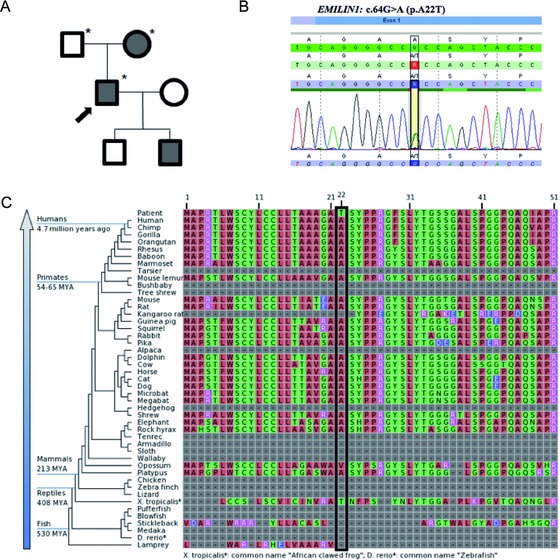
The EMILIN1 c.64G>A (p.A22T) mutation cosegregates with disease in the family and occurs at a conserved residue. A: Familial pedigree. Shaded shapes indicate affected individuals. Asterisk (*) indicates whole‐exome sequencing performed. B: Electropherogram of the c.64G>A (p.A22T) alteration in the proband. C: EMILIN‐1 protein sequence alignments showing the conservation of p.A22 across vertebrates.
Table 1.
Hiseq Sequencing Run Metrics
| Proband | Father | Mother | Average | |
|---|---|---|---|---|
| Yield (Gb) | 9.032 | 19.546 | 14.504 | 14.361 |
| Quality | ||||
| % of ≥Q30 bases (PF) | 92.23 | 87.935 | 87.725 | 89.297 |
| Mean quality score (PF) | 35.985 | 34.86 | 34.795 | 35.213 |
| Base coverage | ||||
| %Base_1x (%) | 96.21 | 96.42 | 96.10 | 96.24 |
| %Base_4x (%) | 93.77 | 94.28 | 93.74 | 93.93 |
| %Base_5x (%) | 92.67 | 93.35 | 92.72 | 92.91 |
| %Base_10x (%) | 91.14 | 92.07 | 91.32 | 91.51 |
| %Base_20x (%) | 86.59 | 88.30 | 87.22 | 87.37 |
| %Base_50x (%) | 73.06 | 78.03 | 75.18 | 75.42 |
| %Base_100x (%) | 46.34 | 57.80 | 50.49 | 51.54 |
| Mean_coverage (%) | 112.08 | 142.18 | 120.63 | 124.96 |
Table 2.
Bioinformatics Variant Filtering
| Stepwise filteringa | Proband | Father | Mother | Average |
|---|---|---|---|---|
| No. of variants in coding regionsb | 111.658 | 113.572 | 110.048 | 111.759 |
| No. of postremoval of intergenic and 3′5′ UTR variants | 80.814 | 82.071 | 79.926 | 80.937 |
| No. of postremoval of nonsplice‐related intronicc variants | 22.333 | 22.418 | 22.454 | 22.402 |
| No. of postremoval of synonymous variants | 11.793 | 11.922 | 11.818 | 11.844 |
Stepwise filtering protects variants annotated within the Human Gene Mutation Database (HGMD) and/or the Online Mendelian Inheritance in Man (OMIM) databases.
Variants refer to single‐nucleotide alterations, insertions, deletions, and indels with at least 10x base pair coverage.
Intronic refers to >3 bp into the introns.
Table 3.
Variant Filtering Based on Inheritance Model and Interpretation
| Manual reviewa | ||||
|---|---|---|---|---|
| Inheritance model filtering | Characterized genes | Novel genes | Candidate genesb | |
| Autosomal‐dominant genes (alterations) | 71 (73) | 2 (2) | 36 (36) | 1 (1) |
| Autosomal‐recessive genes (alterations) | 4 (7) | 0 (0) | 2 (3) | 0 (0) |
| X‐linked recessive genes (alterations) | 2 (2) | 0 (0) | 0 (0) | 0 (0) |
| X‐linked‐dominant genes (alterations) | 2 (2) | 0 (0) | 0 (0) | 0 (0) |
| Y‐linked genes (alterations) | 0 (0) | 0 (0) | 0 (0) | 0 (0) |
| Total genes (alterations) | 79 (84) | 2 (2) | 39 (39) | 1 (1) |
Manual filtering includes the removal of variants in genes unrelated to the patient's evaluated phenotype and alterations considered benign by bioinformatics analysis.
Candidate Genes: genes with disease phenotype association overlapping that of the proband.
The p.A22T alteration is located in coding exon 1 of the EMILIN1 gene. The Ala 22 amino acid is conserved throughout recent vertebrates (Fig. 2C). In support of its pathogenicity, the alteration was not observed among 6,362 healthy individuals tested in the NHLBI Exome Sequencing Project (ESP) (The International HapMap Project, 2003). The alteration was observed in two alleles from European individuals among 55,976 total alleles (3.573e‐05 allele frequency), which are not uncommon for alterations associated with adult‐onset, and/or reduced‐penetrance alleles [Cooper et al., 2013]. Sequencing and cosegregation analyses using automated fluorescence dideoxy sequencing confirmed the presence of the alteration in the proband, affected mother, and affected son, but not in the proband's unaffected father and daughter (Table 4). The EMILIN1 gene was covered with an average of ∼60x coverage with all exons covered with at least 71% at 10x (Supp. Table S2). Upon retrospective review of all filtered variants detected in the EMILIN1 gene, no other significant alterations were identified (Supp. Table S3).
Table 4.
Familial Cosegregation Analysis Results
| Genotype | |||||||||
|---|---|---|---|---|---|---|---|---|---|
| Gene | Protein | RefSeq ID | Alteration | Exon # | Proband | Father | Mother | Son | Daughter |
| EMILIN1 | Elastin microfibril interfacer 1 | NM_007046 | c.64G>A (p.A22T) | CDS 1 | +/− | −/− | +/− | +/− | −/− |
In Vitro Functional Effects of the p.A22T Substitution
The mutation is predicted to substitute Thr for a conserved Ala residue (p.A22T) corresponding to the first residue of the predicted mature EMILIN‐1 [Doliana et al., 1999]. In transiently transfected cells, it is difficult to reliably assess the expression of EMILIN‐1 because of variable transfection efficiency, as evidenced by the extent of variation in the nine independent transfections (see Fig. 3A). Nevertheless, we noticed a statistically significant reduction (P < 0.05) in the amount of EMILIN‐1 secreted by HEK293 cells transfected with the mutant p.A22T in all the nine independent transfections, as compared with the amount secreted by cells transfected with the WT (WT) EMILIN‐1 (Fig. 3A and B). Collectively, the efficiency of secretion in WT transfected cells was about fourfold greater compared with that of mutant cells. Furthermore, the finding that the protein secreted from the cells transfected with the mutant p.A22T migrated with an apparent molecular mass in SDS‐PAGE similar to the protein secreted by WT transfected cells suggested that the post‐translational modification, that is, primarily glycosylation, was not affected in the secreted molecules.
Figure 3.
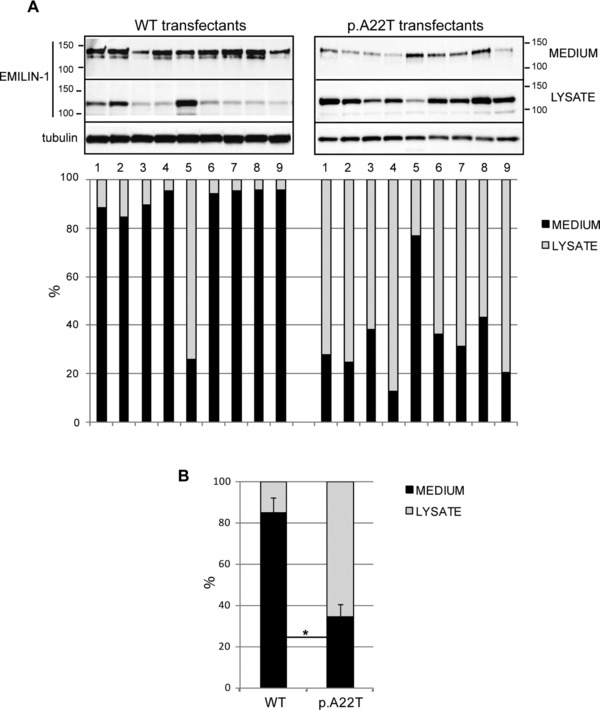
The p.A22T mutation inhibits EMILIN‐1 secretion. A (upper): Western blotting analysis of secreted (medium) or intracellular (lysate) EMILIN‐1‐6X His produced by HEK293 cells transiently transfected with WT (WT) or p.A22T EMILIN‐1‐6X His. Nine independently transfected cell populations for each condition were loaded. A (lower): Graphic representation of the quantitative extracellular (medium) or intracellular (lysate) levels of EMILIN‐1‐6X His on the basis of densitometric analysis of the blots. Densitometric analysis was performed on linear range exposure images. The amount of EMILIN‐1‐6X His detected in the medium was divided by the amount of intracellular EMILIN‐1‐6X His normalized with tubulin and expressed as percentage. B: Graphic representation of the mean values of the secreted to the intracellular EMILIN‐1‐6X His. Collectively, the data show that in cells transfected with the mutant p.A22T; EMILIN‐1‐6X His was present in the medium at consistently lower levels than in cells transfected with the WT protein; in contrast there was more EMILIN‐1‐6X His in the cell lysates of p.A22T‐transfected cells and these differences achieved statistical significance. *P < 0.05. EMILIN‐1 fused to a C‐terminal 6X‐His tag was detected using a mouse anti‐6X His antibody.
The intracellular processing of newly synthesized proteins involves interactions with a variety of molecular chaperones and folding enzymes that normally reside in the ER. To investigate whether cells transfected with the mutant p.A22T vector retained EMILIN‐1 within the ER, as shown for other mutants of the signal peptide, we performed dual immunofluorescent labeling of ER markers and EMILIN‐1. To mimic the proband's heterozygotic condition where both mutant and WT EMILIN‐1 are synthesized, murine fibroblast NIH3T3 cells, which express endogenous EMILIN‐1, were transfected with WT or p.A22T vectors. Cells were selected by puromycin and the bulk cultures were examined for deposition of EMILIN‐1.
Both the chaperone proteins BIP and PDI were localized intracellularly to the ER at moderate levels in cells transfected with WT EMILIN‐1 (Fig. 4A, C, and E); in contrast, in cells transfected with the mutant p.A22T, chaperone levels were increased and the proteins were present within enlarged ER vesicles (Fig. 4B, D, and F, white arrows). The enlarged compartments were also positive for EMILIN‐1 staining, which is consistent with the accumulation of EMILIN‐1 in the secretory pathway (Fig. 4B, D, and F).
Figure 4.
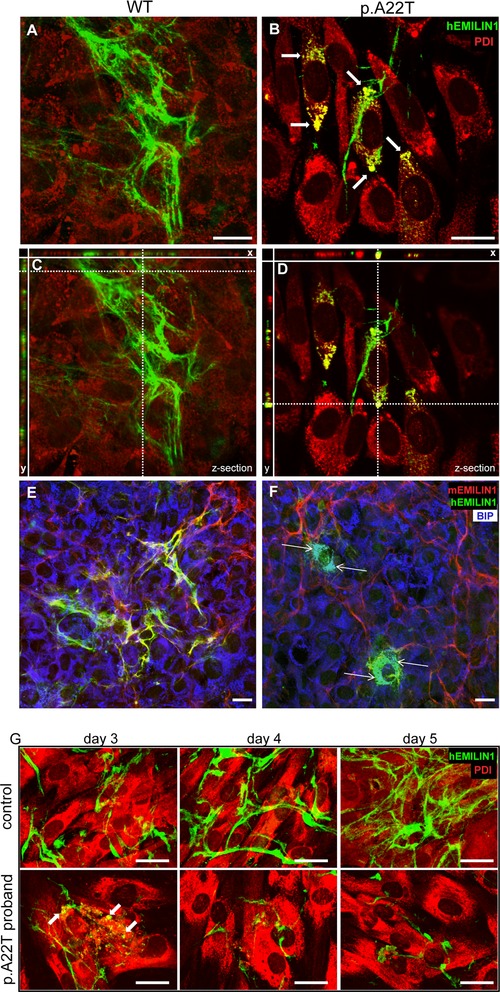
Retention within the ER and reduced extracellular deposition of EMILIN‐1 in EMILIN‐1‐p.A22T‐6X His stably transfected cells and in proband fibroblasts. The transfected NIH/3T3 cells were coimmunostained after permeabilization with anti‐PDI (A–D, red) or anti‐BIP (E and F, blue) as ER markers, antihuman EMILIN‐1 (A–F, green), and antimurine EMILIN‐1 (E and F, red) antibodies. The images from coimmunostaining analyses are derived by confocal microscopy at different focal planes. The mutant p.A22T‐transfected samples (B) show several cells with retention of EMILIN‐1 compared with WT‐transfected cells (A). The extent and intensity of extracellularly deposited EMILIN‐1 fluorescence is higher in WT‐transfected cells compared with p.A22T‐transfected cells; C and D are Z‐sections of A and B, respectively, showing the transfected NIH/3T3 cells and the corresponding x and y projections showed a clear colabeling of PDI (yellow, thick arrows) or BIP (white, thin arrows) and anti‐EMILIN‐1 antibody only in cells transfected with the mutant p.A22T. In E, endogenous murine EMILIN‐1 coaligns in the ECM with the transfected human WT EMILIN‐1 (yellow signal). In F, the transfected p.A22T EMILIN‐1 is quite totally retained intracellularly and no association with murine EMILIN‐1 could be detected (absence of yellow signal). Note in B the presence of enlarged vesicles with clear colocalization with hEMILIN‐1. G: Human fibroblasts were isolated from skin biopsies and cultured in vitro for several days to detect EMILIN‐1 deposition. Cells were fixed and stained with anti‐EMILIN‐1 (green) and anti PDI (red) antibodies. Fibroblasts from p.A22T proband were unable to produce a fibrillar well‐organized ECM network. EMILIN‐1 retention within ER was visible only in mutant fibroblasts (white arrows). Bar = 20 μm.
Whereas WT EMILIN‐1‐transfected cells showed an abundant and nicely organized extracellular network, the p.A22T‐transfected cells displayed lower amounts of deposited EMILIN‐1 and a much less organized network. Note that by using an antibody specific for murine EMILIN‐1 (mAb 1007C11A8), the ECM of NIH3T3 cells transfected with WT human sequence was positively decorated by coexpression of the endogenous murine EMILIN‐1 along with human EMILIN‐1. A similar pattern of extracellular deposition was detected in human fibroblast cultures of an age‐matched control subject, whereas in fibroblasts of the proband very little EMILIN‐1 was secreted. Furthermore, also in the proband's culture, EMILIN‐1 colocalized with PDI (Fig 4G). Although the lower secretion of EMILIN‐1 and the accumulation within the ER by both transfected cell as well as the proband's fibroblasts, some EMILIN‐1 was secreted.
According to the predicted signal peptide cleavage site [Doliana et al., 1999], the Ala or Thr in position 22 is the first residue of the WT or the proband mutated mature EMILIN‐1, respectively, with possible consequences on the assembly and/or function of the protein once secreted. To experimentally confirm this important issue, we produced the WT and p.A22T mutated full‐length EMILIN‐1 in an eukaryotic system. The true N‐terminus was determined by an external company using the Edman degradation approach (data not shown). The initial four residues sequenced were TSYP for the WT EMILIN‐1 and ASYP for the p.A22T EMILIN‐1, confirming the predicted cleavage site and that the mature forms of WT and mutant EMILIN‐1 present a different N‐terminus.
To verify the influence of the p.A22T mutation on the signal peptide processing in eukaryotic cells, we fused the WT and the mutated form of the signal peptide to the dual reporter Luciferase‐TurboFP635 fusion protein, in order to trace the trafficking of the reporter construct inside the cells by fluorescence signal and to measure its secretion efficiency by luciferase activity. As shown in Figure 5, the WT construct appears evenly distributed in the cytoplasm, whereas the p.A22T construct is rather accumulated in big aggregates (white arrows). Also, the secretion of the mutated form was delayed as suggested by an increased intracellular retention and a decreased luciferase activity in the medium (Fig. 5).
Figure 5.
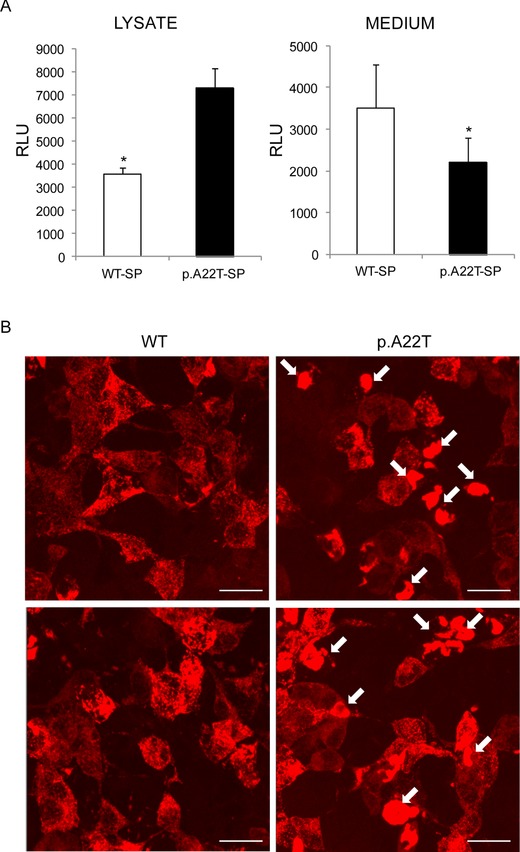
WTSP‐TurboLuc and p.A22TSP‐TurboLuc expression in HEK293 cells. A: Firefly luciferase activity from TurboLuc fusion constructs in cell lysates (left) and in cell culture media (right). Light emission was measured with HEK293 cells transfected with WTSP‐TurboLuc or p.A22TSP‐Turboluc. Results obtained from three individual transfections are shown. Relative light units are shown as per second, per 5 μg total protein (left), and per 50 μL medium (right). *P < 0.05. B: Visualization of intracellular TurboFP635 localization, on cells seeded on coverslips and transfected with WTSP‐TurboLuc (left) or p.A22TSP‐TurboLuc (right). Two representative fields for each condition are shown. White arrows indicate cytoplasmic aggregates. Bar = 20 μm.
Functional Consequences of the p.A22T Substitution in the Proband Skin
Given the fact that so many of the proband's organs are affected, including skin, and given the functional defects associated with the p.A22T substitution in vitro, we investigated the expression of EMILIN‐1 in the dermis of the affected proband. We observed that it was reduced compared with the skin of an age‐matched individual (Fig. 6A and B). In the papillary dermis of the p.A22T proband, EMILIN‐1 staining revealed the presence of thick and long fibers (thick arrows) oriented perpendicularly toward the basal lamina. Positively stained aggregates/deposits were clearly evident in the enlarged view (Fig. 6b; arrowheads), as well as in the 3D reconstruction (Fig. 6b′). In the deep/reticular dermis, EMILIN‐1‐positive fibers were sparse and fragmented. In contrast, in an age‐matched individual, EMILIN‐1 stained a network of fine and well‐branched fibers (Fig. 6a, thin arrows) with no evidence of aggregates/deposits.
Figure 6.
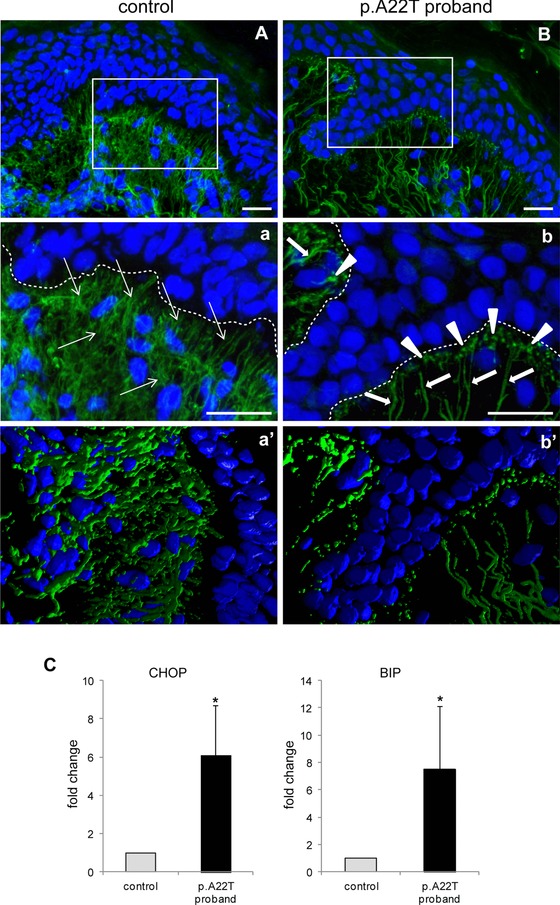
Altered extracellular deposition of EMILIN‐1 in the proband's skin. Representative images of EMILIN‐1 staining in the skin of a control age‐matched individual (A) and in the p.A22T proband (B). Panels a and b are zoomed images of the boxed areas in A and B, respectively; a′ and b′ are 3D reconstructions. Nuclei were counterstained with TO‐PRO (pseudocoloured in blue). Thick and long EMILIN‐1‐positive fibers (green and pointed out by thick white arrows) that are oriented perpendicularly toward the basal lamina are evident in the p.A22T proband skin papillary dermis. Staining also shows coarse and interrupted fibers in the deep/reticular dermis. Underneath the basal lamina (indicated as dotted lines in a and b) white arrowheads indicate dots‐stained positive for EMILIN‐1, suggesting the presence of fiber aggregates. A finer and more branched staining is detected in the control age‐matched individual (thin white arrows). Bar = 20 μm. C: CHOP (left) and BIP (right) expression by qRT‐PCR normalized with β‐actin from three independent extract preparations of normal and proband's skin biopsies. *P < 0.05.
To quantitatively determine the upregulation of markers of ER stress, we then investigated by qRT‐PCR the expression of BIP and CHOP in tissue slices of the skin biopsies. We found a significant increase of the mRNA for both markers in the proband's sample compared with the unaffected control (Fig. 6C).
Finally, we determined the extent of apoptosis by TUNEL staining. Control skin showed almost no sign of apoptosis in the dermis; however, elevated apoptosis was evident in the dermis of the proband's skin (Fig. 7).
Figure 7.
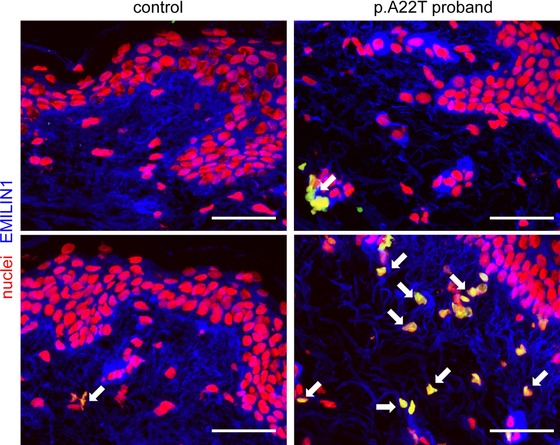
Increased apoptosis in the proband's skin. Representative micrographs of cryostat sections from proband's skin biopsy. TUNEL staining (green) was used to detect apoptotic cells (colocalized as yellow signal and pointed out by white arrows). Nuclei were counterstained with propidium iodide (red). EMILIN‐1 was pseudocoloured in blue. The p.A22T proband's skin displays numerous apoptotic cells in the deep/reticular dermis, which are quite totally absent in the specimen taken from the control age‐matched individual. Bar = 50 μm.
Discussion
Herein, we describe the identification of a mutation in the signal peptide cleavage site of EMILIN‐1, as detected by whole‐exome sequencing. The NHLBI ESP reports several homozygous loss‐of‐function EMILIN‐1 alleles, suggesting that loss‐of‐function is not likely the gene's mutational mechanism. The proband and his relatives exhibited heterozygosity for the mutant EMILIN‐1 allele and the p.A22T substitution in EMILIN‐1 affected multiple organ systems. A computer algorithm used for predicting the signal peptidase cleavage site of human EMILIN‐1 (SignalP 3.0 server; http://www.cbs.dtu.dk) indicated that either Ala or Thr were acceptable at the +1 position. This variant is predicted to be deleterious by SIFT in silico analysis at http://sift.jcvi.org platform. Ala in position 22 was predicted to be the first residue of the mature EMILIN‐1 [Doliana et al., 1999]. This prediction was here confirmed by the N‐terminal residue determination with Edman degradation that indicated that the WT EMILIN‐1 has an Ala at position +1 and the mutant p.A22T EMILIN‐1 has a Thr at position +1.
Signal peptides are responsible for numerous functions, including recognition and binding of the nascent proteins to the cytosolic signal recognition particle, insertion of the protein into the ER, and further protein maturation processes such as quality control and addition of N‐linked sugars. The signal peptide in secreted proteins comprises a central hydrophobic core usually flanked on its C‐terminal side by a charged residue, followed by the signal peptidase cleavage site [Martoglio and Dobberstein, 1998; von Heijne, 1990]. Most signal peptide mutations affect the hydrophobic core and result in defective targeting to the ER, which in turn results in failed protein translocation [Seppen et al., 1996; Hughes et al., 2000; Pidasheva et al., 2005; Symoens et al., 2009; Hussain et al., 2013]. Mutations affecting the signal peptidase cleavage sites that produce significant clinical effects are relatively rare. Nevertheless, examples of such pathological mutations include a bleeding disorder linked to Factor X Santo Domingo [Racchi et al., 1993] and diabetes insipidus caused by an Ala to Thr change in preprovasopressin [Ito et al., 1993]. Missense mutations that alter Gly to either Asp or Arg at the −1 position in collagen X prevent the mutant chains from forming trimers with normal chains and thereby cause Schmid metaphyseal chondrodysplasia [Chan et al., 2001]. Mutations affecting the signal peptide region of RANK (Receptor Activator of Nuclear Factor‐kappaB) [Hughes et al., 2000] and BMP1 (Bone Morphogenic Protein 1) [Asharani et al., 2012] have been reported to cause familial expansile osteolysis and a high‐density form of osteogenesis imperfecta, respectively. A mutation at +1 of the propeptide cleavage site of protein C [Dodojacek et al., 2000] results to be symptomatic. Interestingly, in our proband, the mutated EMILIN1 presents the same substitution Ala to Thr in position +1 of the mature protein.
Signal peptide cleavage site mutations can occasionally exist without a functional consequence, because (a) the signal peptide is efficiently cleaved at an alternative site, or (b) the mutation itself generates an optimal alternative site. However, this does not seem to be the case for EMILIN‐1. Mutant p.A22T EMILIN‐1 expressed in two different cell lines showed secretion to be significantly impaired compared with cells transfected with WT type EMILIN‐1. It is likely that a fraction of mutant p.A22T EMILIN‐1 that entered the ER was inefficiently cleaved by the signal peptidase and thus could not undergo proper intracellular trafficking and accumulated into the ER. Accordingly, impaired cleavage was in fact demonstrated here. The net consequence was a reduction in the deposition of mutated EMILIN‐1 into the ECM in vitro, which resulted in the abnormal phenotype, and a similar pattern was detected also in cultured fibroblasts of the proband. The phenotype of the proband's dermis was even more dramatic. Not only were the levels of EMILIN‐1 in the ECM reduced, but also the organization of the fibrils was altered. That is, the fibrils were abnormally coarse, their organization was disrupted, and their growth was dysfunctional and characterized by aggregated deposits under the epidermis basal lamina. While these features are slightly reminiscent of the alterations detected in elastic fibers of defective aortic valves of Emilin1 null mice [Munjal et al., 2014], we have not detected valvular defects by echocardiography in the proband nor in his relatives.
Generally, the extracellular consequences of mutations in ECM constituents are protein deficiency and compromised function, both of which account for molecular pathology [Bateman et al., 2009]. However, often there is partial or complete cellular retention and/or degradation of mutant proteins that might result in ER stress [Boot‐Handford and Briggs, 2010]. We suggest that the p.A22T signal peptide mutation leads to decreased efficiency of processing and release from the ER membrane and affects the cotranslational processes that are required for optimal folding. Our data strongly support p.A22T as a disease‐causing mutation.
In addition to EMILIN‐1, PDI and BIP were also localized and present at elevated levels within enlarged ER vesicles in NIH/3T3 cells and proband's fibroblasts, suggesting that they may play a role in the cellular retention of mutant EMILIN‐1. In this study, we could not determine whether the aberrant ER inclusions are a direct consequence of chaperone‐mediated retention or are otherwise due to selective intracellular protein interactions, as shown for mutant COMP in PSACH [Vranka et al., 2001]. BIP and PDI most likely function as molecular chaperones in the protein folding process, and may serve as retention anchors within the quality control system of the secretory pathways. Misfolded and/or incompletely assembled proteins are retained within the ER and subsequently targeted for degradation with or without cell damage. Here, it is apparent that mutant EMILIN‐1 caused cellular apoptosis in vivo. Whether the apoptosis detected in the proband dermal fibroblasts was the direct consequence of the ER stress remains to be determined.
Although EMILIN‐1 is a quantitatively minor ECM protein, it is widely distributed in a variety of tissues such as skin, vessels, lung, kidney, intestine, and cornea and plays an important role in elastin deposition [Zanetti et al., 2004], blood pressure [Zacchigna et al., 2006], cell proliferation [Danussi et al., 2011], and the correct development of the lymphatic system [Danussi et al., 2008; Danussi et al., 2013]. Intrafamilial variability in disease severity can be striking as seen in this family: the affected proband had a “full‐blown” phenotype with a high degree of functional impairment, whereas the affected relatives showed mild impairment, and no overt aneurisms. The EMILIN1‐induced pathology is certainly dependent upon the genetic context, that is, the p.A22T substitution in combination with environmental factors such as hemodynamic stress and/or other factors likely promoted progressive loss of residual function, as seen in the proband. At present, we cannot rule out a contributing influence of other genes in affecting the higher or lower severity of the phenotype.
In conclusion, our results demonstrate that impaired secretion of mutant p.A22T causes abnormal accumulation of EMILIN‐1 within the ER, which is likely to alter normal cell function(s) and ultimately leads to a compromised ECM and cellular apoptosis. Moreover, our results strongly suggest that EMILIN1 is a new disease gene associated with autosomal‐dominant connective tissue disease.
Electronic‐Database Information
Accession numbers and URLs for data in this article are as follows: ESP[Internet]: Exome Variant Server, NHLBI GO Exome Sequencing Project (ESP), Seattle, WA (URL: http://evs.gs.washington.edu/EVS/) [(July, 2013)], ClinVar (URL: http://www.ncbi.nlm.nih.gov/clinvar/).
Supporting information
Disclaimer: Supplementary materials have been peer‐reviewed but not copyedited.
Table S1. Summary of genotype and bioinformatics data from non‐candidate alterations remaining post‐filtering by inheritance model and manual filteringa
Table S2. Summary of the EMILIN1 exome sequencing coverage for the proband
Table S3. Filtered EMILIN1 alterations detected via exome sequencing
Acknowledgments
We are grateful to the proband and his family for their participation. We thank Dr. Laura Mezzanotte and Eric Kaijzel for kindly providing the TurboLuc vector.
Disclosure statement: The authors have no conflict of interest to declare.
Contract grant sponsor: AIRC (Associazione Italiana per la Ricerca sul Cancro) grant (IG 13126).
Communicated by Raymond Dalgleish
References
- Asharani PV, Keupp K, Semler O, Wang W, Li Y, Thiele H, Yigit G, Pohl E, Becker J, Frommolt P, Sonntag C, Altmuller J, et al. 2012. Attenuated BMP1 function compromises osteogenesis, leading to bone fragility in humans and zebrafish. Am J Hum Genet 90:661–674. [DOI] [PMC free article] [PubMed] [Google Scholar]
- Bateman JF, Boot‐Handford RP, Lamande SR. 2009. Genetic diseases of connective tissues: cellular and extracellular effects of ECM mutations. Nat Rev Genet 10:173–183. [DOI] [PubMed] [Google Scholar]
- Beighton P, De PA, Steinmann B, Tsipouras P, Wenstrup RJ. 1998. Ehlers‐Danlos syndromes: revised nosology, Villefranche, 1997. Ehlers‐Danlos National Foundation (USA) and Ehlers‐Danlos Support Group (UK). Am J Med Genet 77:31–37. [DOI] [PubMed] [Google Scholar]
- Boot‐Handford RP, Briggs MD. 2010. The unfolded protein response and its relevance to connective tissue diseases. Cell Tissue Res 339:197–211. [DOI] [PMC free article] [PubMed] [Google Scholar]
- Butterfield RJ, Stevenson TJ, Xing L, Newcomb TM, Nelson B, Zeng W, Li X, Lu HM, Lu H, Farwell Gonzalez KD, Wei JP, Chao EC, et al. 2014. Congenital lethal motor neuron disease with a novel defect in ribosome biogenesis. Neurology 82:1322–1330. [DOI] [PMC free article] [PubMed] [Google Scholar]
- Chan D, Ho MS, Cheah KS. 2001. Aberrant signal peptide cleavage of collagen X in Schmid metaphyseal chondrodysplasia. Implications for the molecular basis of the disease. J Biol Chem 276:7992–7997. [DOI] [PubMed] [Google Scholar]
- Cleary EG, Gibson MA. 1983. Elastin‐associated microfibrils and microfibrillar proteins. Int Rev Connect Tissue Res 10:97–209. [DOI] [PubMed] [Google Scholar]
- Colombatti A, Bressan GM, Castellani I, Volpin D. 1985. Glycoprotein 115, a glycoprotein isolated from chick blood vessels, is widely distributed in connective tissue. J Cell Biol 100:18–26. [DOI] [PMC free article] [PubMed] [Google Scholar]
- Colombatti A, Doliana R, Bot S, Canton A, Mongiat M, Mungiguerra G, Paron‐Cilli S, Spessotto P. 2000. The EMILIN protein family. Matrix Biol 19:289–301. [DOI] [PubMed] [Google Scholar]
- Colombatti A, Spessotto P, Doliana R, Mongiat M, Bressan GM, Esposito G. 2011. The EMILIN/Multimerin family. Front Immunol 2:93. [DOI] [PMC free article] [PubMed] [Google Scholar]
- Cooper DN, Krawczak M, Polychronakos C, Tyler‐Smith C, Kehrer‐Sawatzki H. 2013. Where genotype is not predictive of phenotype: towards an understanding of the molecular basis of reduced penetrance in human inherited disease. Hum Genet 132:1077–1130. [DOI] [PMC free article] [PubMed] [Google Scholar]
- Danussi C, Del Bel BL, Pivetta E, Modica TM, Muro A, Wassermann B, Doliana R, Sabatelli P, Colombatti A, Spessotto P. 2013. EMILIN1/α9β1 integrin interaction is crucial in lymphatic valve formation and maintenance. Mol Cell Biol 33:4381–4394. [DOI] [PMC free article] [PubMed] [Google Scholar]
- Danussi C, Petrucco A, Wassermann B, Pivetta E, Modica TM, Belluz LB, Colombatti A, Spessotto P. 2011. EMILIN1‐α4/α9 integrin interaction inhibits dermal fibroblast and keratinocyte proliferation. J Cell Biol 195:131–145. [DOI] [PMC free article] [PubMed] [Google Scholar]
- Danussi C, Spessotto P, Petrucco A, Wassermann B, Sabatelli P, Montesi M, Doliana R, Bressan GM, Colombatti A. 2008. Emilin1 deficiency causes structural and functional defects of lymphatic vasculature. Mol Cell Biol 28:4026–4039. [DOI] [PMC free article] [PubMed] [Google Scholar]
- Dietz HC, Cutting GR, Pyeritz RE, Maslen CL, Sakai LY, Corson GM, Puffenberger EG, Hamosh A, Nanthakumar EJ, Curristin SM. 1991. Marfan syndrome caused by a recurrent de novo missense mutation in the fibrillin gene. Nature 352:337–339. [DOI] [PubMed] [Google Scholar]
- Dodojacek R, Hofler G, Leschnik B, Muntean W. 2000. A novel type of mutation at the propeptide cleavage site (AlA+1Thr) causing symptomatic protein C type II deficiency. Thromb Res 100:109–113. [DOI] [PubMed] [Google Scholar]
- Doliana R, Mongiat M, Bucciotti F, Giacomello E, Deutzmann R, Volpin D, Bressan GM, Colombatti A. 1999. EMILIN, a component of the elastic fiber and a new member of the C1q/tumor necrosis factor superfamily of proteins. J Biol Chem 274:16773–16781. [DOI] [PubMed] [Google Scholar]
- Farwell Gonzalez KD, Li X, Lu HM, Lu H, Pellegrino JE, Miller RT, Zeng W, Chao EC. 2015. Diagnostic exome sequencing and tailored bioinformatics of the parents of a deceased child with cobalamin deficiency suggests digenic inheritance of the MTR and LMBRD1 genes. JIMD Rep 15:29–37. [DOI] [PMC free article] [PubMed] [Google Scholar]
- Farwell KD, Shahmirzadi L, El‐Khechen D, Powis Z, Chao EC, Davis BT, Baxter RM, Zeng W, Mroske C, Parra MC, Gandomi SK, Lu I, et al. 2014. Enhanced utility of family‐centered diagnostic exome sequencing with inheritance model‐based analysis: results from 500 unselected families with undiagnosed genetic conditions. Genet Med 17:578–586. [DOI] [PubMed] [Google Scholar]
- Gandomi SK, Farwell Gonzalez KD, Parra M, Shahmirzadi L, Mancuso J, Pichurin P, Temme R, Dugan S, Zeng W, Tang S. 2014. Diagnostic exome sequencing identifies two novel IQSEC2 mutations associated with X‐linked intellectual disability with seizures: implications for genetic counseling and clinical diagnosis. J Genet Couns 23:289–298. [DOI] [PubMed] [Google Scholar]
- Gibson MA, Kumaratilake JS, Cleary EG. 1989. The protein components of the 12‐nanometer microfibrils of elastic and nonelastic tissues. J Biol Chem 264:4590–4598. [PubMed] [Google Scholar]
- Gnirke A, Melnikov A, Maguire J, Rogov P, LeProust EM, Brockman W, Fennell T, Giannoukos G, Fisher S, Russ C, Gabriel S, Jaffe DB, et al. 2009. Solution hybrid selection with ultra‐long oligonucleotides for massively parallel targeted sequencing. Nat Biotechnol 27:182–189. [DOI] [PMC free article] [PubMed] [Google Scholar]
- Guenther UP, Handoko L, Laggerbauer B, Jablonka S, Chari A, Alzheimer M, Ohmer J, Plottner O, Gehring N, Sickmann A, von AK, Schuelke M, et al. 2009. IGHMBP2 is a ribosome‐associated helicase inactive in the neuromuscular disorder distal SMA type 1 (DSMA1). Hum Mol Genet 18:1288–1300. [DOI] [PubMed] [Google Scholar]
- Hughes AE, Ralston SH, Marken J, Bell C, MacPherson H, Wallace RG, van HW, Whyte MP, Nakatsuka K, Hovy L, Anderson DM. 2000. Mutations in TNFRSF11A, affecting the signal peptide of RANK, cause familial expansile osteolysis. Nat Genet 24:45–48. [DOI] [PubMed] [Google Scholar]
- Hussain S, Mohd AJ, Jalaludin MY, Harun F. 2013. Permanent neonatal diabetes due to a novel insulin signal peptide mutation. Pediatr Diabetes 14:299–303. [DOI] [PMC free article] [PubMed] [Google Scholar]
- Iglesias A, Anyane‐Yeboa K, Wynn J, Wilson A, Truitt CM, Guzman E, Sisson R, Egan C, Chung WK. 2014. The usefulness of whole‐exome sequencing in routine clinical practice. Genet Med 16:922–931. [DOI] [PubMed] [Google Scholar]
- Ito M, Oiso Y, Murase T, Kondo K, Saito H, Chinzei T, Racchi M, Lively MO. 1993. Possible involvement of inefficient cleavage of preprovasopressin by signal peptidase as a cause for familial central diabetes insipidus. J Clin Invest 91:2565–2571. [DOI] [PMC free article] [PubMed] [Google Scholar]
- Jensen SA, Reinhardt DP, Gibson MA, Weiss AS. 2001. Protein interaction studies of MAGP‐1 with tropoelastin and fibrillin‐1. J Biol Chem 276:39661–39666. [DOI] [PubMed] [Google Scholar]
- Kielty CM, Sherratt MJ, Shuttleworth CA. 2002. Elastic fibres. J Cell Sci 115:2817–2828. [DOI] [PubMed] [Google Scholar]
- LaDuca H, Stuenkel AJ, Dolinsky JS, Keiles S, Tandy S, Pesaran T, Chen E, Gau CL, Palmaer E, Shoaepour K, Shah D, Speare V, et al. 2014. Utilization of multigene panels in hereditary cancer predisposition testing: analysis of more than 2,000 patients. Genet Med 16:830–837. [DOI] [PMC free article] [PubMed] [Google Scholar]
- Lee B, Godfrey M, Vitale E, Hori H, Mattei MG, Sarfarazi M, Tsipouras P, Ramirez F, Hollister DW. 1991. Linkage of Marfan syndrome and a phenotypically related disorder to two different fibrillin genes. Nature 352:330–334. [DOI] [PubMed] [Google Scholar]
- Lee H, Deignan JL, Dorrani N, Strom SP, Kantarci S, Quintero‐Rivera F, Das K, Toy T, Harry B, Yourshaw M, Fox M, Fogel BL, et al. 2014. Clinical exome sequencing for genetic identification of rare Mendelian disorders. JAMA 312:1880–1887. [DOI] [PMC free article] [PubMed] [Google Scholar]
- Loeys BL, Dietz HC, Braverman AC, Callewaert BL, De BJ, Devereux RB, Hilhorst‐Hofstee Y, Jondeau G, Faivre L, Milewicz DM, Pyeritz RE, Sponseller PD, et al. 2010. The revised Ghent nosology for the Marfan syndrome. J Med Genet 47:476–485. [DOI] [PubMed] [Google Scholar]
- Loeys BL, Schwarze U, Holm T, Callewaert BL, Thomas GH, Pannu H, De Backer JF, Oswald GL, Symoens S, Manouvrier S, Roberts AE, Faravelli F, et al. 2006. Aneurysm syndromes caused by mutations in the TGF‐beta receptor. N Engl J Med 355:788–798. [DOI] [PubMed] [Google Scholar]
- Martoglio B, Dobberstein B. 1998. Signal sequences: more than just greasy peptides. Trends Cell Biol 8:410–415. [DOI] [PubMed] [Google Scholar]
- Mezzanotte L, Blankevoort V, Lowik CW, Kaijzel EL. 2014. A novel luciferase fusion protein for highly sensitive optical imaging: from single‐cell analysis to in vivo whole‐body bioluminescence imaging. Anal Bioanal Chem 406:5727–5734. [DOI] [PMC free article] [PubMed] [Google Scholar]
- Mongiat M, Mungiguerra G, Bot S, Mucignat MT, Giacomello E, Doliana R, Colombatti A. 2000. Self‐assembly and supramolecular organization of EMILIN. J Biol Chem 275:25471–25480. [DOI] [PubMed] [Google Scholar]
- Munjal C, Opoka AM, Osinska H, James JF, Bressan GM, Hinton RB. 2014. TGF‐beta mediates early angiogenesis and latent fibrosis in an Emilin1‐deficient mouse model of aortic valve disease. Dis Model Mech 7:987–996. [DOI] [PMC free article] [PubMed] [Google Scholar]
- Pidasheva S, Canaff L, Simonds WF, Marx SJ, Hendy GN. 2005. Impaired cotranslational processing of the calcium‐sensing receptor due to signal peptide missense mutations in familial hypocalciuric hypercalcemia. Hum Mol Genet 14:1679–1690. [DOI] [PubMed] [Google Scholar]
- Putnam EA, Zhang H, Ramirez F, Milewicz DM. 1995. Fibrillin‐2 (FBN2) mutations result in the Marfan‐like disorder, congenital contractural arachnodactyly. Nat Genet 11:456–458. [DOI] [PubMed] [Google Scholar]
- Racchi M, Watzke HH, High KA, Lively MO. 1993. Human coagulation factor X deficiency caused by a mutant signal peptide that blocks cleavage by signal peptidase but not targeting and translocation to the endoplasmic reticulum. J Biol Chem 268:5735–5740. [PubMed] [Google Scholar]
- Ramirez F, Rifkin DB. 2009. Extracellular microfibrils: contextual platforms for TGFbeta and BMP signaling. Curr Opin Cell Biol 21:616–622. [DOI] [PMC free article] [PubMed] [Google Scholar]
- Sakai LY, Keene DR, Engvall E. 1986. Fibrillin, a new 350‐kD glycoprotein, is a component of extracellular microfibrils. J Cell Biol 103:2499–2509. [DOI] [PMC free article] [PubMed] [Google Scholar]
- Sakai LY, Keene DR, Glanville RW, Bachinger HP. 1991. Purification and partial characterization of fibrillin, a cysteine‐rich structural component of connective tissue microfibrils. J Biol Chem 266:14763–14770. [PubMed] [Google Scholar]
- Seppen J, Steenken E, Lindhout D, Bosma PJ, Elferink RP. 1996. A mutation which disrupts the hydrophobic core of the signal peptide of bilirubin UDP‐glucuronosyltransferase, an endoplasmic reticulum membrane protein, causes Crigler‐Najjar type II. FEBS Lett 390:294–298. [DOI] [PubMed] [Google Scholar]
- Soden SE, Saunders CJ, Willig LK, Farrow EG, Smith LD, Petrikin JE, LePichon JB, Miller NA, Thiffault I, Dinwiddie DL, Twist G, Noll A, et al. 2014. Effectiveness of exome and genome sequencing guided by acuity of illness for diagnosis of neurodevelopmental disorders. Sci Transl Med 6:265ra168. [DOI] [PMC free article] [PubMed] [Google Scholar]
- Srivastava S, Cohen JS, Vernon H, Baranano K, McClellan R, Jamal L, Naidu S, Fatemi A. 2014. Clinical whole exome sequencing in child neurology practice. Ann Neurol 76:473–483. [DOI] [PubMed] [Google Scholar]
- Symoens S, Malfait F, Renard M, Andre J, Hausser I, Loeys B, Coucke P, De PA. 2009. COL5A1 signal peptide mutations interfere with protein secretion and cause classic Ehlers‐Danlos syndrome. Hum Mutat 30:E395–E403. [DOI] [PubMed] [Google Scholar]
- The International HapMap Project . 2003. The International HapMap Project. Nature 426:789–796. [DOI] [PubMed] [Google Scholar]
- von Heijne G. 1990. Protein targeting signals. Curr Opin Cell Biol 2:604–608. [DOI] [PubMed] [Google Scholar]
- Vranka J, Mokashi A, Keene DR, Tufa S, Corson G, Sussman M, Horton WA, Maddox K, Sakai L, Bachinger HP. 2001. Selective intracellular retention of extracellular matrix proteins and chaperones associated with pseudoachondroplasia. Matrix Biol 20:439–450. [DOI] [PubMed] [Google Scholar]
- Wenstrup RJ, Meyer RA, Lyle JS, Hoechstetter L, Rose PS, Levy HP, Francomano CA. 2002. Prevalence of aortic root dilation in the Ehlers‐Danlos syndrome. Genet Med 4:112–117. [DOI] [PubMed] [Google Scholar]
- Yang Y, Muzny DM, Reid JG, Bainbridge MN, Willis A, Ward PA, Braxton A, Beuten J, Xia F, Niu Z, Hardison M, Person R, et al. 2013. Clinical whole‐exome sequencing for the diagnosis of mendelian disorders. N Engl J Med 369:1502–1511. [DOI] [PMC free article] [PubMed] [Google Scholar]
- Yang Y, Muzny DM, Xia F, Niu Z, Person R, Ding Y, Ward P, Braxton A, Wang M, Buhay C, Veeraraghavan N, Hawes A, et al. 2014. Molecular findings among patients referred for clinical whole‐exome sequencing. JAMA 312:1870–1879. [DOI] [PMC free article] [PubMed] [Google Scholar]
- Ye K, Schulz MH, Long Q, Apweiler R, Ning Z. 2009. Pindel: a pattern growth approach to detect break points of large deletions and medium sized insertions from paired‐end short reads. Bioinformatics 25:2865–2871. [DOI] [PMC free article] [PubMed] [Google Scholar]
- Zacchigna L, Vecchione C, Notte A, Cordenonsi M, Dupont S, Maretto S, Cifelli G, Ferrari A, Maffei A, Fabbro C, Braghetta P, Marino G, et al. 2006. Emilin1 links TGF‐beta maturation to blood pressure homeostasis. Cell 124:929–942. [DOI] [PubMed] [Google Scholar]
- Zanetti M, Braghetta P, Sabatelli P, Mura I, Doliana R, Colombatti A, Volpin D, Bonaldo P, Bressan GM. 2004. EMILIN‐1 deficiency induces elastogenesis and vascular cell defects. Mol Cell Biol 24:638–650. [DOI] [PMC free article] [PubMed] [Google Scholar]
Associated Data
This section collects any data citations, data availability statements, or supplementary materials included in this article.
Supplementary Materials
Disclaimer: Supplementary materials have been peer‐reviewed but not copyedited.
Table S1. Summary of genotype and bioinformatics data from non‐candidate alterations remaining post‐filtering by inheritance model and manual filteringa
Table S2. Summary of the EMILIN1 exome sequencing coverage for the proband
Table S3. Filtered EMILIN1 alterations detected via exome sequencing