

Abstract
The relevance of the clinicopathological and molecular features of early gastric cancers (EGCs) having the microsatellite instability (MSI)‐high phenotype has not been clearly defined in sporadic gastric carcinogenesis. Here, we examined the clinicopathological and molecular characteristics of EGC according to MSI status in 330 patients with EGC (intestinal‐type adenocarcinoma). Tumors were classified as MSI‐high (45 cases), MSI‐low (9 cases), or microsatellite stable (MSS; 276 cases). The specimens were examined using a combination of polymerase chain reaction (PCR)‐microsatellite assays and PCR‐pyrosequencing to detect chromosomal allelic imbalances in multiple cancer‐related chromosomal loci, MSI, gene mutations (KRAS and BRAF) and methylation status [high methylation epigenome (HME), intermediate methylation epigenome and low methylation epigenome]. In addition, the expression levels of various target proteins were examined using immunohistochemistry. Interestingly, EGC with the MSI phenotype showed distinct papillary features. The expression of gastric mucin was more frequent in EGC with the MSI phenotype, while p53 overexpression was common in EGCs, irrespective of MSI status. The frequency of HME was significantly higher in EGCs with the MSI phenotype than in EGCs with the MSS phenotype. Although there was a low frequency of allelic imbalance in EGCs with the MSI phenotype, some markers of allelic imbalance were more frequently detected in EGCs with the MSI‐high phenotype than in EGCs with the MSS phenotype. KRAS and BRAF mutations were rare in EGCs. Thus, the MSI phenotype in EGC is a major precursor lesion in gastric cancer and is characterized by distinct clinicopathological and molecular features.
Keywords: allelic imbalance, early gastric cancer, microsatellite instability, methylation, papillary adenocarcinoma
Short abstract
What's new?
The relevance of the clinicopathological and molecular features of early gastric cancers with the microsatellite instability (MSI)‐high phenotype remains to be clarified in sporadic gastric carcinogenesis. This study shows that early gastric cancers with the MSI‐high phenotype exhibit distinct histological features and accumulation of both genomic damage and MSI within the same tumors. In regions with genomic damage, the frequencies of 3p and 22q AI were significantly higher in the MSI‐high phenotype than in the microsatellite stable phenotype. The treatment strategies for patients with gastric cancers having the MSI‐high phenotype may thus need to differ from patients with colorectal cancer.
Gastric cancer (GC) is one of the leading causes of cancer‐related death worldwide, especially in Japan,1 and is a major clinical problem that severely impairs the patient's quality of life and usually leads to death. Elucidation of the mechanisms mediating gastric carcinogenesis is expected to facilitate improved outcomes in patients with invasive cancer and to improve the patient's quality of life by detection of tumors or precancerous lesions as early as possible, leading to more effective treatment.
Previous studies have shown that there are two classical molecular pathways involved in the pathogenesis of colorectal cancers (CRCs) and GCs: microsatellite instability (MSI) and chromosomal instability [CIN, similar to the microsatellite stable (MSS) status].2, 3, 4, 5, 6 CRCs with the MSI phenotype (MSI‐high tumors) are characterized by mutations in the KRAS or BRAF gene, genome‐wide hypermethylation, DNA diploidy and distinct clinicopathological features, such as older age, female gender, location in the proximal colon and histology of mucinous or medullary carcinoma.2, 3, 4 However, CIN (MSS) is closely associated with an accumulation of multiple cancer‐related genes exhibiting loss of heterozygosity, as well as mutations in p53 and DNA aneuploidy.2, 3, 4 The CpG island methylation phenotype (CIMP), characterized by extensive hypermethylation of multiple CpG islands within the genome, is currently recognized as one of the major mechanisms in colorectal and gastric carcinogenesis.7, 8 Although the CIMP status has been classified into high, low and negative, CIMP‐high CRCs also have distinct clinicopathological and molecular profiles, such as older age, female gender, location in the proximal tumor, poorly differentiated or mucinous histology and high rates of MSI and BRAF mutations as compared with CIMP‐low/negative CRCs.3, 4, 5 Most of these clinicopathological and molecular features in CIMP‐high CRCs overlap with sporadic GCs having the MSI phenotype.9, 10, 11 However, it is unclear whether these overlapping clinicopathological and molecular features of CRCs also apply to GCs.
Previous studies have shown that MSI is found in 15–39% of sporadic GCs. GC with the MSI‐high phenotype is characterized by old age, antral location, differentiated type, mucinous or medullary histological patterns and reduced lymph node metastasis.12, 13 Although MSI is caused by gremlin mutations in mismatch repair genes (MLH‐1 and MSH2) in hereditary nonpolyposis colorectal cancer, MSI is closely associated with methylation of the MLH‐1 gene in sporadic GCs.12 Leung et al. showed that hypermethylation of the CpG island in the MLH‐1 promoter region was present in 100% of the sporadic MSI‐high GCs examined in their study.12 In addition, they also showed that there is a close association between MLH‐1 gene methylation and loss of MLH‐1 expression (90% of cases).12, 14 Methylation of the MLH‐1 gene has been shown to cause transcriptional silencing of some important genes, including p16, RUNX3 and E‐cadherin, suggesting that such tumors exhibit the CIMP phenotype.12, 14 Recent studies have shown that serrated lesions [in particular, sessile serrated adenoma/polyp (SSA/P)] are considered early precursor lesions of MSI‐high CRC. This pathway is characterized by distinct pathological and molecular profiles that differ from those of traditional adenoma.15, 16 SSA/P is thought to develop into cancer through the sequence of hyperplastic polyp–SSA/P–dysplasia–MSI‐high cancer.15, 16 Although serrated lesions have been recognized as precursors of MSI‐high CRCs, the clinicopathological and molecular profiles of precursor lesions in MSI‐high GCs have not been fully elucidated.
A limited number of previous studies have examined the clinicopathological and molecular findings of early GCs (EGCs) according to the MSI phenotype; most studies have focused on advanced GCs.17, 18 In addition, the clinicopathological features of patients with EGCs having the MSI phenotype and the molecular alterations acquired in EGCs having the MSI phenotype are still unclear. Thus, the aims of this study were to elucidate the clinicopathological and molecular features of EGCs having the MSI phenotype (MSI‐high EGC) and to compare the findings with the clinicopathological and molecular features of MSS or MSI‐low EGCs.
Material and Methods
Patients
We selected 330 intestinal‐type sporadic EGCs obtained from Iwate Medical University Hospital. EGCs were defined as tumors that may have invaded into the submucosa, but were confined within the submucosa, irrespective of the presence of lymph node metastases. In this study, patients with Lynch syndrome were excluded. Most of the examined EGCs were confined to the mucosa (intramucosal cancer). Tumor location and invasion were classified according to the classification of the Japanese Gastric Cancer Association.19 Tumors were classified as well‐differentiated adenocarcinoma, moderately differentiated adenocarcinoma, papillary adenocarcinoma, or mixed adenocarcinoma by histological analysis according to the modified classification of the Japanese Gastric Cancer Association. Papillary adenocarcinomas were defined as tumors having a papillary component. If characteristics of both tubular and papillary adenocarcinoma were present within the same tumor, the tumor was classified as mixed adenocarcinoma. Finally, patients with Epstein‐Barr virus‐associated EGC were not included in this study. The local ethics committees of Iwate Medical University approved the sample collection and study design and written informed consent was obtained from all patients.
Three hundred thirty matched paired gastric cancer and non‐neoplastic gastric tissues were sampled. Tissues for clinicopathological analysis were obtained from a region of the resected stomach mucosa adjacent to the region used for genetic analysis. Hematoxylin and eosin sections of the representative tissue were examined to characterize tumor features and to evaluate the percentage of tumor cells. All samples contained at least 50% tumor cells. Non‐neoplastic tissues adjacent normal tissues were isolated from a region that was a minimum of 0.5–2 cm from the primary tumor lesion.
DNA extraction
Samples were directly snap‐frozen and stored at −80°C. DNA was extracted from normal and tumor tissues by sodium dodecyl sulfate lysis and proteinase K digestion, followed by a phenol‐chloroform procedure, as reported previously.20
Immunohistochemical analysis
Sections (4 μm thick) from formalin‐fixed and paraffin‐embedded tissue blocks were analyzed using an extensive panel of immunohistochemical markers, including p53 (DO7, DAKO, Copenhagen, Denmark), MUC2 (Novocastra Laboratories, Newcastle, UK), MUC5AC (Novocastra Laboratories), MUC6 (Novocastra Laboratories), CD10 (Novocastra Laboratories) and MLH‐1 (BD Pharmingen). This immunohistochemical panel covers the markers used for evaluating gastric tumorigenesis, as described previously.20 Non‐neoplastic gastric mucosa served as a control for p53, MUC2, MUC5AC, MUC6, cdx2 and MLH‐1 staining. Only nuclear staining of p53 product was measured as positive. Overexpression of p53 was defined as positive expression in [mt]30% of cells. However, if [mt]10% of the tumor cells were immunopositive for MUC2, MUC5AC, MUC6 or CD10, tumors were considered positive for the corresponding protein. If [mt]30% of the tumor cells showed loss of expression or reduced expression of MLH‐1, the tumor was regarded as MLH‐1 negative. All immunohistochemical stains were used daily in our laboratory, and negative controls were carried out routinely using the Dako Envision system (Dako, Denmark) according to the manufacturer's instructions.
Methylation analysis and pyrosequencing for evaluation of KRAS and BRAF mutations
Pyrosequencing targeted at KRAS (codons 12 and 13) and BRAF (codon 600) was performed using a PyroMark Q24 instrument (Qiagen, Venlo, The Netherlands) according to the manufacturer's instructions.21, 22 Briefly, the polymerase chain reaction (PCR) product (25 μL) was bound to streptavidin Sepharose HP (GE Healthcare, Brøndby, Denmark), purified, washed, denatured in 0.2 M NaOH and washed again. Before pyrosequencing, 0.3 μM sequencing primer was annealed to the purified single‐stranded PCR product by heating to 80°C for 2 min.
Methylation analysis and pyrosequencing for evaluation of methylation
The DNA methylation status of each gene promoter region was established by PCR analysis of bisulfite‐modified genomic DNA (EpiTect Bisulfite Kit; Qiagen) using pyrosequencing for quantitative methylation analysis (Pyromark Q24; Qiagen NV). The primers were designed using the Pyromark Assay Designing Software package (Qiagen NV), with 3–4 CpG sites included for analysis of promoter methylation. The primers used for analysis of KRAS and BRAF mutations are described elsewhere (the primers for methylation analysis were designed and are not indicated in this study).21, 22
We quantified DNA methylation in 6 specific promoters originally described by Yagi and colleagues.23, 24 Briefly, after methylation analysis of a panel of 3 markers (RUNX3, MINT31 and LOX), high methylation epigenotype (HME) tumors were defined as those with at least 2 methylated markers. The remaining tumors were screened using 3 markers (NEUROG1, ELMO1 and THBD); intermediate methylation epigenotype (IME) tumors were defined as those with at least 2 methylated markers. Tumors not classified as HME or IME were designated as low methylation epigenotype (LME). In addition, methylation of MLH‐1 was also quantified.
The cut‐off value for the mutation assay was 15% mutant alleles, while that for the methylation assay was 30% of tumor cells.
Analysis of allelic imbalance (AI) by PCR
Allelic losses on chromosomes 1p, 3p, 4p, 5q, 8p, 9p, 13q, 17p, 18p and 22q were examined in paired tumor and normal DNA samples obtained from 330 patients with EGC using 22 highly pleomorphic microsatellite markers (D1S228, D1S548, D3S2402, D3S1234, D4S2639, D4S1601, D5S107, D5S346, D5S299, D5S82, D8S201, D8S513, D8S532, D9S171, D9S1118, D13S162, TP53, D18S487, D18S34, D22S274, D22S1140 and D22S1168). These microsatellite markers have been reported frequently in GCs and CRCs. In addition, a variable number of tandem repeat polymorphisms at the DCC locus were tested. Microsatellite sequences were obtained from specific primers reported in the Genome Database (http://gdbwww.gdb.org/gdb/). PCR and microsatellite analysis for those markers were performed as previously described.20
Determination of AI
The peaks produced by the normal DNA sample were used to determine whether the cancerous sample was homozygous (one peak) or heterozygous (two peaks). The allelic ratio was calculated as previously described.25 A tumor was considered to have AI if the allele peak ratio was ≤0.70, representing an allelic signal reduction of at least 30%. Samples were regarded as uninformative if they showed constitutional homozygosity or MSI. When AIs were observed in at least one locus, the imbalances of those loci were confirmed. The data were collected automatically and analyzed using GeneScan software (Applied Biosystems, CA) to determine the allele score and to assess the possibility of allelic loss.
Scoring of AI
AI status was scored according to the following criteria. A tumor sample was considered to be AI‐high if [mt]60% of the loci showed AI. When <30% of the loci showed AI, the tumor was designated as AI‐low. A tumor was regarded as AI‐intermediate if between 30 and 60% of loci had AI.
Analysis of MSI
Three dinucleotide repeat markers (D2S123, D5S346 and D17S250) and two adenine mononucleotide repeats (BAT25 and BAT26) were used to determine the presence of tumor MSI.26 Tumors were considered positive for MSI when a novel, abnormally sized band was present in the tumor sample as compared to the corresponding normal DNA sample. Tumors were classified as having a high level of MSI (MSI‐H) if 2 or more markers had allelic shifts, having a low level of MSI (MSI‐L) if only 1 of the 5 markers had an allelic shift, or MSS when no markers had an allelic shift.
Statistical analysis
Data obtained for histological features, immunohistochemical findings, AI of chromosomal loci, methylation status and MLH‐1 methylation based on MSI‐status were analyzed using the Kruskal‐Wallis H test with the aid of Stat Mate‐III software (Atom, Tokyo, Japan). If significant differences were found among the four groups, differences between two groups were analyzed using χ 2 tests (Stat Mate‐III software). Statistical analysis of MLH‐1 methylation and loss or reduction of MLH‐1 expression was carried out using χ 2 tests (Stat Mate‐III software) for comparisons between the two groups. Differences with p values of <0.05 were considered significant.
Results
Clinicopathological findings in patient subgroups classified according to MSI status
Forty‐five GC cases (13.6%) exhibited the MSI‐H phenotype, 9 cases (2.7%) exhibited the MSI‐L phenotype and the remaining 276 cases (83.6%) exhibited the MSS phenotype. Clinicopathological findings based on MSI status are shown in Table 1. Significant associations with the MSI‐H phenotype were found in patients with older age (p < 0.001), papillary adenocarcinoma (p < 0.01) and mixed adenocarcinoma (p < 0.001).
Table 1.
Clinicopathological findings of early gastric cancer according to MSI status
| Total (%) | MSI high (%) | MSI low (%) | MSS (%) | p Values | |
|---|---|---|---|---|---|
| Total | 330 | 45 (13.6) | 9 (2.7) | 276 (83.6) | |
| Male/Female | 244/86 | 32/13 | 5/4 | 207/69 | |
| Mean age (years) | 71.9 | 74.5 | 68.3 | 71.6 | 0.001 |
| (Range) | (45–91) | (50–91) | (45–87) | (45–89) | |
| Location | |||||
| U | 56 (17.0) | 7 (15.6) | 3 (33.3) | 46 (16.7) | |
| M | 127 (38.5) | 16 (35.6) | 4 (44.4) | 107 (38.8) | |
| L | 147 (44.5) | 22 (48.8) | 2 (22.3) | 123 (44.5) | N.S |
| Macroscopic findings | |||||
| IIa | 190 (57.6) | 28 (62.2) | 6 (66.7) | 156 (56.5) | |
| IIc | 105 (31.8) | 12 (26.7) | 2 (22.2) | 91(33.0) | |
| Mixed | 30 (9.1) | 4 (8.9) | 1(11.1) | 25 (9.1) | |
| IIb | 5(1.5) | 1(2.2) | 0(0) | 4 (1.4) | N.S |
| Histological type | |||||
| tub1 | 261(79.1) | 29 (64.4) | 6 (66.7) | 226 (81.9) | |
| tub2 | 51(15.5) | 7 (15.6) | 3 (22.3) | 41(14.9) | |
| Pap | 18 (5.4) | 9 (20.0) | 0(0) | 9 (3.2) | 0.01 |
| MA | 48 (14.5) | 22 (48.9) | 2 (22.8) | 24 (8.7) | 0.001 |
| Lymphatic invasion | |||||
| Presence | 41(12.4) | 8 (17.8) | 0(0) | 33 (12.0) | |
| Absence | 289 (87.6) | 37 (82.2) | 9(100) | 243 (88.0) | N.S |
| Venous invasion | |||||
| Presence | 8 (2.4) | 0(0) | 3 (33.3) | 5 (1.8) | |
| Absence | 322 (97.6) | 45 (100) | 6 (66.7) | 271(98.2) | N.S |
| Multiple cancer | |||||
| Presence | 55 (16.7) | 6 (13.3) | 0(0) | 49 (17.8) | |
| Absence | 275 (83.3) | 39 (86.7) | 9 (100) | 227 (82.2) | N.S |
Immunohistochemical findings in patient subgroups based on MSI status
Immunohistochemical findings in samples of EGCs having the MSI‐H, MSI‐L and MSS phenotypes are depicted in Figure 1. The gastric mucin markers MUC5AC and MUC6 exhibited significantly elevated expression in MSI‐H EGCs compared to those in MSS EGCs (p < 0.001 for MUC5AC and p < 0.001 for MUC6). The expression of CD10 was significantly more frequent in MSI‐H EGCs (2/16, 11%) than in MSS EGCs (p < 0.001). p53 overexpression and MUC2 expression were not associated with the MSI status of EGCs. The frequency of MLH‐1 expression in EGCs with the MSI‐H phenotype was significantly higher than that in EGCs with the MSI‐L and MSS phenotypes (p < 0.001 and p < 0.01, respectively).
Figure 1.
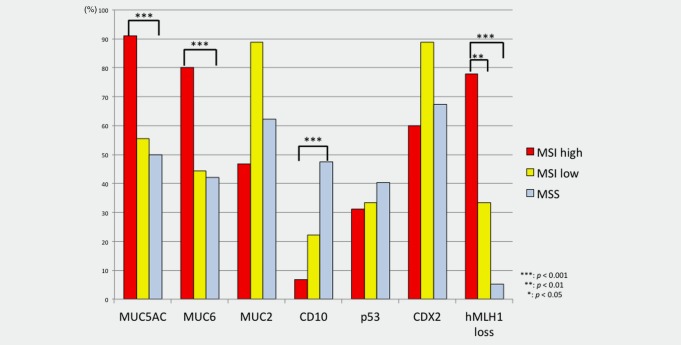
Frequencies of immunohistochemical expression of various targets in early gastric cancers according to MSI status. [Color figure can be viewed in the online issue, which is available at wileyonlinelibrary.com.]
Association of methylation status with MSI status
The association between CIMP status in MSI‐H, MSI‐L and MSS EGCs is shown in Figure 2. Although there was a significant difference in HME between MSI‐H and MSS EGCs (p < 0.001), the frequency of LME was significantly higher for MSS EGCs than for MSI‐H EGCs (p < 0.001). The frequency of IME was significantly higher in MSS EGCs than in MSI‐H EGCs (p < 0.001).
Figure 2.
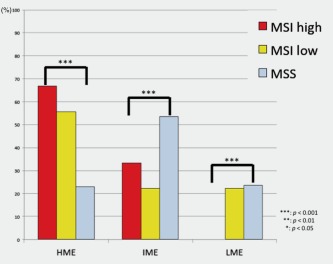
Frequencies of methylation status in early gastric cancers based on methylation status. [Color figure can be viewed in the online issue, which is available at wileyonlinelibrary.com.]
Relationship of MLH‐1 methylation with loss or reduction of MLH‐1 expression based on MSI status
The frequency of methylation of the MLH‐1 gene was significantly higher in EGCs with the MSI‐H phenotype (34/45, 75.6%) than in EGCs with the MSI‐L (0/9) or MSS (0/276) phenotype (p < 0.001 and p < 0.01, respectively). Methylation of the MLH‐1 gene (34 cases) was significantly associated with loss or reduction of MLH‐1 expression in EGCs with the MSI‐H phenotype (30/34 cases; p < 0.05). However, although the MLH‐1 gene was methylated in EGCs with the MSI phenotype, MLH‐1 protein was expressed in four EGCs with the MSI‐H phenotype. Conversely, loss or reduction of MLH‐1 protein levels was found in six EGCs with the MSI‐H phenotype. No methylation of MLH‐1 was observed in EGCs having the MSI‐L phenotype. However, only one tumor without MLH‐1 methylation was observed in EGCs having the MSI‐L phenotype. Although no methylation of the MLH‐1 gene was detected in MSS EGCs, loss or reduction of MLH‐1 protein expression was observed in 15 EGCs having the MSS phenotype.
Association between AI in cancer‐related chromosomal loci and MSI status
The AIs present at each chromosome location are shown in Figure 3. The number of chromosome arms harboring AIs varied among individuals. Interestingly, the incidence of AI in chromosomes 3p and 22q was significantly elevated in EGCs with the MSI‐H phenotype compared with EGCs with the MSS phenotype (p < 0.01). Although AIs in chromosomes 1p, 4p, 5q, 8p, 9p, 13q, 17p and 18q were more frequent in EGCs with the MSI‐H phenotype than in EGCs with the MSI‐L and MSS phenotypes, the differences were not statistically significant.
Figure 3.
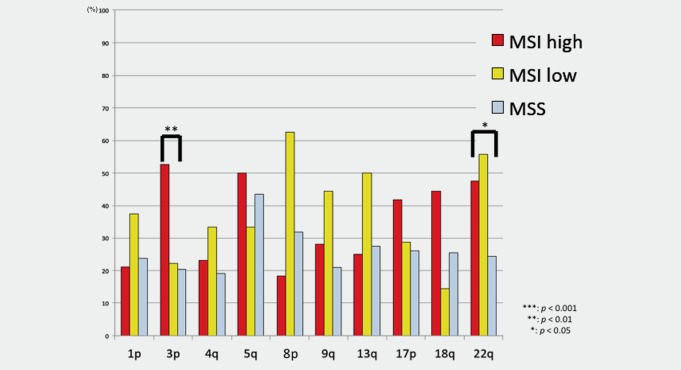
Frequencies of AI at cancer‐related loci in early gastric cancer based on MSI status. [Color figure can be viewed in the online issue, which is available at wileyonlinelibrary.com.]
The frequency of AI‐high status in MSI‐L and MSS‐EGCs was significantly higher than that in MSI‐H EGCs (p < 0.001). Additionally, the frequencies of AI‐intermediate status in EGCs with the MSI‐L and MSS phenotypes were significantly different from that in EGCs with the MSI‐H phenotype (p < 0.001 for both). Significant differences in the frequencies of AI‐low status were observed between EGCs with the MSI‐H phenotype and EGCs with the MSI‐L or MSS phenotype (p < 0.001 for both). These associations are depicted in Figure 4.
Figure 4.
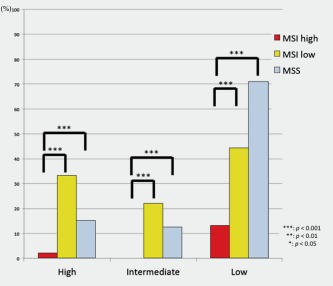
AI status in early gastric cancer based on MSI status. [Color figure can be viewed in the online issue, which is available at wileyonlinelibrary.com.]
Analysis of KRAS and BRAF mutations in EGCs with different MSI statuses
As shown in Figure 5, we next examined mutations in the KRAS and BRAF genes in 156 EGC specimens (MSI‐H, n = 45; MSI‐L, n = 9; MSS, n = 102). Mutation in KRAS (codons 12, 13 and 61) was identified in 2 of 45 EGCs with the MSI‐H phenotype and 5 of 102 EGCs with the MSS phenotype. However, no mutations in BRAF (V600E mutation) were detected in all EGCs.
Figure 5.
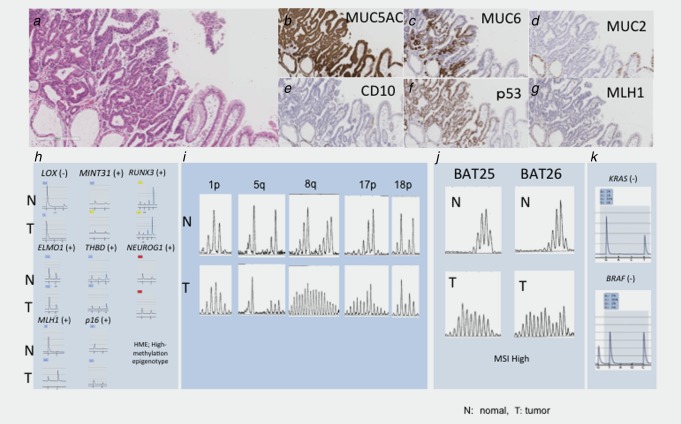
Representative case of early gastric cancer with the MSI phenotype. (a) Histological features of early gastric cancers with the MSI‐high phenotype. Papillary features were observed. (b). Positive immunostaining of MUC5AC. (c) Positive immunostaining for MUC6. (d) Negative immunostaining for MUC2. (e) Negative immunostaining for CD10. (f) Overexpression for p53. (g) Negative immunostaining for MLH‐1. (h) Analysis of methylation status. The methylation status was classified as having a high methylation epigenotype pattern. (i) Analysis of AI. A 5q AI was detected. MSI was found at 8q and 17p. (j) MSI analysis. Additional changes were observed. (k) Analysis of mutations in KRAS and BRAF. No mutations were found.
Discussion
The advantage of diagnostic pathology is that it can detect the histological or molecular characteristics of early‐stages tumors, potentially providing histological or molecular predictions of MSI at the time of diagnosis. This concept is strongly supported by the observation that MSI‐H tumors exhibit distinct tumor histology and molecular events.27, 28 In this study, we examined genetic and epigenetic pathways and markers for EGC, with the goal of preferential identifying pathways specific to EGC based on MSI status. Previous studies have shown that GCs generally exhibit high levels of MSI; however, large sample sizes were needed to reach these conclusions.29, 30 In this study, we found an MSI rate of 13.6% in 330 EGC samples from Japanese patients; this rate is consistent with those presented in previous reports.12, 30, 31, 32
Previous studies have shown that GCs having the MSI phenotype exhibit distinct clinicopathological features, such as association with distal tumor location, older age at onset and distinct histology of mucinous and medullary carcinomas.27, 28 However, little is known regarding the clinicopathological features of EGCs with the MSI phenotype. One of the histological features of MSI‐H tumors is the presence of morphological heterogeneity, as defined by the finding of 2 or more distinct subhistological types distinguished on the basis of grade of differentiation (for example, moderate to poor) or histological type (for example, differentiated type, papillary adenocarcinoma, medullary carcinoma and mucinous).28, 29 However, the heterogeneity of MSI‐H cancer is unique to advanced‐stage disease. In this study, we found a close association between EGCs with the MSI phenotype and papillary adenocarcinoma or mixed histological type with tubular and papillary components. It is important for diagnostic pathologists to identify the specific histological features of MSI‐high EGC given that MSI‐high cancer shows rapid progression in both GC and CRC.8, 12 Furthermore, recent evidence has suggested that patients with CRC and GC manifesting MSI have different prognoses and responses to chemotherapeutic agents.8, 12 Therefore, early detection of GC with the MSI‐phenotype may be helpful for gastroenterologists. We suggest that papillary adenocarcinoma or mixed cancer of tubular and papillary components may be a novel marker for early prediction of the MSI‐H status in GCs.
High frequencies of the gastric mucins MUC5AC and/or MUC6 have been previously reported in MSI‐H tumors,30 including MSI‐H GCs. A recent study showed that hypomethylation of the promoter regions of the MUC5AC and MUC6 genes is closely associated with MSI‐H status in CRC.31 Moreover, in our study, we found that MUC5AC and/or MUC6 levels were elevated in EGCs with the MSI phenotype compared to those with the MSS phenotype. This observation suggests that there may be an association between the MSI phenotype and gastric mucin expression in GCs.p53 overexpression (or mutations in the p53 gene) has been shown to play an important role in gastric carcinogenesis.17, 30 However, the role of p53 overexpression during the early stages of gastric carcinogenesis is not fully understood. Although the frequency of p53 overexpression in EGCs varies widely, differences in reported frequencies may be due to tumor histology, tumor grade and mucin phenotype.16, 30 p53 overexpression is also known to depend on the MSI status of the tumor cells; it is an uncommon genetic event in MSI‐H tumors. Therefore, our finding that p53 overexpression was a common genetic alteration in EGCs, irrespective of MSI status, was interesting. However, a recent study performed comprehensive molecular characterization of GC (TCGA).9 The researchers described a molecular classification for defining the 4 major genomic subtypes of gastric cancer: EBV‐infected tumors; MSI tumors; genomically stable tumors; and chromosomally unstable tumors. In the TCGA, although p53 mutations were frequently found in chromosomally unstable tumors, which were identical to those found from chromosome instability, such mutations were rarely detected in MSI tumors.9, 33 In this study, p53 alterations were examined as a substitute for p53 mutations because p53 mutations are closely associated with strong nuclear p53 overexpression in GC. Whether p53 overexpression reflects mutations in the p53 gene remains unknown; however, the p53 gene product has been shown to be overexpressed in GC with the MSI‐high phenotype. Further studies are needed to examine this concept in greater detail.
Recent studies have shown that CRC can be clearly classified into three distinct epigenotypes (HME, IME and LME), which show correlations with BRAF and KRAS mutations, p53 status and prognosis in patients with CRC.23, 24 This CIMP marker is termed a 2‐panel marker; this marker can subclassify the examined tumors into HME and non‐HME and can then divide the remaining tumors into IME and LME. In this study, HME was frequently found in EGC with the MSI‐high phenotype, and IME was closely associated with EGC with the MSS phenotype. Our results showed that the present markers reflected the epigenetic pathogenesis of RGC. From these findings, we designed our study using the CIMP marker to investigate EGC; our data support the use of the CIMP marker for evaluation of gastric carcinogenesis.
In CRC, the MSI phenotype is characterized by the accumulation of numerous mutations across the genome, mainly in microsatellite sequences, due to a defective mismatch repair system.5 Both MSI‐positive advanced CRCs and precursors of MSI‐H CRCs are closely associated with BRAF or KRAS mutations and high levels of genomic methylation (CIMP‐high).5, 8 However, whether the same theory can be applied to EGC, which has been shown to preferentially develop into hereditary nonpolyposis colorectal cancer (HNPCC), has not been proven. In this study, KRAS and BRAF mutations, which have been frequently found in precursor lesions of MSI‐positive CRCs, were rarely detected in EGCs. In particular, no BRAF mutations were observed in any of the EGCs examined in this study. These findings suggest that although mutations in the BRAF and KRAS genes usually induce cell senescence in colorectal serrated lesions,8 a precursor of MSI‐H cancer, tumor cells in MSI‐positive EGCs do not acquire senescence, as supported by the lack of BRAF and KRAS mutations. Thus, although MSI‐H CRCs and GCs share common molecular alterations, the molecular mechanisms of gastric carcinogenesis may be fundamentally different from colorectal carcinogenesis.
Most MSI‐H GCs also exhibit methylation of the MLH‐1 gene as the causal epigenetic event underlying mismatch repair deficiency.5, 8 However, in this study, methylation of the MLH‐1 gene was not correlated with loss or reduction of MLH‐1 expression in some of the EGCs examined. This finding suggests that only a small fraction of EGCs may have developed through mechanisms other than epigenetic alterations in the MLH‐1 gene. Other MMR‐related factors, such as MSH‐2, MSH‐6 and PMS2, should be examined in future studies.
There is an inverse correlation between CIN status and MSI status in CRC.4, 5 Similarly, in GC, the genome also seems to be prone to being either high in AIs, with involvement of multiple cancer‐associated chromosome arms, or high in MSI events targeting various cancer‐associated genes. Recent studies have shown that CIN‐type alterations can be identified by genome‐wide analysis.9, 34 However, traditional approaches using a limited set of microsatellite markers are useful for evaluating chromosomal damage in tumor tissue specimens. In this study, although we observed a low frequency of AI‐high status in EGCs with the MSI phenotype, as shown in previous studies,20, 29 the frequency of AI‐high status was significantly higher in specific individual loci. However, a recent study showed that chromosomal alterations are less frequently found in GC with the MSI‐high phenotype.9 Although a comprehensive analysis of chromosomal alterations was not performed in the present study, AI at cancer‐associated alleles was selectively assessed. While there may be discrepancies in the genomic changes observed between array‐based analysis and PCR‐based analysis, our data suggested that multiple chromosomal abnormalities may exist in EGCs with the MSI and MSS phenotypes, indicating that CIN may be present in EGCs having the MSI phenotype during gastric carcinogenesis.
In conclusion, we showed that the MSI phenotype in EGC was associated with older age, distinct histology and CIMP‐high status. Moreover, our data suggested that EGCs with the MSI phenotype may represent a novel type of precursor lesion in gastric carcinogenesis. The distinct histological features of EGCs with the MSI phenotype may be useful for early detection of progression to GC with the MSI phenotype. Taken together, our data supported that a detailed understanding of the mechanisms of gastric carcinogenesis in the context of the MSI‐H phenotype may facilitate prevention and effective treatment of GC.
Acknowledgements
The authors gratefully acknowledge the technical assistance of Ms. E. Sugawara and Mr. T. Kasai. We also thank members of the Department of Molecular Diagnostic Pathology, Iwate Medical University for their support.
Conflict of Interest: The authors declare that they have no conflicts of interest.
References
- 1. Grabsch HI, Tan P. Gastric cancer pathology and underlying molecular mechanisms. Dig Surg 2013;30:150–8. [DOI] [PubMed] [Google Scholar]
- 2. Ogino S, Goel A. Molecular classification and correlates in colorectal cancer. J Mol Diagn 2008;10:13–27. [DOI] [PMC free article] [PubMed] [Google Scholar]
- 3. Lengauer C, Kinzler KW, Vogelstein B. Genetic instability in colorectal cancers. Nature 1997;386:623–7. [DOI] [PubMed] [Google Scholar]
- 4. Mäkinen MJ. Colorectal serrated adenocarcinoma. Histopathology 2007;50:131–50. [DOI] [PubMed] [Google Scholar]
- 5. Boland CR, Goel A. Microsatellite instability in colorectal cancer. Gastroenterology 2010;138:2073–87. [DOI] [PMC free article] [PubMed] [Google Scholar]
- 6. Wu MS, Lee CW, Shun CT, et al. Distinct clinicopathologic and genetic profiles in sporadic gastric cancer with different mutator phenotypes. Genes Chromosomes Cancer 2000;27:403–11. [PubMed] [Google Scholar]
- 7. Toyota M, Ahuja N, Ohe‐Toyota M, et al. CpG island methylator phenotype in colorectal cancer. Proc Natl Acad Sci U S A 1999;96:8681–6. [DOI] [PMC free article] [PubMed] [Google Scholar]
- 8. Leggett B, Whitehall V. Role of the serrated pathway in colorectal cancer pathogenesis. Gastroenterology 2010;138:2088–100. [DOI] [PubMed] [Google Scholar]
- 9. Cancer Genome Atlas Research Network. Comprehensive molecular characterization of gastric adenocarcinoma. Nature 2014;513:202–9. [DOI] [PMC free article] [PubMed] [Google Scholar]
- 10. Suzuki H, Itoh F, Toyota M, et al. Distinct methylation pattern and microsatellite instability in sporadic gastric cancer. Int J Cancer 1999;83:309–13. [DOI] [PubMed] [Google Scholar]
- 11. Oue N, Oshimo Y, Nakayama H, et al. DNA methylation of multiple genes in gastric carcinoma: association with histological type and CpG island methylator phenotype. Cancer Sci 2003;94:901–5. [DOI] [PMC free article] [PubMed] [Google Scholar]
- 12. Leung SY, Yuen ST, Chung LP, et al. hMLH1 promoter methylation and lack of hMLH1 expression in sporadic gastric carcinomas with high‐frequency microsatellite instability. Cancer Res 1999;59:159–64. [PubMed] [Google Scholar]
- 13. dos Santos NR, Seruca R, Constância M, et al. Microsatellite instability at multiple loci in gastric carcinoma: clinicopathologic implications and prognosis. Gastroenterology 1996;110:38–44. [DOI] [PubMed] [Google Scholar]
- 14. Fleisher AS, Esteller M, Wang S, et al. Hypermethylation of the hMLH1 gene promoter in human gastric cancers with microsatellite instability. Cancer Res 1999;59:1090–5. [PubMed] [Google Scholar]
- 15. Snover D, Ahnen DJ, Burt RW, et al Serrated polyps of the colon and rectum and serrated (“hyperplastic”) polyposis In: Bozman FT, Carneiro F, Hruban RH, et al, eds. WHO Classification of Tumours: Pathology and Genetics Tumours of the Digestive System, 4th edn. Berlin: Springer‐Verlag, 2010. [Google Scholar]
- 16. Snover DC, Jass JR, Fenoglio‐Preiser C, et al. Serrated polyps of the large intestine: a morphologic and molecular review of an evolving concept. Am J Clin Pathol 2005;124:380–91. [DOI] [PubMed] [Google Scholar]
- 17. Kim KJ, Lee TH, Cho NY, et al. Differential clinicopathologic features in microsatellite‐unstable gastric cancers with and without MLH1 methylation. Hum Pathol 2013;44:1055–64. [DOI] [PubMed] [Google Scholar]
- 18. Vauhkonen M, Vauhkonen H, Sajantila A, et al. Differences in genomic instability between intestinal‐ and diffuse‐type gastric cancer. Gastric Cancer 2005;8:238–44. [DOI] [PubMed] [Google Scholar]
- 19. Japanese Gastric Cancer Association. Japanese classification of gastric carcinoma: 3rd English edition. Gastric Cancer 2011;14:101–12. [DOI] [PubMed] [Google Scholar]
- 20. Sugai T, Habano W, Uesugi N, et al. Three independent genetic profiles based on mucin expression in early differentiated‐type gastric cancers–a new concept of genetic carcinogenesis of early differentiated‐type adenocarcinomas. Mod Pathol 2004;17:1223–34. [DOI] [PubMed] [Google Scholar]
- 21. Kimura T, Yamamoto E, Yamano HO, et al A novel pit pattern identifies the precursor of colorectal cancer derived from sessile serrated adenoma. Am J Gastroenterol 2012;107:460–9. [DOI] [PubMed] [Google Scholar]
- 22. Yamamoto E, Suzuki H, Yamano HO, et al. Molecular dissection of premalignant colorectal lesions reveals early onset of the CpG island methylator phenotype. Am J Pathol 2012;181:1847–61. [DOI] [PubMed] [Google Scholar]
- 23. Yagi K, Takahashi H, Akagi K, et al. Intermediate methylation epigenotype and its correlation to KRAS mutation in conventional colorectal adenoma. Am J Pathol 2012;180:616–25. [DOI] [PubMed] [Google Scholar]
- 24. Kaneda A, Yagi K. Two groups of DNA methylation markers to classify colorectal cancer into three epigenotypes. Cancer Sci 2011;102:18–24. [DOI] [PubMed] [Google Scholar]
- 25. Habano W, Sugai T, Nakamura S, et al. A novel method for gene analysis of colorectal carcinomas using a crypt isolation technique. Lab Invest 1996;74:933–40. [PubMed] [Google Scholar]
- 26. Boland CR, Thibodeau SN, Hamilton SR, et al. A National Cancer Institute Workshop on Microsatellite Instability for cancer detection and familial predisposition: development of international criteria for the determination of microsatellite instability in colorectal cancer. Cancer Res 1998;58:5248–57. [PubMed] [Google Scholar]
- 27. Kim KM, Kwon MS, Hong SJ, et al. Genetic classification of intestinal‐type and diffuse‐type gastric cancers based on chromosomal loss and microsatellite instability. Virchows Arch 2003;443:491–500. [DOI] [PubMed] [Google Scholar]
- 28. Arai T, Sakurai U, Sawabe M, et al. Frequent microsatellite instability in papillary and solid‐type, poorly differentiated adenocarcinomas of the stomach. Frequent microsatellite instability in papillary and solid‐type, poorly differentiated adenocarcinomas of the stomach. Gastric Cancer 2013;16:505–12. [DOI] [PubMed] [Google Scholar]
- 29. Hiyama T, Tanaka S, Yoshihara M, et al Chromosomal and microsatellite instability in sporadic gastric cancer. J Gastroenterol Hepatol 2004;19:756–60. [DOI] [PubMed] [Google Scholar]
- 30. Endoh Y, Sakata K, Tamura G, et al. Cellular phenotypes of differentiated‐type adenocarcinomas and precancerous lesions of the stomach are dependent on the genetic pathways. J Pathol 2000;191:257–63. [DOI] [PubMed] [Google Scholar]
- 31. Renaud F, Vincent A, Mariette C, et al. MUC5AC hypomethylation is a predictor of microsatellite instability independently of clinical factors associated with colorectal cancer. Int J Cancer 2014;136:2811–21. [DOI] [PubMed] [Google Scholar]
- 32. An C, Choi IS, Yao JC, et al. Prognostic significance of CpG island methylator phenotype and microsatellite instability in gastric carcinoma. Clin Cancer Res 2005;11:656–63. [PubMed] [Google Scholar]
- 33. Wang K, Yuen ST, Xu J, et al. Whole‐genome sequencing and comprehensive molecular profiling identify new driver mutations in gastric cancer. Nat Genet 2014;46:573–82. [DOI] [PubMed] [Google Scholar]
- 34. Vauhkonen H, Vauhkonen M, Sajantila A, et al. DNA copy number aberrations in intestinal‐type gastric cancer revealed by array‐based comparative genomic hybridization. Cancer Genet Cytogenet 2006;167:150–4. [DOI] [PubMed] [Google Scholar]