

Abstract
This meta‐analysis was performed to determine the accuracy of procalcitonin (PCT) in predicting mortality in pneumonia patients with different pathogenic features and disease severities. A systematic search of English‐language articles was performed using PubMed, Embase, Web of Knowledge and the Cochrane Library to identify studies. The diagnostic value of PCT in predicting prognosis was determined using a bivariate meta‐analysis model. The Q‐test and I 2 index were used to test heterogeneity. A total of 21 studies comprising 6007 patients were included. An elevated PCT level was a risk factor for death from community‐acquired pneumonia (CAP) (risk ratio (RR) 4.38, 95% confidence interval (CI) 2.98–6.43), particularly in patients with a low CURB‐65 score. The commonly used cut‐off, 0.5 ng/mL, had low sensitivity (SEN) and was not able to identify patients at high risk of dying. Furthermore, the PCT assay with functional SEN <0.1 ng/mL was necessary to predict mortality in CAP in the clinic. For critically ill patients, an elevated PCT level was associated with an increased risk of mortality (RR 4.18, 95% CI: 3.19–5.48). The prognostic performance was nearly equal between patients with ventilator‐associated pneumonia (VAP) and patients with CAP.
Keywords: meta‐analysis, mortality, pneumonia, procalcitonin, prognosis
Abbreviations
- CAP
community‐acquired pneumonia
- CI
confidence interval
- CR
consecutive recruitment
- DOR
diagnostic odds ratio
- ED
emergency department
- FN
false negative
- FP
false positive
- HW
hospital ward
- ICU
intensive care unit
- LR
likelihood ratio
- NLR
negative likelihood ratio
- PCT
procalcitonin
- PLR
positive likelihood ratio
- PR
prospective recruitment
- RR
relative risk
- SEN
sensitivity
- SPE
specificity
- SROC
summary receiver operator characteristic
- TN
true negative
- TP
true positive
- VAP
ventilator‐associated pneumonia
Introduction
The lung is the most frequent site of infection in people worldwide. Pneumonia may manifest as a wide range of possible outcomes because of different disease severities and pathogenic features. For critically ill patients, community‐acquired pneumonia (CAP) and ventilator‐associated pneumonia (VAP) are associated with high mortality.1 The unpredictable disease course and uncertain outcomes are challenges for clinicians, hindering the early identification of patients at risk of dying. However, for CAP, a considerable proportion of patients in the emergency department (ED) can be treated as outpatients. Therefore, risk stratification is a key issue for the management of this population, allowing the selection of the most appropriate care setting, whether outpatient treatment, admission to a hospital ward (HW) or the intensive care unit (ICU). Several risk scores, such as the pneumonia severity index (PSI) and CURB‐65 (confusion, urea nitrogen, respiratory rate, blood pressure, age ≥65 years), can be used to assess the severity of pneumonia and predict mortality.2, 3, 4, 5, 6 However, they tend to be used more for research than clinical decision making and have several limitations.
A growing number of clinical research studies have identified blood biomarkers that may reveal additional information about the prognosis of patients with pneumonia.7, 8, 9, 10 Procalcitonin (PCT), the prohormone of calcitonin, mirrors the severity of infection and has emerged as the most studied and promising blood biomarker for the risk stratification of patients. However, whether the PCT level is an ideal index to predict the prognosis of pneumonia remains debatable, particularly in patients with different types and severities of pneumonia.11, 12 For this reason, a meta‐analysis was performed to systematically and quantitatively evaluate the prognostic accuracy of the PCT level in different types and severities of pneumonia.
Methods
Search strategy and study selection
Two investigators (L.D. and G.W.) independently performed the search strategy and assessed the studies. Any disagreement was resolved by a third opinion (S.L.X.). A systematic search of English‐language articles was performed using Medline (via PubMed), Embase (via OvidSP), Web of Knowledge and the Cochrane Library (see Supplementary Appendix 1 for an example of the search strategy). No publication date restrictions were applied to the search.
Studies were included if they assessed the accuracy of PCT levels associated with mortality in adult (>18 years old) patients with pneumonia. To be eligible, they had to have a well‐defined diagnostic reference standard for pneumonia. Furthermore, the studies had to provide sufficient information to construct a 2 × 2 contingency table. For CAP, low risk was defined as PSI score classes I to III and CURB‐65 score class 1. High risk was defined by PSI score classes IV‐V and CURB‐65 score classes 2–5 according to previous criteria.13, 14 For studies providing multiple PCT cut‐off points for prognostic accuracy, the data giving the maximum overall accuracy were selected. And if multiple studies reused the same sample of patients, the most recent or most informative article was included.
Data extraction and quality assessment
Two investigators, L.D. and G.W., independently extracted the data and assessed the quality of the included studies. Any conflict was resolved by a third opinion. The following descriptive data were extracted: name of the first author, publication year, study design, clinical setting, endpoints, assay manufacturer, sample size, prevalence of mortality, type of pneumonia, cut‐off point sensitivity (SEN) and specificity (SPE). The corresponding authors were contacted if the data were not presented or needed clarification. The quality of included studies were evaluated according to the Revised Tool for Quality Assessment of Diagnostic Accuracy Studies checklist for diagnostic studies.15 Risk of bias was judged as ‘low’, ‘high’ or ‘unclear’.
Statistical analysis
We chose the MIDAS module for STATA software, version 12.0 (Stata Corporation, College Station, TX) and Meta‐Disc 1.4 (XI Cochrane Colloquium, Barcelona, Spain) to perform statistical analyses. True positives (TP), false positives (FP), false negatives (FN), and true negatives (TN) were tabulated based on the PCT levels and all‐cause mortality in pneumonia. Relative risk (RR) was used to assess the predictive value of PCT and pooled using a fixed‐effect or random‐effect model based on DerSimonian and Laird's method.16 The Q‐test was performed and the I 2 index was calculated to assess inter‐study heterogeneity.17, 18 Values of 25%, 50% and 75% for the I 2 test represented low, medium and high heterogeneity, respectively.19 An I 2 value less than 50% was considered to be acceptable heterogeneity between studies, in which case the fixed‐effect model was selected. Otherwise, the random‐effect model was chosen. A P value less than 0.05 was considered statistically significant.
The presence of a threshold effect on the prognostic accuracy of PCT in pneumonia was evaluated using the Spearman correlation coefficient between the logits of SEN and SPE. If no threshold effect existed, a bivariate random‐effect regression model20, 21 was used to calculate the pooled SEN, SPE, diagnostic odds ratio (DOR), positive likelihood ratio (PLR) and negative likelihood ratio (NLR). If a threshold effect did exist, the summary receiver operating characteristic (SROC) curve was constructed by plotting the individual and summary points of SEN and SPE to assess the overall diagnostic accuracy.22
A subgroup analysis restricted to both CAP and critically ill pneumonia patients was performed to explore the prognostic accuracy of PCT. A univariate meta‐regression analysis was performed to explore the sources of potential heterogeneity between studies. The covariates included the year of publication, sample size, prevalence of mortality, endpoints, high‐quality methodology (if the data were collected consecutively), different cut‐off points and the proportion of high‐risk patients identified based on the PSI (classes IV‐V) and CURB‐65 scores (classes 2–5). Publication bias was tested using Deeks' funnel plot.
Results
Six‐hundred and thirty‐seven articles were retrieved from databases, of which 21 studies with a total of 6007 patients were eventually included (Fig. 1). No additional relevant articles were identified in the bibliographies of the original articles. The characteristics of the included studies are listed in Table 1.
Figure 1.
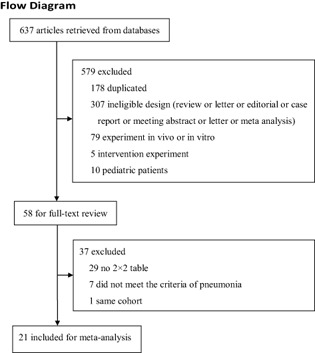
Flowchart of study selection.
Table 1.
Characteristics of the included studies
| Author | Year | Study design | Clinical setting | Endpoint | Assay | Sample size (n) | Prevalence (%) | Type of pneumonia | Cut‐off (ng/mL) | SEN (95% CI) | SPE (95% CI) |
|---|---|---|---|---|---|---|---|---|---|---|---|
| Boussekey23 | 2005 | PR + CR | ICU | ICU mortality | LUMItest PCT | 110 | 27.3 | CAP | 2 | 76.7 | 60 |
| Tseng24 | 2008 | PR | ICU | 14‐day mortality | Kryptor PCT | 22 | 22.8 | CAP | 21.91 | 80 | 88.2 |
| Hillas25 | 2010 | PR + CR | ICU | 28‐day mortality | PCT‐LIA | 45 | 35.6 | VAP | 0.42 | 87.5 | 65.5 |
| Su26 | 2012 | PR | ICU | 28‐day mortality | VIDAS | 26 | 53 | VAP | 9.47 | 66.7 | 90.9 |
| Seligman27 | 2011 | PR + CR | ICU | 28‐day mortality | LUMItest PCT | 71 | 36.6 | VAP | 0.74 | 84.6 | 57.8 |
| Duflo28 | 2002 | PR + CR | ICU | Mortality | LUMItest PCT | 44 | 64 | VAP | 2.6 | 74 | 75 |
| Luyt29 | 2005 | PR + CR | ICU | Adverse outcomes | Kryptor PCT | 76 | 61.8 | VAP | 1 | 83 | 64 |
| Savva30 | 2011 | MPR + CR | ICU | 28‐day mortality | Kryptor PCT | 180 | 38.5 | VAP | 0.92 | 80 | 88.5 |
| Zielinska31 | 2012 | PR | ICU | Mortality | LUMItest PCT | 34 | 21 | VAP | 0.62 | 100 | 66.3 |
| Andrijevic32 | 2014 | PR | HW | 30‐day mortality | VIDAS | 101 | 24.8 | CAP | 2.56 | 76 | 61.8 |
| Masia33 | 2005 | PR | HW | 28‐day mortality | LUMItest PCT | 185 | 4.87 | CAP | 0.5 | 55.6 | 90.9 |
| Huang34 | 2008 | MPR | ED | 30‐day mortality | Kryptor PCT | 1651 | 6.4 | CAP | 0.1 | 92.5 | 34.6 |
| 0.25 | 64.2 | 55.7 | |||||||||
| 0.5 | 49.1 | 65.6 | |||||||||
| Kasamatsu35 | 2012 | PR | HW | 30‐day mortality | PCT‐Q | 170 | 11.8 | CAP | 0.5 | 25.8 | 96.3 |
| Krueger36 | 2008 | PR | HW | 28‐day mortality | Kryptor PCT | 1508 | 4.5 | CAP | 0.228 | 84.3 | 66.6 |
| Lacoma37 | 2012 | PR | ED | Mortality | VIDAS | 75 | 8 | CAP | 0.115 | 50 | 83.3 |
| Liu38 | 2014 | PR + CR | ED | 28‐day mortality | VIDAS | 359 | 22 | CAP | 0.955 | 58.7 | 71.1 |
| Park39 | 2012 | PR | ED | 28‐day mortality | PCT‐LIA | 126 | 12.7 | CAP | 0.35 | 68.75 | 92.73 |
| Ugajin40 | 2014 | PR + CR | HW | 28‐day mortality | PCT‐Q | 213 | 9.4 | CAP | 0.5 | 60 | 49.2 |
| Schuetz41 | 2011 | PR + CR | ED | 30‐day mortality | Kryptor PCT | 924 | 5.4 | CAP | 0.1 | 94 | 12.7 |
| 0.25 | 78 | 37.76 | |||||||||
| 0.5 | 58 | 51.95 | |||||||||
| 1 | 48 | 61.1 | |||||||||
| 5 | 26 | 83.75 | |||||||||
| Haeuptle42 | 2009 | RR | ED | Adverse outcomes | Kryptor PCT | 29 | 17.2 | CAP | 1.5 | 82 | 75 |
| Porfyridis43 | 2014 | PR | HW | Hospital mortality | Kryptor PCT | 58 | 17.2 | NHAP | 1.1 | 80 | 82 |
CAP, community‐acquired pneumonia; CR, consecutive recruitment; ED, emergency department; FN, false negative; FP, false positive; HW, hospital ward; ICU, intensive care unit; MPR, multi‐centre prospective recruitment; MRCT, multi‐centre randomized controlled trial; NHAP, nursing home‐acquired pneumonia; PR, prospective recruitment; RR, retrospective recruitment; SEN, sensitivity; SPE, specificity; TN, true negative; TP, true positive; VAP, ventilator‐associated pneumonia.
Characteristics of included studies
The included studies were published from 2002 to 2014. Eleven were conducted in Europe;23, 25, 28, 29, 30, 31, 32, 33, 36, 37, 42 seven in Asia;24, 26, 35, 38, 39, 40, 43 two in North America;34, 41 and one in South America.27 The mean age of the patients varied between 53 and 82 years, and the proportion of men ranged from 18–98%. Thirteen studies included patients with CAP23, 24, 32, 33, 34, 35, 36, 37, 38, 39, 40, 41, 42 11 with VAP,25, 26, 27, 28, 29, 30, 31 and one with nursing home‐acquired pneumonia.43 Nine studies, which included critically ill patients, were performed in ICU;23, 24, 25, 26, 27, 28, 29, 30, 31 six in ED;34, 37, 38, 39, 41, 42 and six in HW.32, 33, 35, 36, 40, 43 Nineteen studies collected blood samples within 24 h after patients were diagnosed with pneumonia.24, 25, 26, 27, 28, 29, 30, 32, 33, 34, 35, 36, 37, 38, 39, 40, 41, 42, 43 One study collected blood samples within 48 h because of limited laboratory availability.23 One study measured the PCT level on day 3.31 The endpoints differed across studies, including 14‐day mortality,24 28‐day mortality,25, 26, 27, 30, 33, 36, 37, 38, 39, 40 30‐day mortality,32, 34, 35, 41 ICU mortality,23 hospital stay43 and adverse outcomes.29, 42 Three studies used the VIDAS method,32, 37, 38 four the Kryptor PCT assay34, 36, 41, 42 and one the PCT‐LIA assay;39 these assays had functional SEN less than 0.1 ng/mL. One study used the LUMItest PCT assay,33 and two the PCT‐Q;35, 40 these assays had functional SEN greater than 0.1 ng/mL.
Study quality and publication bias
The quality of each included study is shown in Supplementary Table S1. The overall Deeks' funnel plot of the included studies is shown in Table 2.
Table 2.
Subgroup analysis
| Variable | No. of studies | No. of patients | Sensitivity (95% CI) | Specificity (95% CI) | Diagnostic odds ratio (95% CI) | Positive likelihood ratio (95% CI) | Negative likelihood ratio (95% CI) | AUC (95% CI) | Test for heterogeneity (I 2) | Deeks' funnel test (P value) | |
|---|---|---|---|---|---|---|---|---|---|---|---|
| CAP patients | Overall | 14 | 5532 | 0.69 (0.57–0.79) | 0.74 (0.60–0.84) | 6 (4–10) | 2.6 (1.8–3.8) | 0.42 (0.32–0.55) | 0.77 (0.73–0.80) | 62.7 | 0.46 |
| Cut‐off = 0.5 ng/mL | 5 | 3143 | 0.46 (0.33–0.59) | 0.77 (0.52–0.91) | 3 (1–6) | 2.0 (1–3.9) | 0.70 (0.60–0.83) | 0.56 (0.52–0.61) | 70.9 | 0.2 | |
| FAS > 0.1 ng/mL | 3 | 568 | 0.44 (0.20–0.68) | 0.86 (0.70–1.00) | 4 (1–20) | 3.37 (1–12.4) | 0.75 (0.60–0.94) | 0.64 (0.60–0.66) | 76.3 | 0.6 | |
| FAS < 0.1 ng/mL | 8 | 4773 | 0.75 (0.63–0.84) | 0.68 (0.52–0.81) | 6 (4–11) | 2.3 (1.6–3.4) | 0.36 (0.26–0.51) | 0.78 (0.75–0.82) | 70 | 0.63 | |
| HW patients | 6 | 2235 | 0.65 (0.46–0.80) | 0.79 (0.60–0.90) | 7 (3–14) | 3.1 (1.8–5.4) | 0.45 (0.30–0.67) | 0.77 (0.74–0.81) | 66 | 0.74 | |
| ED patients | 6 | 3165 | 0.73 (0.56–0.85) | 0.69 (0.47–0.85) | 6 (3–12) | 2.4 (1.4–4.0) | 0.39 (0.26–0.60) | 0.77 (0.73–0.81) | 66.6 | 0.56 | |
| ICU patients | Overall | 9 | 608 | 0.80 (0.75–0.85) | 0.74 (0.63–0.82) | 12 (7–20) | 3.1 (2.2–4.3) | 0.27 (0.20–0.35) | 0.83 (0.79–0.86) | 49.2 | 0.98 |
| VAP patients | 7 | 476 | 0.81 (0.75–0.87) | 0.74 (0.63–0.83) | 13 (7–23) | 3.2 (2.1–4.7) | 0.25 (0.18–0.34) | 0.85 (0.81–0.87) | 59.2 | 0.49 |
AUC, area under the curve; CAP, community‐acquired pneumonia; CI, confidence interval; ED, emergency department; FAS, functional assay sensitivity; HW, hospital ward; ICU, intensive care unit; VAP, ventilator‐associated pneumonia.
Data analysis for patients with CAP
Prognostic performance of PCT in patients with CAP
There were 14 studies with 5532 patients in the CAP group.23, 24, 32, 33, 34, 35, 36, 37, 38, 39, 40, 41, 42 Two included patients diagnosed with severe pneumonia.23, 24 The random‐effect model was used to pool the RR (I 2 = 62.7%). An elevated PCT level was associated with an increased risk of mortality in CAP (risk ratio (RR) 4.38, 95% CI: 2.98–6.43) (Fig. 2a).
Figure 2.
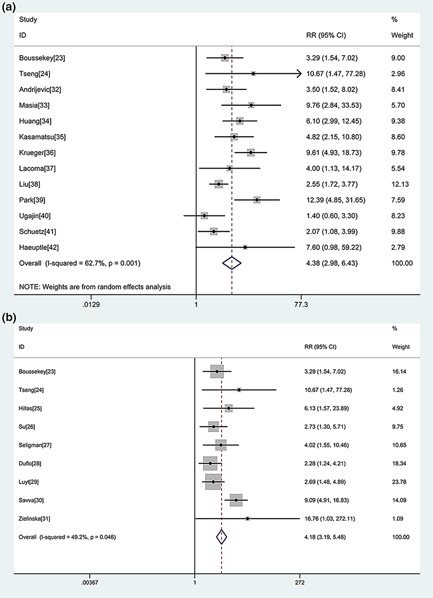
a. Forest plot of procalcitonin (PCT) in predicting mortality in community‐acquired pneumonia (CAP). The overall pooled relative risk (RR) was 4.38 (95% CI: 2.98–6.43). b. Forest plot of PCT in predicting mortality in intensive care unit (ICU) patients with pneumonia. The overall pooled RR was 4.18 (95% CI: 3.19–5.48).
No statistically significant difference was observed for the threshold effect (Spearman correlation coefficient = 0.545; P = 0.054). The pooled SEN and SPE were 0.69 (95% CI: 0.57–0.79) and 0.74 (95% CI: 0.60–0.84), respectively (Fig. 3a). The PLR and NLR were 2.6 (95% CI: 1.8–3.8) and 0.42 (95% CI: 0.32–0.55), respectively. The DOR was 6 (95% CI: 4–10). The overall area under the SROC curve (AUC) was 0.77 (95% CI: 0.73–0.80) (Fig. 4a).
Figure 3.
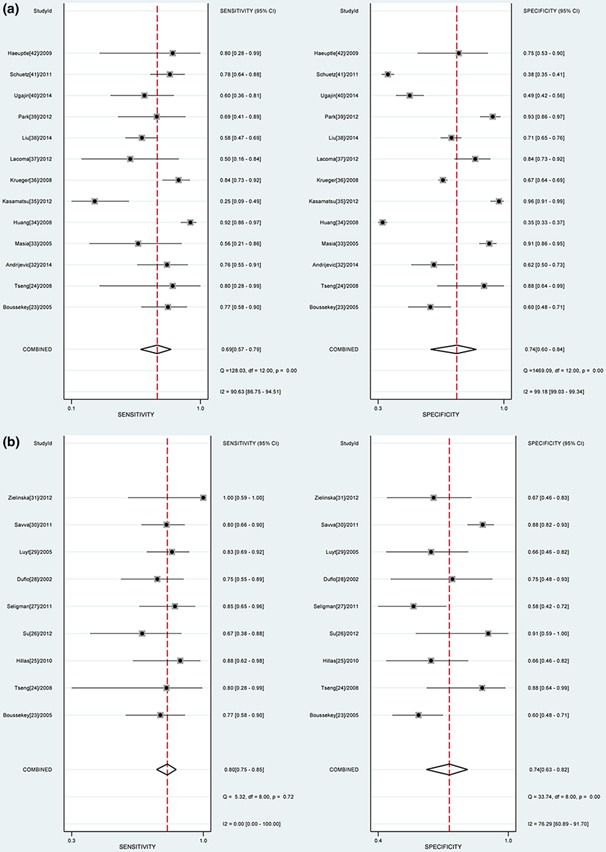
a. Forest plot of the sensitivity (SEN) and, specificity (SPE) of procalcitonin (PCT) in predicting mortality in community‐acquired pneumonia (CAP). The pooled SEN and SPE were 0.69 (95% CI: 0.57–0.79) and 0.74 (95% CI: 0.60–0.84), respectively. b. Forest plot of the SEN and SPE of PCT in predicting mortality in ICU patients with pneumonia. The pooled SEN and SPE were 0.80 (95% CI: 0.75–0.85) and 0.74 (95% CI: 0.63–0.82), respectively.
Figure 4.
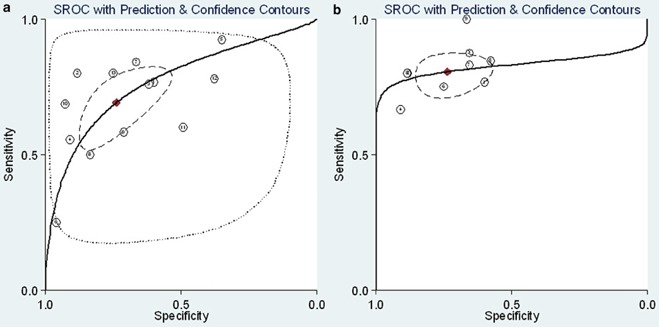
Summary receiver operator characteristic (SROC) graph of the included studies ((a) For CAP patients; (b) For ICU patients with pneumonia). ( Obsened Data;
  Summary Operating Point, SENS = 0.69 [0.57–0.79], SPEC = 0.74 [0.60–0.84];
  SROC Cune, AUC = 0.77 [0.73–0.80];
  95% Confidence Contour;
  95% Prediction Contour
  Obsened Data;
  Summary Operating Point, SENS = 0.80 [0.75–0.85], SPEC = 0.74 [0.63–0.82],
  SROC Cune, AUC = 0.83 [0.79–0.88];
  95% Confidence Contour,
  95% Prediction Contour)
Meta‐regression analysis
A meta‐regression analysis was performed to identify the sources of heterogeneity between studies. The results indicated that only consecutive collection and the CURB‐65 score (classes 2–5) were statistically significant for heterogeneity (P = 0.001 and P = 0.024, respectively).
Subgroup analysis
When analyzing the different mortalities of CAP patients in the ICU and other clinical settings, we excluded two studies which were restricted to critically ill patients with severe CAP.23, 24 In the analysed group, a significant threshold effect was observed (Spearman correlation coefficient = 0.620; P = 0.032). Therefore, we calculated the overall AUC to be 0.76 (95% CI: 0.73–0.80).
A subgroup analysis restricted to different cut‐offs, different clinical settings and PCT assays with different SEN values was performed (Table 2). It was found that studies which chose the commonly used cut‐off of 0.5 ng/mL had a low SEN for PCT predicting mortality in CAP and were unable to identify patients at high risk of dying.33, 34, 35, 40, 41 Two studies provided prognostic accuracy using a cut‐off in the range of 0.25–5 ng/mL.34, 41 Both showed that the cut‐off of 0.5 ng/mL was not sensitive enough to provide prognostic value to clinicians and had lower overall prognostic performance compared with a cut‐off of <0.5 ng/mL. It was also found that studies with functional assay SEN (FAS) less than 0.1 ng/mL had superior prognostic performance.
Data analysis for ICU patients with pneumonia
There were nine studies including 608 patients in this group.23, 31 They were conducted in the ICU and focused on critically ill patients. Two studies included patients with CAP,23, 24 and seven with VAP.25, 26, 27, 28, 29, 30, 31 The mean prevalence of mortality was 40.1% (interquartile range 21–64). The heterogeneity between studies was acceptable (I 2 = 49.2%), and a fixed‐effect model was used to pool the RR. An elevated PCT level was associated with an increased risk of mortality in critically ill patients with pneumonia (RR 4.18, 95% CI: 3.19–5.48) (Fig. 2b).
The pooled SEN and SPE were 0.80 (95% CI: 0.75–0.85) and 0.74 (95% CI: 0.63–0.82), respectively (Fig. 3b). The PLR and NLR were 3.1 (95% CI: 2.2–4.3) and 0.27 (95% CI: 0.20–0.35), respectively. The DOR was 12 (95% CI: 7–20). The overall AUC was 0.83 (95% CI: 0.79–0.86) (Fig. 4b), indicating moderate diagnostic accuracy. Meta‐regression analysis indicated that only the sample sizes were statistically significant for heterogeneity (P=0.034). The subgroup analysis is shown in Table 2. The performance in VAP patients was nearly equal to the overall performance in ICU patients.
Discussion
For patients with CAP, outpatient treatment significantly reduces the risk of healthcare‐associated infections and frees scarce resources in many health‐care settings. A vital decision for a clinician is whether to admit a patient with CAP to the ICU. Prognostic scores, such as the PSI and CURB‐65, are guideline recommended to assess pneumonia severity.44 However, some are highly complex for clinical use.13 In addition, many studies have shown that these clinical scores are not exempt from FP and FN results and, therefore, are not ideal. Many patients are misclassified as high‐risk classes IV and V according to the PSI score.45 A meta‐analysis showed that the CURB‐65 score only has a SEN of 0.62 for predicting mortality in CAP.46
In this meta‐analysis, the prognostic performance of PCT in pneumonia was first statistically calculated. It was demonstrated that an elevated PCT level is associated with an increased risk of mortality. The CURB‐65 score (classes 2–5) was statistically significant for heterogeneity, indicating that an elevated PCT level was a risk factor for death, particularly in patients with a low CURB‐65 score. For this reason, PCT may provide additional information for risk scores when deciding whether to admit patients to the ICU or treat them as outpatients.
It was also confirmed that the commonly used cut‐off of 0.5 ng/mL only had a SEN of 0.44 (95% CI: 0.21–0.66) and was not able to identify patients at high risk of dying. In our meta‐analysis, two studies provided prognostic accuracy using a cut‐off of <0.5 ng/mL as well as a cut‐off of 0.5 ng/mL.34, 41 Both studies showed that the cut‐off of <0.5 ng/mL had superior prognostic performance compared with the cut‐off of 0.5 ng/mL. Certain studies found lower serum PCT levels in patients with CAP and lower mortality.47 These studies indicated that a lower cut‐off point for PCT should be defined and used clinically when deciding whether to admit patients to the hospital or treat them as outpatients. Furthermore, we found that studies with FAS greater than 0.1 ng/mL have a low SEN for using PCT to predict mortality in CAP. Thus, the LUMItest assay and PCT‐Q test are not sensitive enough to detect mildly elevated PCT levels, which limit their use in clinical decision making for CAP patients with low mortality. A more sensitive assay for PCT should be used clinically.
CAP and VAP may be precursors to sepsis and cause a large proportion of deaths in the ICU. For critically ill patients, the unpredictable disease course and uncertain outcomes have been a challenge for clinicians, hindering the early identification of patients at risk of dying. The identification of these patients may allow the rapid initiation of the appropriate therapeutic interventions and have a great impact on patient outcomes. In our study, it was demonstrated that an elevated PCT level was also associated with an increased risk of mortality (RR 4.18, 95% CI: 3.19–5.48) for critically ill patients. The prognostic performance in patients with CAP was nearly equal to the overall performance. However, limitations should be taken into consideration when interpreting the findings. First, the number of studies focusing on critically ill patients was small. Second, substantial heterogeneity existed in each subgroup. Thus, more studies are needed to clarify the prognostic value of PCT restricted to different pathogenic features.
Conclusion
For patients with mild CAP or low mortality, the commonly used cut‐off of 0.5 ng/mL had low SEN and could not be used to identify patients at high risk of dying. A more sensitive assay should be used clinically when deciding whether to admit patients to the ICU or treat them as outpatients. For critically ill patients, an elevated PCT level was also associated with an increased risk of mortality. The prognostic performance was nearly equal between patients with VAP and those with CAP. Further studies should assess whether a lower PCT threshold and more sensitive PCT assays can provide superior prognostic value for patients with pneumonia.
Supporting information
Appendix S1 Example search strategy for PubMed.
Table S1 QUADAS‐2 results of included studies.
DL and L‐XS contributed equally to this study.
(Associate Editor: Marcos Restrepo).
References
- 1. Mizgerd JP. Acute lower respiratory tract infection. N. Engl. J. Med. 2008; 358: 716–727. [DOI] [PMC free article] [PubMed] [Google Scholar]
- 2. Kolditz M, Ewig S, Höffken G. Management‐based risk prediction in community‐acquired pneumonia by scores and biomarkers. Eur. Respir. J. 2013; 41: 974–984. [DOI] [PubMed] [Google Scholar]
- 3. Woodhead M, Blasi F, Ewig S, Garau J, Huchon G, Ieven M, Ortqvist A, Schaberg T, Torres A, van der Heijden G et al Guidelines for the management of adult lower respiratory tract infections–full version. Clin. Microbiol. Infect. 2011; 17: E1–59. [DOI] [PMC free article] [PubMed] [Google Scholar]
- 4. Fang WF, Yang KY, Wu CL, Yu CJ, Chen CW, Tu CY, Lin MC. Application and comparison of scoring indices to predict outcomes in patients with healthcare‐associated pneumonia. Crit. Care 2011; 15: R32. [DOI] [PMC free article] [PubMed] [Google Scholar]
- 5. Ewig S, Bauer T, Richter K, Szenscenyi J, Heller G, Strauss R, Welte T. Prediction of in‐hospital death from community‐acquired pneumonia by varying CRB‐age groups. Eur. Respir. J. 2013; 41: 917–922. [DOI] [PubMed] [Google Scholar]
- 6. El‐Solh AA, Alhajhusain A, Abou Jaoude P, Drinka P. Validity of severity scores in hospitalized patients with nursing home acquired pneumonia. Chest 2010; 138: 1371–1376. [DOI] [PubMed] [Google Scholar]
- 7. Hohenthal U, Hurme S, Helenius H, Heiro M, Meurman O, Nikoskelainen J, Kotilainen P. Utility of C‐reactive protein in assessing the disease severity and complications of community‐acquired pneumonia. Clin. Microbiol. Infect. 2009; 15: 1026–1032. [DOI] [PubMed] [Google Scholar]
- 8. van Vugt SF, Broekhuizen BD, Lammens C, Zuithoff NP, de Jong PA, Coenen S, Ieven M, Butler CC, Goossens H, Little P et al Use of serum C reactive protein and procalcitonin concentrations in addition to symptoms and signs to predict pneumonia in patients presenting to primary care with acute cough: diagnostic study. BMJ 2013; 346: f2450. [DOI] [PMC free article] [PubMed] [Google Scholar]
- 9. Póvoa P, Coelho L, Almeida E, Fernandes A, Mealha R, Moreira P, Sabino H. Early identification of intensive care unit‐acquired infections with daily monitoring of C‐reactive protein: a prospective observational study. Crit. Care 2006; 10: R63. [DOI] [PMC free article] [PubMed] [Google Scholar]
- 10. Menéndez R, Martínez R, Reyes S, Mensa J, Filella X, Marcos MA, Martínez A, Esquinas C, Ramirez P, Torres A. Biomarkers improve mortality prediction by prognostic scales in community‐acquired pneumonia. Thorax 2009; 64: 587–591. [DOI] [PubMed] [Google Scholar]
- 11. Bloos F, Marshall JC, Dellinger RP, Vincent JL, Gutierrez G, Rivers E, Balk RA, Laterre PF, Angus DC, Reinhart K et al Multinational, observational study of procalcitonin in ICU patients with pneumonia requiring mechanical ventilation: a multicenter observational study. Crit. Care 2011; 15: R88. [DOI] [PMC free article] [PubMed] [Google Scholar]
- 12. Hirakata Y, Yanagihara K, Kurihara S, Izumikawa K, Seki M, Miyazaki Y, Kohno S. Comparison of usefulness of plasma procalcitonin and C‐reactive protein measurements for estimation of severity in adults with community‐acquired pneumonia. Diagn. Microbiol. Infect. Dis. 2008; 61: 170–174. [DOI] [PubMed] [Google Scholar]
- 13. Fine MJ, Auble TE, Yealy DM, Hanusa BH, Weissfeld LA, Singer DE, Coley CM, Marrie TJ, Kapoor WN. A prediction rule to identify low‐risk patients with community‐acquired pneumonia. N. Engl. J. Med. 1997; 336: 243–250. [DOI] [PubMed] [Google Scholar]
- 14. Yealy DM, Auble TE, Stone RA, Lave JR, Meehan TP, Graff LG, Fine JM, Obrosky DS, Mor MK, Whittle J et al Effect of increasing the intensity of implementing pneumonia guidelines: a randomized, controlled trial. Ann. Intern. Med. 2005; 143: 881–894. [DOI] [PubMed] [Google Scholar]
- 15. Whiting PF, Rutjes AW, Westwood ME, Mallett S, Deeks JJ, Reitsma JB, Leeflang MM, Sterne JA, Bossuyt PM. QUADAS‐2: a revised tool for the quality assessment of diagnostic accuracy studies. Ann. Intern. Med. 2011; 155: 529–536. [DOI] [PubMed] [Google Scholar]
- 16. Higgins JP, Thompson SG, Deeks JJ, Altman DG. Measuring inconsistency in meta‐analyses. Br. Med. J. 2003; 327: 557. [DOI] [PMC free article] [PubMed] [Google Scholar]
- 17. DerSimonian R, Laird N. Meta‐analysis in clinical trials. Control. Clin. Trials 1986; 7: 177–188. [DOI] [PubMed] [Google Scholar]
- 18. Higgins JP, Thompson SG. Quantifying heterogeneity in a meta‐analysis. Stat. Med. 2002; 21: 1539–1558. [DOI] [PubMed] [Google Scholar]
- 19. Cucherat M, Boissel JP, Leizorovicz A, Haugh MC. EasyMA: a program for the meta‐analysis of clinical trials. Comput. Methods Programs Biomed. 1997; 53: 187–190. [DOI] [PubMed] [Google Scholar]
- 20. Reitsma JB, Glas AS, Rutjes AW, Scholten RJ, Bossuyt PM, Zwinderman AH. Bivariate analysis of sensitivity and specificity produces informative summary measures in diagnostic reviews. J. Clin. Epidemiol. 2005; 58: 982–990. [DOI] [PubMed] [Google Scholar]
- 21. Whiting P, Rutjes AW, Reitsma JB, Bossuyt PM, Kleijnen J. The development of QUADAS: a tool for the quality assessment of studies of diagnostic accuracy included in systematic reviews. BMC Med. Res. Methodol. 2003; 3: 25. [DOI] [PMC free article] [PubMed] [Google Scholar]
- 22. Moses LE, Shapiro D, Littenberg B. Combining independent studies of a diagnostic test into a summary ROC curve: data‐analytic approaches and some additional considerations. Stat. Med. 1993; 12: 1293–1316. [DOI] [PubMed] [Google Scholar]
- 23. Boussekey N, Leroy O, Georges H, Devos P, d'Escrivan T, Guery B. Diagnostic and prognostic values of admission procalcitonin levels in community‐acquired pneumonia in an intensive care unit. Infection 2005; 33: 257–263. [DOI] [PMC free article] [PubMed] [Google Scholar]
- 24. Tseng JS, Chan MC, Hsu JY, Kuo BI, Wu CL. Procalcitonin is a valuable prognostic marker in ARDS caused by community‐acquired pneumonia. Respirology 2008; 13: 505–509. [DOI] [PubMed] [Google Scholar]
- 25. Hillas G, Vassilakopoulos T, Plantza P, Rasidakis A. Bakakos P. C‐reactive protein and procalcitonin as predictors of survival and septic shock in ventilator‐associated pneumonia. Eur. Respir. J. 2010; 35: 805–811. [DOI] [PubMed] [Google Scholar]
- 26. Su LX, Meng K, Zhang X, Wang HJ, Yan P, Jia YH, Feng D, Xie LX. Diagnosing ventilator‐associated pneumonia in critically ill patients with sepsis. Am. J. Crit. Care 2012; 21: e110–119. [DOI] [PubMed] [Google Scholar]
- 27. Seligman R, Seligman BG, Teixeira PJ. Comparing the accuracy of predictors of mortality in ventilator‐associated pneumonia. J. Bras. Pneumol. 2011; 37: 495–503. [DOI] [PubMed] [Google Scholar]
- 28. Duflo F, Debon R, Monneret G, Bienvenu J, Chassard D, Allaouchiche B. Alveolar and serum procalcitonin: diagnostic and prognostic value in ventilator‐associated pneumonia. Anesthesiology 2002; 96: 74–79. [DOI] [PubMed] [Google Scholar]
- 29. Luyt CE, Guérin V, Combes A, Trouillet JL, Ayed SB, Bernard M, Gibert C, Chastre J. Procalcitonin kinetics as a prognostic marker of ventilator‐associated pneumonia. Am. J. Respir. Crit. Care Med. 2005; 171: 48–53. [DOI] [PubMed] [Google Scholar]
- 30. Savva A, Raftogiannis M, Baziaka F, Routsi C, Antonopoulou A, Koutoukas P, Tsaganos T, Kotanidou A, Apostolidou E, Giamarellos‐Bourboulis EJ et al Soluble urokinase plasminogen activator receptor (suPAR) for assessment of disease severity in ventilator‐associated pneumonia and sepsis. J. Infect. 2011; 63: 344–350. [DOI] [PubMed] [Google Scholar]
- 31. Zielińska‐Borkowska U, Skirecki T, Złotorowicz M, Czarnocka B. Procalcitonin in early onset ventilator‐associated pneumonia. J. Hosp. Infect. 2012; 81: 92–97. [DOI] [PubMed] [Google Scholar]
- 32. Andrijevic I, Matijasevic J, Andrijevic L, Kovacevic T, Zaric B. Interleukin‐6 and procalcitonin as biomarkers in mortality prediction of hospitalized patients with community acquired pneumonia. Ann. Thorac. Med. 2014; 9: 162–167. [DOI] [PMC free article] [PubMed] [Google Scholar]
- 33. Masiá M, Gutiérrez F, Shum C, Padilla S, Navarro JC, Flores E, Hernández I. Usefulness of procalcitonin levels in community‐acquired pneumonia according to the patients outcome research team pneumonia severity index. Chest 2005; 128: 2223–2229. [DOI] [PubMed] [Google Scholar]
- 34. Huang DT, Weissfeld LA, Kellum JA, Yealy DM, Kong L, Martino M, Angus DC, GenIMS Investigators . Risk prediction with procalcitonin and clinical rules in community‐acquired pneumonia. Ann. Emerg. Med. 2008; 52: 48–58, e42. [DOI] [PMC free article] [PubMed] [Google Scholar]
- 35. Kasamatsu Y, Yamaguchi T, Kawaguchi T, Tanaka N, Oka H, Nakamura T, Yamagami K, Yoshioka K, Imanishi M. Usefulness of a semi‐quantitative procalcitonin test and the A‐DROP Japanese prognostic scale for predicting mortality among adults hospitalized with community‐acquired pneumonia. Respirology 2012; 17: 330–336. [DOI] [PubMed] [Google Scholar]
- 36. Krüger S, Ewig S, Marre R, Papassotiriou J, Richter K, von Baum H, Suttorp N, Welte T. Procalcitonin predicts patients at low risk of death from community‐acquired pneumonia across all CRB‐65 classes. Eur. Respir. J. 2008; 31: 349–355. [DOI] [PubMed] [Google Scholar]
- 37. Lacoma A, Rodríguez N, Prat C, Ruiz‐Manzano J, Andreo F, Ramírez A, Bas A, Pérez M, Ausina V, Domínguez J. Usefulness of consecutive biomarkers measurement in the management of community‐acquired pneumonia. Eur. J. Clin. Microbiol. Infect. Dis. 2012; 31: 825–833. [DOI] [PubMed] [Google Scholar]
- 38. Liu B, Yin Q, Chen YX, Zhao YZ, Li CS. Role of Presepsin (sCD14‐ST) and the CURB65 scoring system in predicting severity and outcome of community‐acquired pneumonia in an emergency department. Respir. Med. 2014; 108: 1204–1213. [DOI] [PubMed] [Google Scholar]
- 39. Park JH, Wee JH, Choi SP, Oh SH. The value of procalcitonin level in community‐acquired pneumonia in the ED. Am. J. Emerg. Med. 2012; 30: 1248–1254. [DOI] [PubMed] [Google Scholar]
- 40. Ugajin M, Yamaki K, Hirasawa N, Yagi T. Predictive values of semi‐quantitative procalcitonin test and common biomarkers for the clinical outcomes of community‐acquired pneumonia. Respir. Care 2014; 59: 564–573. [DOI] [PubMed] [Google Scholar]
- 41. Schuetz P, Suter‐Widmer I, Chaudri A, Christ‐Crain M, Zimmerli W, Mueller B. Prognostic value of procalcitonin in community‐acquired pneumonia. Eur. Respir. J. 2011; 37: 384–392. [DOI] [PubMed] [Google Scholar]
- 42. Haeuptle J, Zaborsky R, Fiumefreddo R, Trampuz A, Steffen I, Frei R, Christ‐Crain M, Müller B, Schuetz P. Prognostic value of procalcitonin in Legionella pneumonia. Eur. J. Clin. Microbiol. Infect. Dis. 2009; 28: 55–60. [DOI] [PubMed] [Google Scholar]
- 43. Porfyridis I, Georgiadis G, Vogazianos P, Mitis G, Georgiou A. C‐reactive protein, procalcitonin, clinical pulmonary infection score, and pneumonia severity scores in nursing home acquired pneumonia. Respir. Care 2014; 59: 574–581. [DOI] [PubMed] [Google Scholar]
- 44. Mandell LA, Wunderink RG, Anzueto A, Bartlett JG, Campbell GD, Dean NC, Dowell SF, File TM Jr, Musher DM, Niederman MS et al Infectious Diseases Society of America/American Thoracic Society consensus guidelines on the management of community‐acquired pneumonia in adults. Clin. Infect. Dis. 2007; 44: S27–72. [DOI] [PMC free article] [PubMed] [Google Scholar]
- 45. Marrie TJ, Huang JQ. Admission is not always necessary for patients with community‐acquired pneumonia in risk classes IV and V diagnosed in the emergency room. Can. Respir. J. 2007; 14: 212–216. [DOI] [PMC free article] [PubMed] [Google Scholar]
- 46. Loke YK, Kwok CS, Niruban A, Myint PK. Value of severity scales in predicting mortality from community‐acquired pneumonia: systematic review and meta‐analysis. Thorax 2010; 65: 884–890. [DOI] [PubMed] [Google Scholar]
- 47. Hausfater P, Garric S, Ayed SB, Rosenheim M, Bernard M, Riou B. Usefulness of procalcitonin as a marker of systemic infection in emergency department patients: a prospective study. Clin. Infect. Dis. 2002; 34: 895–901. [DOI] [PubMed] [Google Scholar]
Associated Data
This section collects any data citations, data availability statements, or supplementary materials included in this article.
Supplementary Materials
Appendix S1 Example search strategy for PubMed.
Table S1 QUADAS‐2 results of included studies.