Abstract
Objective
Bone mineral density has been reported to negatively associate with nonalcoholic fatty liver disease. Osteocalcin, a bone formation marker and metabolic regulator, has been previously evaluated as the mediator between bone mineral density and nonalcoholic fatty liver disease. Herein, we aimed to investigate the correlations of nonalcoholic fatty liver disease with bone mineral density and serum osteocalcin levels in Korean men.
Methods
A total of 859 men (249 and 610 men with and without nonalcoholic fatty liver disease, respectively) were recruited for this retrospective cross-sectional study. All participants underwent hepatic ultrasonography and dual energy X-ray absorptiometry. Anthropometric and biochemical data, including the serum osteocalcin levels and homeostasis model assessment of insulin resistance (HOMA-IR), were collected.
Results
Nonalcoholic fatty liver disease negatively associated with right-hip bone mineral density (odds ratio, 0.797; 95% confidence interval, 0.645–0.984; P=0.035) and serum osteocalcin (odds ratio, 0.948; 95% confidence interval, 0.910–0.988; P=0.011) after adjusting for BMI and HOMA-IR. The mean right-hip bone mineral density was lower in men with versus without nonalcoholic fatty liver disease after adjusting for serum osteocalcin, BMI and HOMA-IR (0.11±0.06 vs. 0.29±0.04; P=0.019).
Conclusion
Nonalcoholic fatty liver disease negatively associated with right-hip bone mineral density and serum osteocalcin in Korean men. General population-based prospective studies evaluating the causal relationship between bone metabolism and nonalcoholic fatty liver disease are needed, and the mechanism linking nonalcoholic fatty liver disease to bone mineral density beyond insulin resistance and osteocalcin should be evaluated in the future.
Keywords: bone density, insulin resistance, nonalcoholic fatty liver disease, osteocalcin
Introduction
Nonalcoholic fatty liver disease (NAFLD) is defined as fatty infiltration of the liver proven by histology or radiology, in the absence of secondary causes of hepatitis such as alcoholic liver disease, drug-induced liver disease and viral hepatitis 1. NAFLD is the most common chronic liver disease in developed countries; in Korea, the reported prevalence of NAFLD ranges between 16 and 33% 2. NAFLD is associated with a risk of progression to cirrhosis and hepatocellular carcinoma 1. Moreover, the effects of NAFLD are not only confined to the liver, but also expand to the extrahepatic organs 2. The mechanism of this influence of NAFLD on the extrahepatic internal organs has been demonstrated to be associated with insulin resistance and chronic inflammation, while the exact pathophysiology remains unclear 2.
Low bone mineral density (BMD) and osteoporosis are important contributors to osteoporotic fractures, which can consequently result in disability and secondary medical problems because of immobilization. Besides the traditional risk factors of osteoporotic fractures, such as older age, decreased BMI, current smoking and excessive alcohol consumption 3, insulin resistance and metabolic derangement have also been considered as factors associated with BMD 4–7. Moreover, low BMD or osteoporotic fracture has been described not only in cholestatic liver disease and cirrhosis but also in noncirrhotic chronic liver diseases such as alcoholic liver disease and viral hepatitis 8–11. NAFLD is the most common chronic liver disease associated with insulin resistance and metabolic derangement; thus, bone metabolism in patients with NAFLD needs to be investigated. Recently, low BMD in patients with NAFLD was reported 12–14. However, there are currently only few studies in adult men 13–15.
The pathophysiology linking bone metabolism and NAFLD is not clearly understood. Insulin resistance, chronic inflammation, 25-hydroxyvitamin D3, adipokines such as leptin and adiponectin, osteocalcin (OC) and osteoprotegerin from osteoblasts, and osteopontin have been considered as mediators of the interactions between the liver, adipose tissue and bone 16,17. Among these, OC is an osteoblast-derived 49 amino acid-long noncollagen protein of the bone matrix. OC exists in two forms, carboxylated and undercarboxylated OC 18. Undercarboxylated OC is the active form 18, and acts as an insulin secretagogue, an insulin sensitiser and a protector against fatty infiltration and inflammation of the adipose tissue, liver and skeletal muscle 17. On the other hand, the role of carboxylated OC binding to hydroxyapatite of the bone matrix in bone formation and mineralization is unclear 19. Of note, resorption of the bone matrix by osteoclasts results in the release and decarboxylation of bound carboxylated OC 18. Thus, serum OC levels function as a marker of bone remodelling activity, irrespective of the predominance of formation or resorption. Several human epidemiological studies have demonstrated the relationship between serum OC levels and NAFLD, although the results are inconclusive 20–23.
Thus, with this in mind, our study aimed to investigate the correlations of NAFLD with BMD and serum OC levels in Korean men.
Methods
Data were collected retrospectively from 2227 men aged 20–69 years who underwent hepatic ultrasonography, dual energy X-ray absorptiometry and serum OC measurement for health screening at Sungkyunkwan University Samsung Changwon hospital between January 2011 and December 2013.
The exclusion criteria were as follows: (a) absence of interview record (n=268); (b) absence of information regarding alcohol consumption (n=117); (c) absence of information regarding smoking (n=233); (d) positive serologic hepatitis B surface antigen (n=108); (e) positive serologic hepatitis C antibody (n=11); (f) excessive alcohol consumption of greater than or equal to 210 g/week (n=633); (g) history of malignancy, chronic use of medication, present illness or past history influencing the liver function or BMD (n=260); (h) medication for diabetes, hypertension or dyslipidaemia (n=186); and (i) metal implant in the right hip (n=2) (Fig. 1).
Fig. 1.
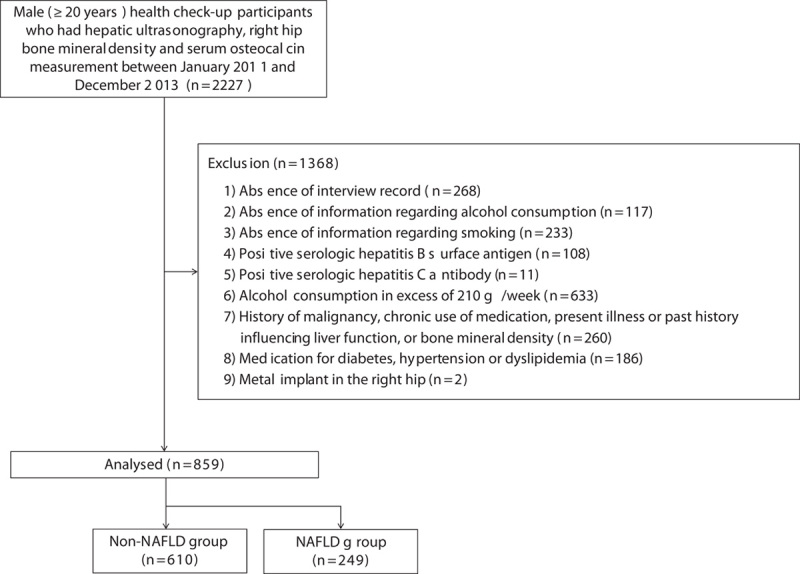
Flow chart of the study. NAFLD, nonalcoholic fatty liver disease.
Finally, 859 men were enrolled in this retrospective cross-sectional study. The patients were divided into the NAFLD (n=249) and non-NAFLD groups (n=610).
Weight, height, systolic blood pressure and diastolic blood pressure were measured. BMI was calculated by dividing the body weight (kg) by the square of height (m). The blood of each individual was sampled after overnight fasting. The aspartate aminotransferase, alanine aminotransferase, gamma-glutamyl transpeptidase, glucose, insulin, LDL cholesterol, triglyceride, HDL cholesterol, calcium and phosphorus levels were measured. The serum OC levels were determined by the electrochemiluminescence method using the Elecsys N-MID Osteocalcin kit (Roche Diagnostics, Mannheim, Germany) and Modular Analytics E170 (Roche Diagnostics).
The homeostasis model assessment of insulin resistance (HOMA-IR) was calculated by the following equation:
Data about smoking status and the amount of alcohol consumption (g/week) were collected from previously self-reported questionnaires. A current smoker was defined as a subject who had smoked in the previous year from the date of completing the questionnaire.
BMD was measured by dual energy X-ray absorptiometry (Lunar Radiation Co., Madison, Wisconsin, USA). The right-hip BMD of each subject was determined and presented as the T-score.
The presence of fatty infiltration of the liver was diagnosed by experienced sonographists. Presence of NAFLD was defined as higher echogenicity of the liver parenchyma, as compared with that of the right kidney; bright echo in the liver parenchyma; and blurring of the intrahepatic architecture on the hepatic ultrasonography.
The protocol of our study was approved by the Institutional Review Board of Sungkyunkwan University Samsung Changwon hospital (2014-SCMC-076-00). The need for informed consent was waived by the Institutional Review Board as the study was retrospective in nature.
Statistical analysis
PASW Statistics Window, version 18.0 (IBM Co., Armonk, New York, USA) was used for all analyses. Continuous variables were presented as mean and SD. Categorical variables were presented as number and proportion.
The differences in the means of continuous variables between the NAFLD and non-NAFLD groups were compared using Student’s t-test and the Mann–Whitney U-test. Differences in frequencies of categorical variables between the groups were compared by the χ2-test.
The correlations of the serum OC levels with other variables were evaluated using multiple backward linear regression analysis, including variables that showed significant correlations in the simple linear regression analysis. Before linear regression analysis, skewed variables were normalized by logarithmic transformation and variables with collinearity were determined as a variance proportion in excess of 0.6 in the model, with a conditional index greater than 30.
The relationships between right-hip BMD and other variables were analysed by multiple backward linear regression analysis, including variables that showed significant correlation in the simple linear regression analysis.
The associations of NAFLD with right-hip BMD and serum OC levels were determined by using multiple backward Wald binary logistic regression analysis, including variables that showed a significant correlation with serum OC or right-hip BMD in the multiple linear regression analysis.
The difference in the adjusted mean of the right-hip BMD (T-score) in subjects with versus without NAFLD was evaluated by the analysis of covariance. All P values were two tailed, and P less than 0.05 was considered statistically significant.
Results
Baseline demographic and clinical characteristics
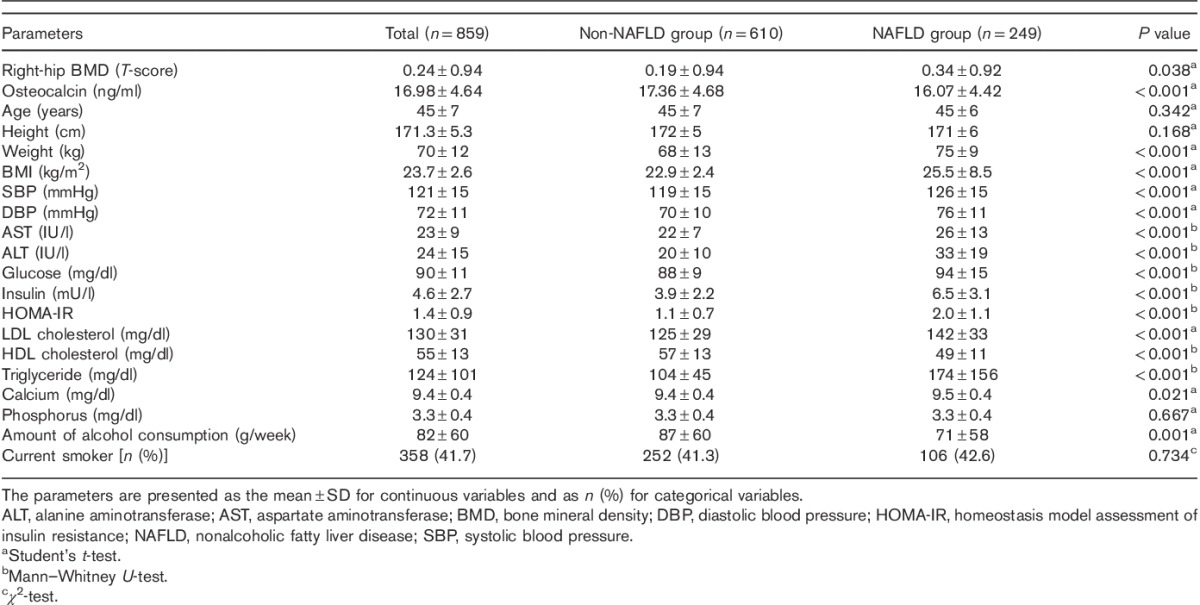
Among the included 859 subjects (mean age, 45±7 years), 249 subjects had NAFLD (29%). The mean T-score of the right-hip BMD was 0.24±0.94. The mean serum OC level was 16.98±4.64 ng/ml (Table 1).
Table 1.
Baseline demographic and clinical characteristics of the study population
Correlations of the serum OC levels with other variables
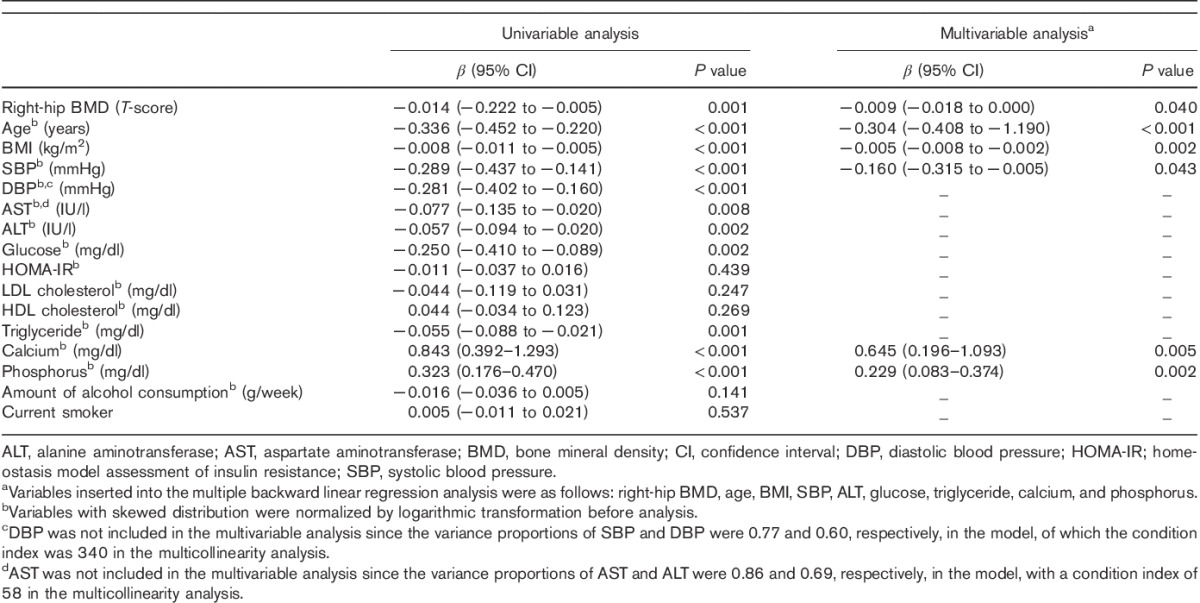
The serum OC levels were inversely correlated with the right-hip BMD [β=−0.009; 95% confidence interval (CI), −0.018 to 0.000; P=0.040], age (β=−0.304; 95% CI, −0.408 to −1.190; P<0.001), BMI (β=−0.005; 95% CI, −0.008 to 0.002; P=0.002) and systolic blood pressure (β=−0.160; 95% CI, −0.315 to −0.005; P=0.043), and positively correlated with the serum calcium (β=0.645; 95% CI, 0.196–1.093; P=0.005) and phosphorus levels (β=0.229; 95% CI, 0.083–0.374; P=0.002) (Table 2).
Table 2.
Correlation between serum osteocalcin levels and other variables
Correlations of right-hip BMD (T-score) with other variables
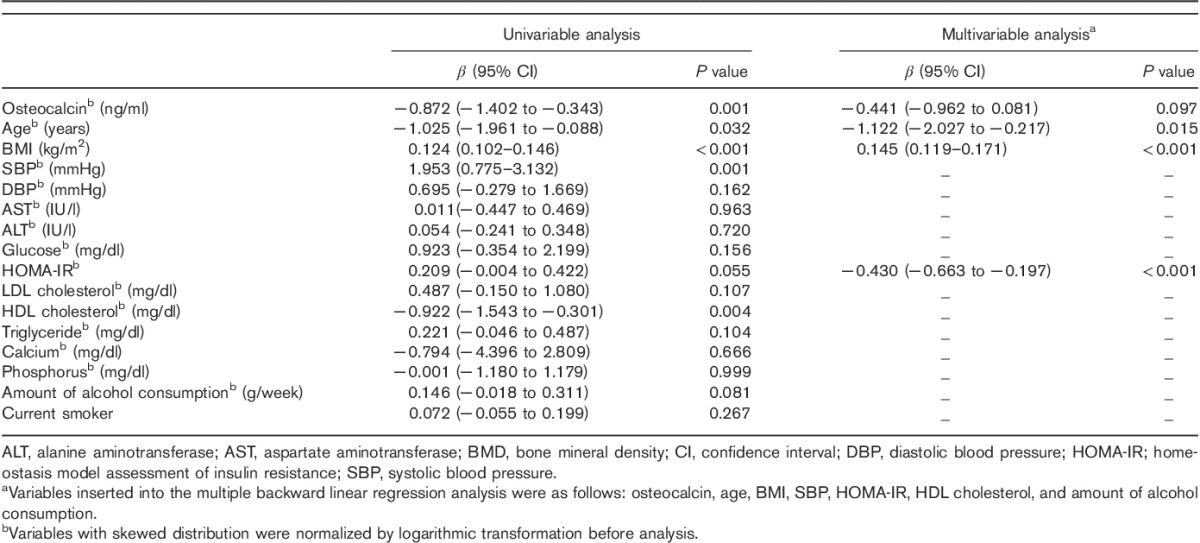
The right-hip BMD was inversely correlated with age (β=−1.122; 95% CI, −2.027 to −0.217; P=0.015) and HOMA-IR (β=−0.430; 95% CI, −0.663 to −0.197; P<0.001), and positively correlated with BMI (β=0.145; 95% CI, 0.119–0.171; P<0.001). No independent correlation between the right-hip BMD and serum OC level was found (β=−0.441; 95% CI, −0.962 to 0.081; P=0.097) (Table 3).
Table 3.
Correlations between the T-score of right-hip BMD and other variables
Associations of NAFLD with right-hip BMD and serum OC levels
NAFLD was negatively associated with the right-hip BMD [odds ratio (OR), 0.797; 95% CI, 0.645–0.984; P=0.035] and serum OC levels (OR, 0.948; 95% CI, 0.910–0.988; P=0.011), and positively associated with BMI (OR, 1.460; 95% CI, 1.336–1.594; P<0.001) and HOMA-IR (OR, 2.508; 95% CI, 1.992–3.159; P<0.001) (Table 4).
Table 4.
Associations of NAFLD with right-hip BMD and osteocalcin levels

Differences in the mean serum OC levels and T-scores of right-hip BMD in subjects with versus without NAFLD
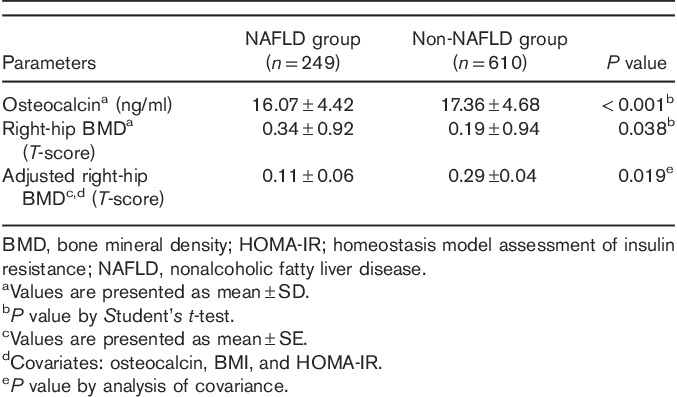
The mean serum OC levels were lower in men with versus without NAFLD (16.07±4.42 vs. 17.36±4.68 ng/ml; P<0.001). The mean T-score of right-hip BMD was higher in men with versus without NAFLD (0.34±0.92 vs. 0.19±0.94; P=0.038). Finally, the mean right-hip BMD was lower in men with NAFLD than in those without NAFLD after adjusting for the serum OC levels, BMI and HOMA-IR (0.11±0.06 vs. 0.29±0.04; P=0.019) (Table 5).
Table 5.
Means and adjusted means of the serum osteocalcin levels and right-hip BMD
Discussion
In this study, the serum OC levels predominantly associated with factors related to bone metabolism, such as BMD and serum calcium and phosphorus levels, rather than those related to glucose and energy metabolism. This result was inconsistent with some previous reports. In animal and in-vitro models, obvious correlations between OC and metabolic derangements have been demonstrated. In one study, OC-deficient mice fed a high fat diet were demonstrated to show glucose intolerance and insulin resistance, whereas administration of recombinant OC improved these metabolic derangements 24,25. Moreover, human epidemiologic studies have demonstrated that the serum OC levels correlate with glucose intolerance, insulin resistance, obesity, and metabolic syndrome 26–28. We speculate that the highly selective subjects in this study contributed to the finding of predominant associations between the serum OC levels and bone metabolism factors. The subjects were all recruited from health screening participants of the working population in small-to-large businesses, and we excluded subjects with medication for diabetes, dyslipidaemia or hypertension. Thus, the baseline demographic indicated that the subjects of our study tended to have relatively few metabolic derangements. This might have augmented the role of OC as a marker of bone formation, while attenuating its role in energy and glucose metabolism.
In this study, insulin resistance was found to be a negative determinant of bone metabolism, besides the traditional determinants of bone metabolism such as BMI and age. It has been previously reported that insulin resistance is negatively associated with BMD in women with type 2 diabetes, and a higher BMD, but increased risk of hip fracture in patients with type 2 diabetes has also been demonstrated 4,7,29,30. Several animal models and in-vitro studies support this negative association between BMD and insulin resistance. For example, high fat diet-induced insulin resistance impairs osteoblast proliferation and survival resulting in osteoporosis 31, and cytokines such as C-reactive protein and interleukin-6, which induce chronic inflammation, have been shown to result in low BMD in insulin resistant states 32. Moreover, low insulin-like growth factor-1 and high fibroblast growth factor-23 levels in insulin resistant states negatively affect the BMD 33. Interestingly, in the present study, the correlation between right-hip BMD and serum OC levels disappeared when HOMA-IR was inserted during the multiple linear regression analysis. This suggests that the serum OC levels are not a passive marker of bone remodelling, but rather an indirect regulator of bone metabolism via the secretion and sensitization of insulin.
NAFLD was negatively associated with the serum OC levels in this study. OC-deficient mice with metabolic derangements resulting from a Western-style high-fat, high-cholesterol diet have been demonstrated to have a higher frequency of NAFLD, and administration of recombinant OC improved the NAFLD in one previous study 34. However, population-based studies have failed to demonstrate consistent results regarding the association between serum OC levels and NAFLD 20–23. Aller et al. 20 and Dou et al. 22 reported that the serum OC levels were not independently associated with histologic changes in NAFLD and ultrasonography-proven NAFLD, respectively, whereas Yilmaz et al. 21 and Sinn et al. 23 reported that the serum OC levels were associated with hepatocyte ballooning degeneration and ultrasonography-proven NAFLD in women with normal BMD, respectively. The discrepancies between epidemiological studies and animal and in-vitro studies might be explained by the following. First, in most epidemiologic studies, as well as in the present study, undercarboxylated OC, considered as the metabolic active form, was not measured; instead, the total OC levels were evaluated. Total OC levels might insufficiently represent the metabolic role of OC. Second, in many epidemiologic studies, artificial OC-deficient models were unavailable. Inconsistencies between population-based studies might also be due to differences in the ethnicity, sex, age groups and bone remodelling status of the study subjects.
Our results indicated that NAFLD is negatively associated with right-hip BMD. This result was similar to those of Moon et al. 12, who investigated postmenopausal women, and of Cui et al. 13, who analysed men and women aged more than or equal to 40 years. However, the dependent variables representing bone metabolism were different in these studies. Moon et al. 12 used the mean lumbar-vertebral BMD, whereas Cui et al. 13 used the femoral-neck, right-hip, lumbar-vertebral BMD and the means of these BMDs. Herein, we selected the T-score of the right-hip BMD as it was normally distributed, whereas the T-scores of the femoral-neck and lumbar-vertebral BMD were not. Furthermore, the right-hip and femoral-neck BMD are known to better reflect the risk of fracture than is lumbar-vertebral BMD 3.
Our results indicated that NAFLD and BMD correlated independent of the BMI, insulin resistance and serum OC levels. Thus, further studies are required to focus on chronic inflammation, central adiposity, serum vitamin D levels and physical activity to investigate the exact mechanism linking NAFLD to BMD 16,17.
The strengths of our study included the relatively large sample size and clear process in recruiting the NAFLD and normal groups. However, this study had several limitations. First, the retrospective cross-sectional nature of the study failed to explain the causal and temporal relationship between BMD and NAFLD. Second, highly selective subjects were recruited, and further prospective studies with a general population, including women, are needed. Third, ultrasonography was used to diagnose NAFLD. The gold standard for diagnosis of NAFLD is liver biopsy. However, liver biopsy is not frequently used in epidemiological studies and in the clinic because of its invasiveness and complications such as bleeding and pain. On the other hand, ultrasonography is a noninvasive and easily accessible method for the diagnosis of NAFLD. Fourth, chronic inflammation markers, including tumour necrosis factor-α and interleukin-6; central adiposity, including waist circumference and adiponectin levels; serum vitamin D levels; and physical activity, which might all affect the BMD, were not evaluated 16,17. Lastly, total OC rather than undercarboxylated OC, which is considered the active form, was measured.
In conclusion, this study showed that NAFLD was negatively associated with the right-hip BMD and serum OC levels. General population-based prospective studies to evaluate the causal relationship between bone metabolism and NAFLD are needed in the future. In addition, the mechanisms linking NAFLD to BMD, beyond insulin resistance and OC, should be evaluated.
Acknowledgements
Author contributions: Hae Jin Yang and Sang Goon Shim designed the research. Hae Jin Yang, Bong Oh Ma, and Ji Yeong Kwak performed the research. Hae Jin Yang and Bong Oh Ma performed statistical analysis. Hae Jin Yang wrote the manuscript.
Conflicts of interest
There are no conflicts of interest.
References
- 1.Chalasani N, Younossi Z, Lavine JE, Diehl AM, Brunt EM, Cusi K, et al. The diagnosis and management of non-alcoholic fatty liver disease: practice Guideline by the American Association for the Study of Liver Diseases, American College of Gastroenterology, and the American Gastroenterological Association. Hepatology 2012; 55:2005–2023. [DOI] [PubMed] [Google Scholar]
- 2.Korean Association for the Study of the Liver (KASL). KASL clinical practice guidelines: management of nonalcoholic fatty liver disease. Clin Mol Hepatol 2013; 19:325–348. [DOI] [PMC free article] [PubMed] [Google Scholar]
- 3.Cosman F, de Beur SJ, LeBoff MS, Lewiecki EM, Tanner B, Randall S, et al. Clinician’s guide to prevention and treatment of osteoporosis. Osteoporos Int 2014; 25:2359–2381. [DOI] [PMC free article] [PubMed] [Google Scholar]
- 4.Faulhaber GA, Premaor MO, Moser Filho HL, Silla LM, Furlanetto TW. Low bone mineral density is associated with insulin resistance in bone marrow transplant subjects. Bone Marrow Transplant 2009; 43:953–957. [DOI] [PubMed] [Google Scholar]
- 5.Petit MA, Paudel ML, Taylor BC, Hughes JM, Strotmeyer ES, Schwartz AV, et al. Bone mass and strength in older men with type 2 diabetes: the Osteoporotic Fractures in Men Study. J Bone Miner Res 2010; 25:285–291. [DOI] [PMC free article] [PubMed] [Google Scholar]
- 6.von Muhlen D, Safii S, Jassal SK, Svartberg J, Barrett-Connor E. Associations between the metabolic syndrome and bone health in older men and women: the Rancho Bernardo Study. Osteoporos Int 2007; 18:1337–1344. [DOI] [PubMed] [Google Scholar]
- 7.Arikan S, Tuzcu A, Bahceci M, Ozmen S, Gokalp D. Insulin resistance in type 2 diabetes mellitus may be related to bone mineral density. J Clin Densitom 2012; 15:186–190. [DOI] [PubMed] [Google Scholar]
- 8.Collier J. Bone disorders in chronic liver disease. Hepatology 2007; 46:1271–1278. [DOI] [PubMed] [Google Scholar]
- 9.Solaymani-Dodaran M, Card TR, Aithal GP, West J. Fracture risk in people with primary biliary cirrhosis: a population-based cohort study. Gastroenterology 2006; 131:1752–1757. [DOI] [PubMed] [Google Scholar]
- 10.Menon KV, Angulo P, Weston S, Dickson ER, Lindor KD. Bone disease in primary biliary cirrhosis: independent indicators and rate of progression. J Hepatol 2001; 35:316–323. [DOI] [PubMed] [Google Scholar]
- 11.Jin LH, Chang SJ, Koh SB, Kim KS, Lee TY, Ryu SY, et al. Association between alcohol consumption and bone strength in Korean adults: the Korean Genomic Rural Cohort Study. Metabolism 2011; 60:351–358. [DOI] [PubMed] [Google Scholar]
- 12.Moon SS, Lee YS, Kim SW. Association of nonalcoholic fatty liver disease with low bone mass in postmenopausal women. Endocrine 2012; 42:423–429. [DOI] [PubMed] [Google Scholar]
- 13.Cui R, Sheng H, Rui XF, Cheng XY, Sheng CJ, Wang JY, et al. Low bone mineral density in chinese adults with nonalcoholic fatty liver disease. Int J Endocrinol 2013; 2013:396545. [DOI] [PMC free article] [PubMed] [Google Scholar]
- 14.Pardee PE, Dunn W, Schwimmer JB. Non-alcoholic fatty liver disease is associated with low bone mineral density in obese children. Aliment Pharmacol Ther 2012; 35:248–254. [DOI] [PMC free article] [PubMed] [Google Scholar]
- 15.Purnak T, Beyazit Y, Ozaslan E, Efe C, Hayretci M. The evaluation of bone mineral density in patients with nonalcoholic fatty liver disease. Wien Klin Wochenschr 2012; 124:526–531. [DOI] [PubMed] [Google Scholar]
- 16.Yilmaz Y. Review article: non-alcoholic fatty liver disease and osteoporosis – clinical and molecular crosstalk. Aliment Pharmacol Ther 2012; 36:345–352. [DOI] [PubMed] [Google Scholar]
- 17.Musso G, Paschetta E, Gambino R, Cassader M, Molinaro F. Interactions among bone, liver, and adipose tissue predisposing to diabesity and fatty liver. Trends Mol Med 2013; 19:522–535. [DOI] [PubMed] [Google Scholar]
- 18.Ducy P. The role of osteocalcin in the endocrine cross-talk between bone remodelling and energy metabolism. Diabetologia 2011; 54:1291–1297. [DOI] [PubMed] [Google Scholar]
- 19.Ducy P, Desbois C, Boyce B, Pinero G, Story B, Dunstan C, et al. Increased bone formation in osteocalcin-deficient mice. Nature 1996; 382:448–452. [DOI] [PubMed] [Google Scholar]
- 20.Aller R, Castrillon JL, de Luis DA, Conde R, Izaola O, Sagrado MG, et al. Relation of osteocalcin with insulin resistance and histopathological changes of non alcoholic fatty liver disease. Ann Hepatol 2011; 10:50–55. [PubMed] [Google Scholar]
- 21.Yilmaz Y, Kurt R, Eren F, Imeryuz N. Serum osteocalcin levels in patients with nonalcoholic fatty liver disease: association with ballooning degeneration. Scand J Clin Lab Invest 2011; 71:631–636. [DOI] [PubMed] [Google Scholar]
- 22.Dou J, Ma X, Fang Q, Hao Y, Yang R, Wang F, et al. Relationship between serum osteocalcin levels and non-alcoholic fatty liver disease in Chinese men. Clin Exp Pharmacol Physiol 2013; 40:282–288. [DOI] [PubMed] [Google Scholar]
- 23.Sinn DH, Gwak GY, Rhee SY, Cho J, Son HJ, Paik YH, et al. Association between serum osteocalcin levels and non-alcoholic fatty liver disease in women. Digestion 2015; 91:150–157. [DOI] [PubMed] [Google Scholar]
- 24.Ferron M, Hinoi E, Karsenty G, Ducy P. Osteocalcin differentially regulates beta cell and adipocyte gene expression and affects the development of metabolic diseases in wild-type mice. Proc Natl Acad Sci USA 2008; 105:5266–5270. [DOI] [PMC free article] [PubMed] [Google Scholar]
- 25.Ferron M, McKee MD, Levine RL, Ducy P, Karsenty G. Intermittent injections of osteocalcin improve glucose metabolism and prevent type 2 diabetes in mice. Bone 2012; 50:568–575. [DOI] [PMC free article] [PubMed] [Google Scholar]
- 26.Pittas AG, Harris SS, Eliades M, Stark P, Dawson-Hughes B. Association between serum osteocalcin and markers of metabolic phenotype. J Clin Endocrinol Metab 2009; 94:827–832. [DOI] [PMC free article] [PubMed] [Google Scholar]
- 27.Yeap BB, Chubb SA, Flicker L, McCaul KA, Ebeling PR, Beilby JP, et al. Reduced serum total osteocalcin is associated with metabolic syndrome in older men via waist circumference, hyperglycemia, and triglyceride levels. Eur J Endocrinol 2010; 163:265–272. [DOI] [PubMed] [Google Scholar]
- 28.Hwang YC, Jeong IK, Ahn KJ, Chung HY. Circulating osteocalcin level is associated with improved glucose tolerance, insulin secretion and sensitivity independent of the plasma adiponectin level. Osteoporos Int 2012; 23:1337–1342. [DOI] [PMC free article] [PubMed] [Google Scholar]
- 29.Greco EA, Francomano D, Fornari R, Marocco C, Lubrano C, Papa V, et al. Negative association between trunk fat, insulin resistance and skeleton in obese women. World J Diabetes 2013; 4:31–39. [DOI] [PMC free article] [PubMed] [Google Scholar]
- 30.Ishii S, Cauley JA, Crandall CJ, Srikanthan P, Greendale GA, Huang MH, et al. Diabetes and femoral neck strength: findings from the Hip Strength Across the Menopausal Transition Study. J Clin Endocrinol Metab 2012; 97:190–197. [DOI] [PMC free article] [PubMed] [Google Scholar]
- 31.Pramojanee SN, Phimphilai M, Kumphune S, Chattipakorn N, Chattipakorn SC. Decreased jaw bone density and osteoblastic insulin signaling in a model of obesity. J Dent Res 2013; 92:560–565. [DOI] [PubMed] [Google Scholar]
- 32.Tarantino G, Savastano S, Colao A. Hepatic steatosis, low-grade chronic inflammation and hormone/growth factor/adipokine imbalance. World J Gastroenterol 2010; 16:4773–4783. [DOI] [PMC free article] [PubMed] [Google Scholar]
- 33.Férnandez-Real JM, Puig J, Serrano M, Sabater M, Rubió A, Moreno-Navarrete JM, et al. Iron and obesity status-associated insulin resistance influence circulating fibroblast-growth factor-23 concentrations. PLoS One 2013; 8:e58961. [DOI] [PMC free article] [PubMed] [Google Scholar]
- 34.Gupte AA, Sabek OM, Fraga D, Minze LJ, Nishimoto SK, Liu JZ, et al. Osteocalcin protects against nonalcoholic steatohepatitis in a mouse model of metabolic syndrome. Endocrinology 2014; 155:4697–4705. [DOI] [PMC free article] [PubMed] [Google Scholar]


