

Abstract
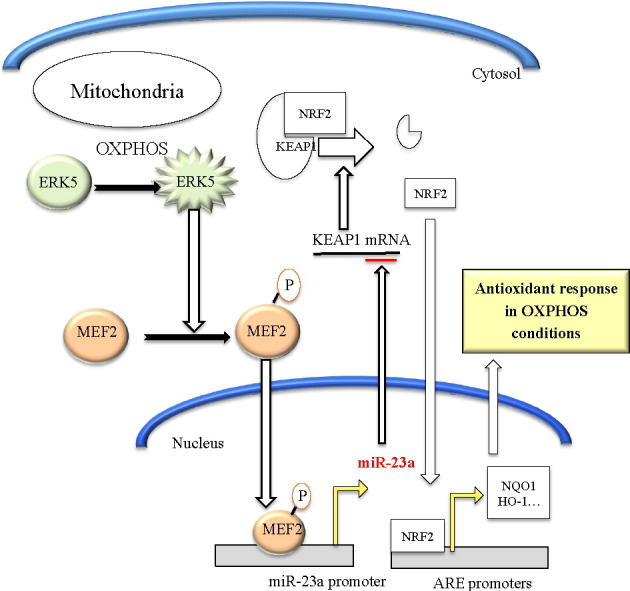
Tumor cell metabolism is altered during leukemogenesis. Cells performing oxidative phosphorylation (OXPHOS) generate reactive oxygen species (ROS) through mitochondrial activity. To limit the deleterious effects of excess ROS, certain gene promoters contain antioxidant response elements (ARE), e.g. the genes NQO-1 and HO-1. ROS induces conformational changes in KEAP1 and releases NRF2, which activates AREs. We show in vitro and in vivo that OXPHOS induces, both in primary leukemic cells and cell lines, de novo expression of NQO-1 and HO-1 and also the MAPK ERK5 and decreases KEAP1 mRNA. ERK5 activates the transcription factor MEF2, which binds to the promoter of the miR-23a–27a–24-2 cluster. Newly generated miR-23a destabilizes KEAP1 mRNA by binding to its 3′UTR. Lower KEAP1 levels increase the basal expression of the NRF2-dependent genes NQO-1 and HO-1. Hence, leukemic cells performing OXPHOS, independently of de novo ROS production, generate an antioxidant response to protect themselves from ROS.
Keywords: Oxidative phosphorylation (OXPHOS), Mitochondria, miR-23, ERK5, MEF2, Antioxidant response elements (ARE)
Graphical abstract
Highlights
-
•
Leukemic cells performing OXPHOS increase ROS and antioxidant gene expression.
-
•
OXPHOS-mediated ERK5 activation induces miR-23 expression through MEF2.
-
•
miR-23 blocks KEAP1 expression and increases antioxidant genes.
Cells performing oxidative phosphorylation (OXPHOS) generate reactive oxygen species (ROS) through mitochondrial activity. Excess ROS is deleterious to cells; hence they should be kept at bay. We show here that leukemic cells have a genetic program that allow them to generate an antioxidant response when performing OXPHOS and this is independent of ROS generation. Because leukemic cells need protection from ROS, this pathway is a potential target for therapeutic intervention.
1. Introduction
Eukaryotic cells perform oxidative phosphorylation (OXPHOS), which uses the energy released by the mitochondrial oxidation of certain metabolites, i.e. glucose, to produce adenosine triphosphate (ATP). OXPHOS is an efficient way of releasing energy, however it produces reactive oxygen species (ROS) through mitochondrial activity. In fact, ROS and mitochondria are functionally linked in several ways (Willems et al., 2015). Most cancer cells change their metabolism from respiration/OXPHOS to anaerobic glycolysis and, hence, do not completely oxidize glucose. This is called the Warburg effect. This metabolic change is not absolute and tumor cells continue, at least partially, to perform OXPHOS (Jose and Rossignol, 2013, Obre and Rossignol, 2015, Villalba et al., 2014). Tumor cell metabolism depends on the tumor origin, patient and period, with several waves of gene regulation that modify it (Smolkova et al., 2011). In addition, tumor cell metabolism is a dynamic process with a wide remodeling of the metabolic pathways that likely occurs during tumorigenesis (Jezek et al., 2010, Bellance et al., 2009, Jose and Rossignol, 2013, Villalba et al., 2013). During these waves cells can increase OXPHOS and need to protect themselves from ROS production. In fact, low ROS levels could facilitate tumorigenesis while excessive levels are deleterious (Devasagayam et al., 2004). Therefore, they should be tightly regulated before high levels are produced.
Why most tumor cells continue performing a certain degree of OXPHOS, in spite of the dangers of high ROS levels, is still an enigma. However, it is plausible that cells possess an anti-ROS mechanism when performing OXPHOS. The MAPK extracellular signal-regulated kinase-5 (ERK5) is essential for mitochondrial function and for generating efficient antioxidant responses in leukemic cells (Charni et al., 2010, Lopez-Royuela et al., 2014). In fact, several types of oxidative stress activate ERK5 (Zhao et al., 2011), which can be considered a redox MAPK. Nuclear factor (erythroid-derived 2)-like 2 (NFE2L2 or NRF2) binds to anti-oxidant response elements (ARE) in gene promoters and, consequently, regulates oxidative stress (Kensler and Wakabayashi, 2010). In endothelial cells, steady laminar blood flow (s-flow) activates ERK5 that induces up-regulation of NRF2-dependent gene expression, although the mechanism is not fully elucidated (Kim et al., 2012, Nigro et al., 2011). Therefore, ERK5 could link OXPHOS and the antioxidant response.
MicroRNAs (miRNAs), a class of short, non-coding RNA molecules, regulate multiple physiological processes through regulating posttranscriptional gene expression by annealing to the 3′ untranslated regions of target mRNAs to generally promote mRNA degradation or translational repression (Chhabra et al., 2010). The microRNA-200a (miR-200a) activates Nrf2 transcriptional activity by degrading Kelch-like ECH-associated protein 1 (Keap1) mRNA (Eades et al., 2011). The decrease in Keap1 allows Nrf2 to escape ubiquitination and subsequent proteolysis, thus inducing its nuclear translocation. Another miR that has been linked to regulation of metabolism and the production of ROS is miR-23 (Rathore et al., 2012, Gao et al., 2009, Kulshreshtha et al., 2007). The unconventional promoter region of the miR-23a–27a–24-2 cluster lacks common promoter elements (Chhabra et al., 2010), but it contains several putative MEF2 binding sites (Rathore et al., 2012). This transcription factor mediates several ERK5 functions, including metabolic regulation (Lopez-Royuela et al., 2014) and activates a reporter plasmid driven by the 2.4 kb upstream of the miR-23a–27a–24-2 cluster promoter (Rathore et al., 2012).
We performed transcriptome analysis of Jurkat cells expressing a small hairpin RNA for ERK5 (shERK5) and compared the genes down regulated in shERK5 expressing cells with the predicted targets of miR-23a. We identified KEAP1 as a possible candidate to mediate the antioxidant response in cells performing OXPHOS. We next tested this hypothesis; the results elucidated the molecular mechanism. ERK5-mediated miR-23 upregulation controls the antioxidant response during OXPHOS by decreasing KEAP1 mRNA independently of ROS.
2. Materials & Methods
2.1. Reagents and Antibodies
RIPA buffer to prepare protein extracts was from Euromedex. The complete protease inhibitor cocktail (Complete EDTA-free) and the phosphatase inhibitor cocktail (PhosSTOP) were from Roche. H2O2 was from SIGMA and DCA from Santa Cruz Technologies. Galactose and glutamine were from GIBCO. The antibody against KEAP1 and MEF2 (E-17) were from Santa Cruz Biotechnology. ERK5 antibody was from Cell Signaling Technology. The antibody against β-Actin and HRP-labeled secondary antibodies were from Sigma.
2.2. Cell lines and Culture Conditions
The leukemic T Jurkat TAg and the OCI-AML3, NB4 and MOLM-13 AML human cell lines were grown in RPMI 1640-GlutaMAX (GIBCO) supplemented with 5% (Jurkat) or 10% (AML) FBS. In certain experiments cells were grown in RPMI 1640 without glucose (GIBCO 11879) with the addition of 2 mM glutamine and 10 mM galactose (OXPHOS medium). The Jurkat TAg cells carry the SV40 large T Ag to facilitate cell transfection.
2.3. Primary Leukemic Cells
Data and samples from patients with different hematological cancers were collected at the Oncology and Clinical Hematology Department of the CHU Montpellier, France, after patient's informed consent (Allende-Vega et al., 2015, Krzywinska et al., 2015). Patients were enrolled in two independent clinical programs approved by the “Comités de Protection des Personnes Sud Méditerranée I (ref 1324)” and ID-RCB: 2011-A00924-37. All samples from cancer patients were collected at diagnosis.
2.4. ChIP Analysis
Jurkat cells growing exponentially were cross-linked in situ and subjected to nuclear isolation, DNA shearing, preclearing, and immunoprecipitation. Procedures used were modified from the ChIP-IT kit (Active Motif) using enzymatic DNA shearing as described previously in detail (Ramachandran, 2008, Rathore et al., 2012). The Pol II (8WG16 monoclonal) ChIP antibody was from Covance. The MEF2 antibody was from Santa Cruz Technologies and the histone H3 (D2B12) XP® Rabbit mAb (ChIP Formulated) from Cell Signaling Technology.
2.5. Transient Transfection
Jurkat cells in logarithmic growth phase were transfected with the indicated amounts of plasmid by electroporation (Garaude et al., 2006, Garaude et al., 2008). In each experiment, cells were transfected with the same total amount of DNA by supplementing with empty vector. Cells were incubated for 10 min at RT with the DNA mix and electroporated at 260 mV, 960 mF in 400 μl of RPMI 1640. Expression of the different proteins was confirmed by Western blot. In all experiments related to luciferase measurement, cells were transfected with a β-Galactosidase reporter plasmid as previously described (Garaude et al., 2008). The relative luciferase units (RLU) were calculated by dividing the luciferase values between the β-Galactosidase values to avoid differences in transfection. The transfection efficiency in Jurkat TAg cells is between 60 and 80%.
2.6. Plasmids
The 3′-UTR of KEAP1 was a generous gift of Dr. Qun Zhou, University of Maryland School of Medicine (Eades et al., 2011). The sequence corresponding to the miR-23a/24-2 promoter (2046 bp upstream miR-23a precursor) was cloned into the BglII/HindIII and NheI/XhoI restriction sites of pGL3-basic vector (Saumet et al., 2009). The wild type miR-23a/24-2 locus was cloned into the EcoRI/BamHI sites of the MIE retroviral vector (containing the IRES-GFP cassette) using the following primers: sense, ggaattcgccatgcaagttgctgtagc and antisense, cgggatccggctgctaggaaggtgcg. The locus expressing only miR-24 and miR-27a (miRD23) was similarly cloned using the primers ggaattcctgagctctgccaccgagga (sense) and cgggatccggctgctaggaaggtgcg (antisense). The locus expressing only miR-23a (miRD24-27) was cloned using the primers ggaattcgccatgcaagttgctgtagc (sense) and cgggatccgccaggcacaggcttcgg (antisense) (Rathore et al., 2012).
The MEF2C constructs were a generous gift from Dr. T. Gulick and has been previously used (Lopez-Royuela et al., 2014). The expression vectors for ERK5, a constitutively active MEK5 mutant (S313D/T317D, termed MEK5D), β-galactosidase, the pSUPER expression vector for GFP alone or GFP plus shERK5 and the pSiren-retroQ-puro (BD Biosciences) retroviral vectors for shERK5 and control have been previously described (Garaude et al., 2006). The expression vectors for the catalytically inactive ERK5 mutant (ERK5KM: K84 mutated to M) in pLZR (Garaude et al., 2006) was a generous gift of Dr. Atanasio Pandiella (Centro de Investigación del Cáncer, IBMCC/CSIC-Universidad de Salamanca, Spain).
2.7. Counting and Determination of Cell Viability
Cell number, viability and cell death were analyzed with the Muse Cell Analyzer (Millipore) by incubating cells with Muse Count & Viability and Annexin V and Dead Cell kits respectively, following the manufacturer's instructions.
2.8. Induction of Oxidative Stress and ROS Measurement
Cell lines were plated at 300,000 cells/ml and treated with different H2O2 concentrations for the indicated times, harvested and counted to perform further analysis. To evaluate ROS levels, we labeled cells with CellROX® Deep Red Reagent or with CH-H2DCFDA (Life Technologies) for 30 min and analyzed them by FACs following manufacturer's instructions.
2.9. Immunoblotting
Protein analysis by immunoblotting was performed essentially as previously described (Garaude et al., 2006, Garaude et al., 2008). Briefly, samples were collected, washed out with PBS and lysed with RIPA buffer. Protein concentration was determined by BCA assay (Pierce) before electrophoresis in 4–15% TGX gels (BioRad) and equal amount of protein was loaded in each well. Protein transfer was performed in TransTurbo system (BioRad) in PVDF membranes. After blocking for 1 h with 5% non-fat milk, membranes were incubated overnight at 4 °C in agitation with primary antibodies, washed three times with TBS-Tween 0,1% and incubated with the appropriate HRP-labeled secondary antibody for 1 h. Membranes were washed out three times with TBS-Tween 0,1% and developed with Substrat HRP Immobilon Western (Millipore). Band quantification was performed using the “ImageLab” software from BioRad and represented as the ratio between the protein of interest and a control protein i.e. actin. The value of 1 is arbitrarily given to control cells. One blot representative of several experiments is shown.
2.10. In Vivo Mouse Experiments
In vivo experiments were carried out using 6 to 8 week/old NSG mice. Mice were bred and housed in pathogen-free conditions in the animal facility of the European Institute of Oncology–Italian Foundation for Cancer Research (FIRC), Institute of Molecular Oncology (Milan, Italy). All animal experiments were carried out in accordance with national and international laws and policies. For induction of acute leukemia in mice, 1 million AML cells were injected intravenously (i.v.) through the lateral tail vein in non-irradiated mice. At day 80, when human cells reached 1% in blood, mice were separated into two groups of four mice: control and DCA (50 mg/kg, 1 dose/day by gavage, starting at day 1 for 16 consecutive days). At day 140 post-graft, bone marrow and spleen were collected and mRNA isolated for analysis. We used the following human primers that did not recognize mouse mRNAs:
ERK5: Forward: (5′-CGCTACTTCCTGTACCAACTGC-3′) Reverse: (5′-AGCCATACCAAAGTCACCAATC-3′), KEAP1: Forward: (5′-GAGCGCCTGGACGTAGAACCG-3′) Reverse: (5′-GCTGCGAGTCCGAGGTCTTCC-3′), NQO-1: Forward: (5′-CCT CTA TGC CAT GAA CTT-3′) Reverse: (5′-TAT AAG CCA GAA CAG ACTC-3′), HO-1: Forward: (5′-ACA AGG AGA GCC CAG TCT TC-3′) Reverse: (5′-AGA CAG GTC ACC CAG GTA GC-3′), Actin: Forward: (5′-GAGGGAAATCGTGCGTGACA-3′) Reverse: (5′-AATAGTGATGACCTGGCCGT-3′).
2.11. Statistical Analysis
The statistical analysis of the difference between means of paired samples was performed using the paired t test. The results are given as the confidence interval (*p < 0.05, **p < 0.01, ***p < 0.005). All the experiments described in the figures with a quantitative analysis have been performed at least three times in duplicate. Other experiments were performed three times with similar results. We used actin as a loading control and the histograms represent the ratio (value of protein of interest)/(value of actin).
3. Results
3.1. OXPHOS-Induced Increase in ROS Levels is Cell Type Dependent
Leukemic cells performing OXPHOS increase ERK5 levels (Charni et al., 2010). This enzyme is essential for the antioxidant response that keeps ROS under control (Lopez-Royuela et al., 2014). To investigate if leukemic cells stably performing OXPHOS showed higher ROS levels, we incubated cells in a glucose-free culture medium with a final glutamine concentration of 4 mM and 10 mM galactose. Glutamine was used to drive mitochondria to utilize OXPHOS and galactose allowed cells to synthesize nucleic acids through the pentose phosphate pathway (Reitzer et al., 1979, Rossignol et al., 2004, Charni et al., 2010, Lopez-Royuela et al., 2014). We called it ‘OXPHOS medium’, because it forced leukemic cells to use OXPHOS as primary ATP source (Charni et al., 2010, Rathore et al., 2012, Allende-Vega et al., 2015). Three out of four leukemic cell lines cultured in OXPHOS medium for several weeks showed increased ROS levels (Fig. 1 and Supplemental Fig. 1A and B). The exception was the acute promyelocytic leukemia (APL) NB4 cell line. We also treated cells with dichloroacetate (DCA), a PDK1 inhibitor that induces OXPHOS through PDH activation in all of these leukemic cell lines (Charni et al., 2010, Allende-Vega et al., 2015). OCI and MOLM-13 AML cell lines responded by increasing ROS levels whereas NB4 did not. Jurkat, a T cell leukemia cell line, showed a minor increase. H2O2, which served as a positive control, increased ROS in all cell lines. Hence, not all leukemic cell lines increased ROS levels when performing OXPHOS.
Fig. 1.

Different ROS production by cells performing OXPHOS. Different cell lines growing in glucose (control cells) were treated with H2O2 (100 μM) for 1 h or DCA (20 mM) for 12 h or were kept in OXPHOS medium for at least 1 month. Cells were labeled with CellROX® Deep Red Reagent and analyzed by FACs.
3.2. OXPHOS Induces an Antioxidant Response
All cell lines performing OXPHOS increased ERK5 mRNA levels (Fig. 2A). This was associated with decreased KEAP1 mRNA and increased mRNA levels for the antioxidant genes NQO-1 and HO-1. Induction of OXPHOS with DCA also caused a decrease in KEAP1 and increase in NQO-1 mRNA (Fig. 2B). This was concentration and time-dependent (Supplemental Fig. 2). Interestingly, NB4 and Jurkat cells, which did not increase ROS after DCA treatment, still produced this antioxidant response. Protein expression correlated with mRNA levels in cells performing OXPHOS (Fig. 2C).
Fig. 2.

Cells performing OXPHOS activate an antioxidant response. A) Different cell lines were grown in OXPHOS medium for at least 1 month before mRNA extraction. mRNA expression was quantified by qPCR and represented as the % of mRNA compared to control cells. B) Cells were treated with 20 mM DCA for 24 and 48 h and KEAP1 and NQO1 mRNA levels were quantified by qPCR. C) The expression of different proteins was analyzed in cells growing in OXPHOS medium or treated with DCA as described above. The data represent means ± SD; *p < 0.05, **p < 0.01, ***p < 0.001 Student's t-test compared to control cells or as depicted in the graphic.
3.3. OXPHOS Induces an Antioxidant Response in Primary Leukemic Cells In Vitro and In Vivo
We validated these results in primary leukemic cells derived from 4 patients with hematological neoplasias (Fig. 3A). These cells also increased ERK5 and NQO-1 and decreased KEAP1 mRNAs, on average, following DCA treatment.
Fig. 3.

Cells performing OXPHOS activate an antioxidant response in vitro and in vivo in primary leukemic cells. A) Tumor cells from 4 hematological cancer patients (2 MM, 1 B-CLL and 1 T cell lymphoma) were treated with various concentrations of DCA for 24 h and mRNA was analyzed by qPCR. B) NSG mice were engrafted with primary human AML cells. At day 80 post-graft, they were treated with DCA (n = 4) or left untreated (n = 4). At day 140 mRNA from AML tumor cell from bone marrow or spleen was isolated and the expression of different proteins was quantified by qPCR. The data represent means ± SD; *p < 0.05, **p < 0.01, ***p < 0.001 Student's t-test compared to non treated cells or mice.
To test this in vivo, we engrafted AML primary cells in non-obese diabetic/severe combined immunodeficient (NOD/SCID)-interleukin-2 receptor γ null (NSG) mice, as previously described (Allende-Vega et al., 2015). Mice with established tumors (day 80 post-graft) were treated with DCA (Fig. 3B). The treatment was not toxic and did not show any notable effect on cell survival (Allende-Vega et al., 2015). Human tumor AML cells gather in mouse spleen and bone marrow, hence we isolated mRNA from these organs. We used human-specific primers to analyze the expression of the selected mRNAs and found an increase in ERK5 and NQO-1 and a decrease in KEAP1 mRNAs (Fig. 3B).
3.4. OXPHOS-Induced Antioxidant Response was ROS Independent
NB4, and partially Jurkat, cells did not increase ROS when performing OXPHOS, although they mounted an antioxidant response similar to other cell lines (Fig. 1, Fig. 2). To investigate further if ROS were essential for the antioxidant response, we induced oxidative stress with H2O2 in Jurkat cells and observed similar effects to those produced by OXPHOS: increase in ERK5 and NQO-1 and decrease in KEAP1 mRNAs (Fig. 4A and Supplemental Fig. 1). Hence, the increase in ROS levels could also mediate this antioxidant response. To explore this possibility, we blocked DCA-induced ROS production with the antioxidant N-acetyl-cysteine (NAC). We focused in OCI-AML3 (Fig. 4B left panels), in which DCA significantly increased ROS levels (Fig. 1). To firmly establish that DCA had a significant effect, we used a different dye to monitor ROS from that in Fig. 1. While NAC efficiently blocked the DCA-induced increase in ROS (Fig. 4B, upper left panel and Supplemental Fig. 1B), it failed to affect DCA effects on KEAP1 mRNA or protein (Fig. 4B, bottom left panels). As described above, DCA ineffectively induced ROS in Jurkat cells but decreased KEAP1 expression (Fig. 1, Fig. 2). NAC blocked the former but not the latter effect, that is the decrease in KEAP1 expression (Supplemental Fig. 3). Next we used tumor cells from a BCL patient (BCL-P2) that could be maintained in vitro for several weeks. NAC effectively blocked the DCA-induced ROS increase (Fig. 4B right top panel and Supplemental Fig. 1B). However, in contrast to cell lines, NAC decreased KEAP1 mRNA levels without affecting protein expression (Fig. 4B right bottom panels). In any case, NAC did not affect DCA-induced decrease in either KEAP1 mRNA or protein. This was confirmed in freshly primary leukemic cells of another two BCL patients (Fig. 4C).
Fig. 4.

Increase in ROS levels is not essential for KEAP1 downregulation. A) Jurkat cells were treated with increasing concentrations of H2O2 for 1 h and mRNA expression was analyzed. B) OCI-AML3 cells (left) or primary tumor cells from a BCL patient (right) were treated with 1.5 mM NAC 1 h before adding DCA (20 mM) for 24 h. Cells were labeled with CH-H2DCFDA and analyzed by FACs for ROS production. Keap1 mRNA and protein were analyzed as described in Fig. 2. C) Primary tumor cells from 2 BCL patients were treated as in (B) before analyzing KEAP1 mRNA expression, results represent the means ± SD of these two patients in triplicate. The data represent means ± SD; *p < 0.05, **p < 0.01, ***p < 0.001 Student's t-test compared to non-transfected cells.
3.5. ERK5 Controls Keap1 Expression
We investigated the molecular mechanisms responsible for the decrease in KEAP1 expression. Overexpression of ERK5 in Jurkat cells decreased KEAP1 mRNA and this correlated with an increase in NQO-1 (Fig. 5A and B). Conversely, expression of a small hairpin RNA for ERK5 (shERK5), which decreased ERK5 protein levels (Fig. 5B), increased KEAP1 and decreased NQO-1 mRNA levels (Fig. 5A). KEAP1 protein levels corresponded to those of its mRNA (Fig. 5B). The shERK5-mediated increase in KEAP1 protein occurred after the decrease in ERK5 (Fig. 5C), showing that ERK5 was necessary and sufficient to activate this antioxidant response.
Fig. 5.

ERK5 controls Keap1 mRNA expression. A) 107 Jurkat-TAg cells were transfected with 5 μg of the empty pcDNA vector, ERK5 or a pSUPER Neo vector containing a small hairpin RNA for ERK5 (shERK5). Forty-eight hours later mRNA expression was analyzed by qPCR and presented as the % of mRNA compared to cells transfected with the control vector. B) Protein expression of cells transfected in (A). C) 107 Jurkat-TAg cells were transfected with 5 μg of the empty pSUPER Neo vector or with the vector encoding for the shERK5. Protein expression was analyzed by WB at different times after transfection. The data represent means ± SD; *p < 0.05, **p < 0.01, ***p < 0.001 Student's t-test compared to empty vector transfected cells (control).
We next investigated the effect of shERK5 on cells performing OXPHOS by growing shERK5-transfected Jurkat cells in OXPHOS media or by treating them with DCA. We could not transfect cells growing in OXPHOS media because the survival rate was very low. The OXPHOS-induced increase in ERK5 levels was totally abrogated in shERK5-expressing cells, which actually showed a time-dependent decrease (Fig. 6A and B). In contrast to cells transfected with empty vector, KEAP1 mRNA levels did not decrease in shERK5-expressing cells. The level of NQO-1 showed a much lower increase in these cells. shERK5-expressing cells failed to down regulate KEAP1 and up regulate NQO-1 after H2O2 treatment (Fig. 6C). This showed that ERK5 could mediate several antioxidant responses.
Fig. 6.

ERK5 enables NRF2-mediated antioxidant response in cells performing OXPHOS. 107 Jurkat-TAg cells were transfected with 5 μg of the empty pcDNA vector or shERK5 as described in Fig. 4. A) Transfected cells were placed on glucose or OXPHOS media after 24 h and left for the indicated times before mRNA expression was analyzed by qPCR. B) Cells were prepared as in (A), kept in glucose and treated with 20 mM DCA before mRNA analysis. C) Cells prepared as in (B) but they were treated with different concentrations of H2O2 for 1 h before analyzing mRNA. The data represent means ± SD; *p < 0.05, **p < 0.01, ***p < 0.001 Student's t-test compared to non-treated cells or to empty vector transfected cells when depicted in the graphic.
3.6. ERK5 Mediated OXPHOS-Induced miR-23a Up Regulation
As previously described, the decrease in KEAP1 mRNA could be due to miR-23-mediated inhibition. In fact, cells growing in OXPHOS up regulate miR-23 by an unknown mechanism (Rathore et al., 2012). The promoter of the miR-23a–27a–24-2 locus contains consensus sites for the transcription factor MEF2, which increases expression of a reporter plasmid driven by the miR-23a–27a–24-2 locus proximal promoter (Rathore et al., 2012). Chromatin immunoprecipitation (ChIP) assays showed that MEF2 bound to the miR-23a–27a–24-2 locus promoter in Jurkat cells (Fig. 7A). Anti-Histone-3 and an irrelevant IgG antibody were used as positive and negative controls. CHIP assays also showed that RNA Pol II bound to this promoter (Fig. 7A). In summary, we concluded that MEF2 also activated its transcription.
Fig. 7.

The ERK5/MEF2 pathway regulates expression of the miR-23a–27a–24-2 locus. A) 40 × 107 Jurkat cells growing in glucose were used to perform ChIP analysis using antibodies against proteins depicted on the x-axis. Two different miR23a promoter oligonucleotides were used to study MEF2 binding to the promoter. IL-2 and Rpl30 promoters were used as a control. B-C) 107 Jurkat-TAg cells were co-transfected with 5 μg of the following vectors shERK5, ERK5 wild type (wt) and ERK5 K/M (KM) together with 2 μg of a luciferase reporter plasmid driven by the promoter of the miR-23a–27a–24-2 locus along with 1 μg of β-galactosidase expression vector. Cells were incubated in glucose (gray bars) or OXPHOS (black bars) media 16 h after transfection and analyzed 2 days later for luciferase and β-galactosidase activities. The graphic represents the relative luciferase units (RLU). C) Cells were transfected and treated as in (B) but we additionally used 5 μg of a constitutively active MEK5 mutant (MEK5D), MEF2C and MEF2 with dominant negative function MEF2-DN. Experiments in panels (B) and (C) were done in parallel but the scale is different to visualize differences in (B). The data represent means ± SD; *p < 0.05, **p < 0.01, ***p < 0.001 Student's t-test compared to empty vector transfected cells or as depicted in the graphic.
To further study the role of the ERK5/MEF2 pathway in miR-23 expression, we overexpressed either ERK5 WT, the inactive ERK5 mutant ERK5 KM, or shERK5 and investigated the effect on the activity of a reporter plasmid driven by a 2.4 kb fragment of the miR-23a promoter (Fig. 7B). ERK5 increased expression of the promoter. Both ERK5 KM, which functions as a dominant negative construct in Jurkat cells (Charni et al., 2009), and shERK5 decreased the expression of the reporter (Fig. 7B). As previously described (Rathore et al., 2012), cells performing OXPHOS increased expression of this reporter (Fig. 7B). Inhibition of the ERK5 pathway inhibited OXPHOS-induced reporter activation and ERK5 overexpression increased it. Strong activation of the ERK5 pathway by co-overexpression of a constitutively active mutant of MEK5 (MEK5D), the upstream kinase of ERK5, and ERK5 induced a greater response (Fig. 7C). This was enhanced by cotransfection with MEF2C, which alone also significantly increased the expression of the reporter. In contrast, expression of a dominant negative form of MEF2C (MEF2C-DN) decreased the effect of ERK5 and MEK5D on cells in OXPHOS medium (Fig. 7C). Thus, ERK5 controls miR-23a expression through MEF2. We then investigated if miR-23a regulates KEAP1 mRNA levels.
3.7. miR23a Targets KEAP1 mRNA
We used transcriptomic data of Jurkat cells expressing shERK5 and compared the genes downregulated by shERK5 with the predicted targets of the miR-23a–27a–24-2 cluster (compiling miRBase/microcosm and TargetScan predictions). This identified KEAP1 as a potential target of miR-23a (according to miRBase/microcosm). To investigate this possibility, we overexpressed the miR-23a locus in leukemic Jurkat T cells. This construct also expressed GFP as a control for transfection (Rathore et al., 2012). To evaluate the role of individual miRNAs in this locus, we used mutants of the miR-23a–27a–24-2 cluster: one mutant deleted of the pre-miR-24 and pre-miR-27 (miR-23 ∆ 24–27) and one mutant deleted of the pre-miR-23a (miR-23 ∆ 23). All these constructs significantly overexpressed the encoded miRNAs (Rathore et al., 2012).
Full miR-23a–27a–4-2 locus and mutant miR-23 ∆ 24–27, but not miR-23 ∆ 23 mutant, reduced expression of KEAP1 mRNA and protein (Fig. 8A and B), suggesting that this mRNA was a genuine target of miR-23a. To prove it, we used a reporter plasmid containing the 3′UTR of KEAP1 mRNA fused downstream of the luciferase gene (Eades et al., 2011). We transfected it into Jurkat cells together with the different constructs of the miR-23a–27a–24-2 locus. miR-23a overexpression led to a statistically significant decrease in luciferase expression, showing that KEAP1 mRNA was a direct miR-23a target (Fig. 8C). This regulation was physiologically relevant, because cells that overexpressed miR-23a increased expression of endogenous NQO-1 mRNA (Fig. 8D).
Fig. 8.

miR-23a targets KEAP1 mRNA. A) Jurkat cells were transfected with the whole miR-23a–27a–24-2 locus or with the constructs miR-23 ∆ 24–27 and miR-23 ∆ 23. The expression of KEAP1 mRNA was analyzed by qPCR and represented as the % of mRNA compared to cells transfected with the control vector. B) Expression of KEAP1 protein and the quantification. C) Jurkat cells were transfected with the different constructs together with a reporter plasmid containing the 3′UTR of KEAP1 mRNA downstream of the luciferase mRNA. Data are represented as the % of luciferase expression in cells transfected with the empty vector. D) The expression of NQO-1 mRNA was analyzed by qPCR in cells transfected as in (A). The data represent means ± SD; *p < 0.05, **p < 0.01, ***p < 0.001 Student's t-test compared to empty vector transfected cells or as depicted in the graphic.
4. Discussion
A wide remodeling of the metabolic pathways is likely to occur during tumorigenesis (Jezek et al., 2010, Bellance et al., 2009, Jose and Rossignol, 2013, Villalba et al., 2013, Smolkova et al., 2011). During this process, cells adapt in different ways to obtain energy, including OXPHOS. In this case, they must protect themselves from excessive ROS production, preferably before this occurs. While we have only investigated this using leukemic cells, it is possible that all cells, transformed and non-transformed, have this pathway. In the future, it will be important to investigate this idea, although this requires knowing the “initial” metabolic status of the selected cells in order to be able to alter it.
We describe here a mechanism that regulates the antioxidant response in cells performing OXPHOS in the absence of ROS increase. Mitochondria are the first source of ROS, although it is also the main organelle that assures their removal. ERK5 is essential for OXPHOS in leukemic cells (Charni et al., 2010), but also for protecting cells from excessive ROS (Lopez-Royuela et al., 2014). The last function involves NRF2 activation (Kim et al., 2012, Nigro et al., 2011), which can be mediated through SIRT1 expression (Lopez-Royuela et al., 2014) or by decreasing KEAP1 levels, as we describe here. How OXPHOS activates ERK5 is uncertain, but ERK5 translocates to mitochondria in cells performing OXPHOS (Charni et al., 2010), from where it could regulate activation of nuclear respiratory factors NRF1 and NRF2. NRF1 can regulate MEF2 expression, leading to expression of mitochondrial genes (Ramachandran, 2008). But ERK5 can also regulate mitochondrial activity by directly regulating MEF2, which mediates several mitochondrial functions (El Azzouzi et al., 2010, Ramachandran, 2008).
The mechanism described here involved miR-23a. Its expression must be finely regulated because high levels induce cell death through impairment of glutamine metabolism and mitochondrial activity and hence also affect ROS control (Gao et al., 2009, Rathore et al., 2012, Chhabra et al., 2011, Safdar et al., 2009, Kulshreshtha et al., 2007). In fact, transient overexpression of the whole locus is toxic in lymphocytes several days post-transfection (Rathore et al., 2012). In contrast, too low a level could also originate an impaired antioxidant response, as we illustrated here. In addition, miRNAs have multiple targets and their effects depend on the relative expression of their targeted mRNAs in each specific tissue. miR-23 expression is cell-dependent: miR-23a is downregulated during lymphoid development and upregulated during myeloid development (Jin et al., 2008); and it promotes myeloid development and blocks lymphoid development (Kong et al., 2010). This suggests that miR-23a differentially affects different tissues, although it can promote the same pathways in different cell types.
In this work we have developed a leukemic cell model for investigating the antioxidant response in cells performing OXPHOS. Understanding the mechanism(s) should facilitate the development of novel therapeutic approaches for leukemia (Villalba et al., 2014). In fact, metabolism is now seen as a good candidate for specifically targeting tumor cells (Obre and Rossignol, 2015), although expression or mutation of proteins regulating metabolism, e.g. p53, could greatly affect the efficacy of anti-metabolic tumor treatments (Allende-Vega et al., 2015). Leukemic cells show high ROS levels that can contribute to disease development and progression. However, high levels can be deleterious for cells and hence, leukemic cells also express increased levels of antioxidant proteins, which detoxify ROS (Rushworth and Macewan, 2011, Rushworth et al., 2012). Although initially NRF2 can protect nonmalignant cells from malignant transformation, after that NRF2 can protect the tumor cells from oxidative stress and chemotherapy-induced cytotoxicity (Rushworth and Macewan, 2011, Hayes and Mcmahon, 2009). In AML, high NRF2 expression is driven by NF-κB (Abdul-Aziz et al., 2015). Interestingly, ERK5 activates NF-κB (Garaude et al., 2006) and also controls miR-23 expression (Rathore et al., 2012). Moreover, ERK5 protects AML cells from oxidative stress (Lopez-Royuela et al., 2014). In summary, the ERK5/MEF2/miR-23/KEAP1 pathway represents a potential target for therapeutic intervention. Moreover, our results help explain how NRF2 supports leukemogenesis: it would reinforce leukemic cell survival under different metabolic conditions.
DCA can induce an antioxidant response through NRF2 activation, which can drive cytoprotective gene expression. However, DCA has other effects on cell biology: it changes metabolism and induces p53 activation (Allende-Vega et al., 2015, Charni et al., 2010). Moreover, DCA synergizes with genotoxic drugs, such as doxorubicin or vincristine, to activate p53. Hence, we cannot attribute the effect of DCA on tumor cells uniquely to its role in NRF2 activation. DCA has been used to treat several types of cancer with some positive results, including leukemia. Therefore, we believe that its anti-tumorigenic activity is higher than its pro-tumorigenic action.
During tumorigenesis, the immune system exerts additional pressure that likely contributes to the selection of certain tumor clones. Hence, the immune system may be a factor in selecting tumor cells with a defined metabolic state (Villalba et al., 2013, Catalán et al., 2015). Notably, ERK5 is an important factor in both tumor immune evasion and tumor cell metabolism (Charni et al., 2009, Charni et al., 2010). The fact that ERK5 is involved in several phenomena described here, namely tumor cell evasion, metabolism and antioxidant response, shows that several phenomena converge to generate a specific phenotype in a clinical tumor.
Potential Conflict of Interest
The authors declare no competing financial or other interests.
Author Contributions
A. K., M. G. R., N. A-V, D-N. V., S. B., S. O., G. T., performed experiments; F. B., C-H. L. and M. V. conceived experiments; G. C. provide reagent; M. V. secured funding.
Acknowledgements
All our funders are public or charitable organizations. This work was supported by the program “Chercheur d'avenir” from the Region Languedoc-Roussillon (09-13195) (MV), a scientific program from the “Communauté de Travail des Pyrénées” (CTPP5/12 to MV), the charities CIEL, L'Un pour l'Autre and Ensangble (09/2013) (MV), a grant from the European Community Program SUDOE (CLiNK SOE2/P1/E341 to MV), an AOI from the CHU Montpellier (No. 221826) (GC and MV), a grant from Fondation de France (0057921) and fellowships from the Higher Education Commission, Pakistan (MGR and AK) and Ministère de l'Enseignement Supérieur et de la Recherche (MESR) (DNV). FACs analysis was performed at the platform Montpellier Rio Imaging (MRI). The collection of clinical data and samples (HEMODIAG_2020) at the CHRU Montpellier was supported by funding from Région Languedoc Roussillon. We thank Dr. Robert A. Hipskind for English correction of this manuscript.
Footnotes
Supplementary data to this article can be found online at http://dx.doi.org/10.1016/j.ebiom.2015.11.045.
Appendix A. Supplementary Data
Supplementary figures.
References
- Abdul-Aziz A., MacEwan D.J., Bowles K.M., Rushworth S.A. Oxidative stress responses and NRF2 in human leukaemia. Oxidative Med. Cell. Longev. 2015;2015:454659. doi: 10.1155/2015/454659. [DOI] [PMC free article] [PubMed] [Google Scholar]
- Allende-Vega N., Krzywinska E., Orecchioni S., Lopez-Royuela N., Reggiani F., Talarico G., Rossi J.F., Rossignol R., Hicheri Y., Cartron G., Bertolini F., Villalba M. The presence of wild type p53 in hematological cancers improves the efficacy of combinational therapy targeting metabolism. Oncotarget. 2015;6:19228–19245. doi: 10.18632/oncotarget.4653. [DOI] [PMC free article] [PubMed] [Google Scholar]
- Bellance N., Lestienne P., Rossignol R. Mitochondria: from bioenergetics to the metabolic regulation of carcinogenesis. Front. Biosci. 2009;14:4015–4034. doi: 10.2741/3509. [DOI] [PubMed] [Google Scholar]
- Catalán E., Charni S., Aguiló J.-I., Enríquez J.-A., Naval J., Pardo J., Villalba M., Anel A. MHC-I modulation due to metabolic changes regulates tumor sensitivity to CTL and NK cells. Oncoimmunology. 2015;4 doi: 10.4161/2162402X.2014.985924. [DOI] [PMC free article] [PubMed] [Google Scholar]
- Charni S., Aguilo J.I., Garaude J., De Bettignies G., Jacquet C., Hipskind R.A., Singer D., Anel A., Villalba M. ERK5 knockdown generates mouse leukemia cells with low MHC class I levels that activate NK cells and block tumorigenesis. J. Immunol. 2009;182:3398–3405. doi: 10.4049/jimmunol.0803006. [DOI] [PMC free article] [PubMed] [Google Scholar]
- Charni S., De Bettignies G., Rathore M.G., Aguilo J.I., Van Den Elsen P.J., Haouzi D., Hipskind R.A., Enriquez J.A., Sanchez-Beato M., Pardo J., Anel A., Villalba M. Oxidative phosphorylation induces de novo expression of the MHC Class I in tumor cells through the ERK5 pathway. J. Immunol. 2010;185:3498–3503. doi: 10.4049/jimmunol.1001250. [DOI] [PubMed] [Google Scholar]
- Chhabra R., Dubey R., Saini N. Cooperative and individualistic functions of the microRNAs in the miR-23a–27a–24-2 cluster and its implication in human diseases. Mol. Cancer. 2010;9:232. doi: 10.1186/1476-4598-9-232. [DOI] [PMC free article] [PubMed] [Google Scholar]
- Chhabra R., Dubey R., Saini N. Gene expression profiling indicate role of ER stress in miR-23a–27a–24-2 cluster induced apoptosis in HEK293T cells. RNA Biol. 2011;8 doi: 10.4161/rna.8.4.15583. [DOI] [PubMed] [Google Scholar]
- Devasagayam T.P., Tilak J.C., Boloor K.K., Sane K.S., Ghaskadbi S.S., Lele R.D. Free radicals and antioxidants in human health: current status and future prospects. J. Assoc. Phys. India. 2004;52:794–804. [PubMed] [Google Scholar]
- Eades G., Yang M., Yao Y., Zhang Y., Zhou Q. miR-200a regulates Nrf2 activation by targeting Keap1 mRNA in breast cancer cells. J. Biol. Chem. 2011;286:40725–40733. doi: 10.1074/jbc.M111.275495. [DOI] [PMC free article] [PubMed] [Google Scholar]
- El Azzouzi H., Van Oort R.J., Van Der Nagel R., Sluiter W., Bergmann M.W., De Windt L.J. MEF2 transcriptional activity maintains mitochondrial adaptation in cardiac pressure overload. Eur. J. Heart Fail. 2010;12:4–12. doi: 10.1093/eurjhf/hfp165. [DOI] [PubMed] [Google Scholar]
- Gao P., Tchernyshyov I., Chang T.C., Lee Y.S., Kita K., Ochi T., Zeller K.I., De Marzo A.M., Van Eyk J.E., Mendell J.T., Dang C.V. c-Myc suppression of miR-23a/b enhances mitochondrial glutaminase expression and glutamine metabolism. Nature. 2009;458:762–765. doi: 10.1038/nature07823. [DOI] [PMC free article] [PubMed] [Google Scholar]
- Garaude J., Cherni S., Kaminski S., Delepine E., Chable-Bessia C., Benkirane M., Borges J., Pandiella A., Iniguez M.A., Fresno M., Hipskind R.A., Villalba M. ERK5 activates NF-kappaB in leukemic T cells and is essential for their growth in vivo. J. Immunol. 2006;177:7607–7617. doi: 10.4049/jimmunol.177.11.7607. [DOI] [PubMed] [Google Scholar]
- Garaude J., Farras R., Bossis G., Charni S., Piechaczyk M., Hipskind R.A., Villalba M. SUMOylation regulates the transcriptional activity of JunB in T lymphocytes. J. Immunol. 2008;180:5983–5990. doi: 10.4049/jimmunol.180.9.5983. [DOI] [PubMed] [Google Scholar]
- Hayes J.D., Mcmahon M. NRF2 and KEAP1 mutations: permanent activation of an adaptive response in cancer. Trends Biochem. Sci. 2009;34:176–188. doi: 10.1016/j.tibs.2008.12.008. [DOI] [PubMed] [Google Scholar]
- Jezek P., Plecita-Hlavata L., Smolkova K., Rossignol R. Distinctions and similarities of cell bioenergetics and the role of mitochondria in hypoxia, cancer, and embryonic development. Int. J. Biochem. Cell Biol. 2010;42:604–622. doi: 10.1016/j.biocel.2009.11.008. [DOI] [PubMed] [Google Scholar]
- Jin P., Wang E., Ren J., Childs R., Shin J.W., Khuu H., Marincola F.M., Stroncek D.F. Differentiation of two types of mobilized peripheral blood stem cells by microRNA and cDNA expression analysis. J. Transl. Med. 2008;6:39. doi: 10.1186/1479-5876-6-39. [DOI] [PMC free article] [PubMed] [Google Scholar]
- Jose C., Rossignol R. Rationale for mitochondria-targeting strategies in cancer bioenergetic therapies. Int. J. Biochem. Cell Biol. 2013;45:123–129. doi: 10.1016/j.biocel.2012.07.005. [DOI] [PubMed] [Google Scholar]
- Kensler T.W., Wakabayashi N. Nrf2: friend or foe for chemoprevention? Carcinogenesis. 2010;31:90–99. doi: 10.1093/carcin/bgp231. [DOI] [PMC free article] [PubMed] [Google Scholar]
- Kim M., Kim S., Lim J.H., Lee C., Choi H.C., Woo C.H. Laminar flow activation of ERK5 protein in vascular endothelium leads to atheroprotective effect via NF-E2-related factor 2 (Nrf2) activation. J. Biol. Chem. 2012;287:40722–40731. doi: 10.1074/jbc.M112.381509. [DOI] [PMC free article] [PubMed] [Google Scholar]
- Kong K.Y., Owens K.S., Rogers J.H., Mullenix J., Velu C.S., Grimes H.L., Dahl R. MIR-23A microRNA cluster inhibits B-cell development. Exp. Hematol. 2010;38(629–640) doi: 10.1016/j.exphem.2010.04.004. [DOI] [PMC free article] [PubMed] [Google Scholar]
- Krzywinska E., Allende-Vega N., Cornillon A., Vo D., Cayrefourcq L., Panabieres C., Vilches C., Déchanet-Merville J., Hicheri Y., Rossi J.-F., Cartron G., Villalba M. Identification of anti tumor cells carrying natural killer (NK) cell antigens in patients with hematological cancers. EBioMedicine. 2015;2:1364–1376. doi: 10.1016/j.ebiom.2015.08.021. [DOI] [PMC free article] [PubMed] [Google Scholar]
- Kulshreshtha R., Ferracin M., Wojcik S.E., Garzon R., Alder H., Agosto-Perez F.J., Davuluri R., Liu C.G., Croce C.M., Negrini M., Calin G.A., Ivan M. A microRNA signature of hypoxia. Mol. Cell. Biol. 2007;27:1859–1867. doi: 10.1128/MCB.01395-06. [DOI] [PMC free article] [PubMed] [Google Scholar]
- Lopez-Royuela N., Rathore M.G., Allende-Vega N., Annicotte J.S., Fajas L., Ramachandran B., Gulick T., Villalba M. Extracellular-signal-regulated kinase 5 modulates the antioxidant response by transcriptionally controlling Sirtuin 1 expression in leukemic cells. Int. J. Biochem. Cell Biol. 2014;53:253–261. doi: 10.1016/j.biocel.2014.05.026. [DOI] [PubMed] [Google Scholar]
- Nigro P., Abe J., Berk B.C. Flow shear stress and atherosclerosis: a matter of site specificity. Antioxid. Redox Signal. 2011;15:1405–1414. doi: 10.1089/ars.2010.3679. [DOI] [PMC free article] [PubMed] [Google Scholar]
- Obre E., Rossignol R. Emerging concepts in bioenergetics and cancer research: metabolic flexibility, coupling, symbiosis, switch, oxidative tumors, metabolic remodeling, signaling and bioenergetic therapy. Int. J. Biochem. Cell Biol. 2015;59:167–181. doi: 10.1016/j.biocel.2014.12.008. [DOI] [PubMed] [Google Scholar]
- Ramachandran B., Yu G., Gulick T. Nuclear respiratory factor 1 controls myocyte enhancer factor 2A transcription to provide a mechanism for coordinate expression of respiratory chain subunits. J. Biol. Chem. 2008;283:11935–11946. doi: 10.1074/jbc.M707389200. [DOI] [PMC free article] [PubMed] [Google Scholar]
- Rathore M.G., Saumet A., Rossi J.F., De Bettignies C., Tempe D., Lecellier C.H., Villalba M. The NF-kappaB member p65 controls glutamine metabolism through miR-23a. Int. J. Biochem. Cell Biol. 2012;44:1448–1456. doi: 10.1016/j.biocel.2012.05.011. [DOI] [PubMed] [Google Scholar]
- Reitzer L.J., Wice B.M., Kennell D. Evidence that glutamine, not sugar, is the major energy source for cultured HeLa cells. J. Biol. Chem. 1979;254:2669–2676. [PubMed] [Google Scholar]
- Rossignol R., Gilkerson R., Aggeler R., Yamagata K., Remington S.J., Capaldi R.A. Energy substrate modulates mitochondrial structure and oxidative capacity in cancer cells. Cancer Res. 2004;64:985–993. doi: 10.1158/0008-5472.can-03-1101. [DOI] [PubMed] [Google Scholar]
- Rushworth S.A., MacEwan D.J. The role of nrf2 and cytoprotection in regulating chemotherapy resistance of human leukemia cells. Cancers (Basel) 2011;3:1605–1621. doi: 10.3390/cancers3021605. [DOI] [PMC free article] [PubMed] [Google Scholar]
- Rushworth S.A., Zaitseva L., Murray M.Y., Shah N.M., Bowles K.M., MacEwan D.J. The high Nrf2 expression in human acute myeloid leukemia is driven by NF-kappaB and underlies its chemo-resistance. Blood. 2012;120:5188–5198. doi: 10.1182/blood-2012-04-422121. [DOI] [PubMed] [Google Scholar]
- Safdar A., Abadi A., Akhtar M., Hettinga B.P., Tarnopolsky M.A. miRNA in the regulation of skeletal muscle adaptation to acute endurance exercise in C57Bl/6J male mice. PLoS One. 2009;4:e5610. doi: 10.1371/journal.pone.0005610. [DOI] [PMC free article] [PubMed] [Google Scholar]
- Saumet A., Vetter G., Bouttier M., Portales-Casamar E., Wasserman W.W., Maurin T., Mari B., Barbry P., Vallar L., Friederich E., Arar K., Cassinat B., Chomienne C., Lecellier C.H. Transcriptional repression of microRNA genes by PML-RARA increases expression of key cancer proteins in acute promyelocytic leukemia. Blood. 2009;113:412–421. doi: 10.1182/blood-2008-05-158139. [DOI] [PubMed] [Google Scholar]
- Smolkova K., Plecita-Hlavata L., Bellance N., Benard G., Rossignol R., Jezek P. Waves of gene regulation suppress and then restore oxidative phosphorylation in cancer cells. Int. J. Biochem. Cell Biol. 2011;43:950–968. doi: 10.1016/j.biocel.2010.05.003. [DOI] [PubMed] [Google Scholar]
- Villalba M., Lopez-Royuela N., Krzywinska E., Rathore M.G., Hipskind R.A., Haouas H., Allende-Vega N. Chemical metabolic inhibitors for the treatment of blood-borne cancers. Anti Cancer Agents Med. Chem. 2014;14:223–232. doi: 10.2174/18715206113136660374. [DOI] [PMC free article] [PubMed] [Google Scholar]
- Villalba M., Rathore M.G., Lopez-Royuela N., Krzywinska E., Garaude J., Allende-Vega N. From tumor cell metabolism to tumor immune escape. Int. J. Biochem. Cell Biol. 2013;45:106–113. doi: 10.1016/j.biocel.2012.04.024. [DOI] [PubMed] [Google Scholar]
- Willems P.H., Rossignol R., Dieteren C.E., Murphy M.P., Koopman W.J. Redox homeostasis and mitochondrial dynamics. Cell Metab. 2015;22:207–218. doi: 10.1016/j.cmet.2015.06.006. [DOI] [PubMed] [Google Scholar]
- Zhao J., Kyotani Y., Itoh S., Nakayama H., Isosaki M., Yoshizumi M. Big mitogen-activated protein kinase 1 protects cultured rat aortic smooth muscle cells from oxidative damage. J. Pharmacol. Sci. 2011;116:173–180. doi: 10.1254/jphs.11015fp. [DOI] [PubMed] [Google Scholar]
Associated Data
This section collects any data citations, data availability statements, or supplementary materials included in this article.
Supplementary Materials
Supplementary figures.