

Abstract
Background
Recently, several consensus definitions for sarcopenia have been developed.
Objective
To evaluate the associations and discriminative ability of definitions of sarcopenia against clinical outcomes.
Design
Osteoporotic Fractures in Men study
Setting
Six clinical centers
Participants
5,934 community-dwelling men aged ≥65 yrs
Measurements
Sarcopenia definitions evaluated were: International Working Group (IWG), European Working Group for Sarcopenia in Older Persons (EWGSOP), Foundation for the NIH (FNIH) Sarcopenia, Baumgartner, and Newman. Recurrent falls were defined as ≥2 self-reported falls in the year after baseline (N=694, 11.9%). Incident hip fractures (N=207, 3.5 %) and deaths (N=2003, 34.1%) were confirmed by central review of medical records over 9.8 years. Self-reported functional limitations were assessed at baseline and again 4.6 years later. Logistic regression or proportional hazards models estimated associations between sarcopenia and falls, hip fractures or death. The discriminative ability of the sarcopenia definitions (compared to referent models) for these outcomes was evaluated with areas under the receiver operator curve (AUCs) or C-statistics. Referent models included age alone for falls, function limitations and mortality, and age and BMD for hip fractures.
Results
The association between sarcopenia by the various definitions and risk of falls, functional limitations, and hip fractures was variable; all definitions were associated with increased mortality risk. However, none of the definitions materially changed discrimination based on AUC and C-statistic when compared to referent models (change ≤1% in all models).
Conclusions
Sarcopenia definitions as currently constructed did not consistently improve prediction of clinical outcomes in relatively healthy older men.
Keywords: sarcopenia, falls, fractures, mortality, functional limitation
Introduction
Recently, several operational definitions for sarcopenia have been proposed,1–4,5–7. Conceived initially as the loss of lean body mass accompanying aging,8 early operational definitions of sarcopenia were based solely on appendicular lean mass (ALM) from dual energy x-ray absoprtiometry (DXA) standardized to height.9 However, the relation between muscle or lean mass with functional decline and disability is uncertain.10–16 Thus, more recently proposed consensus definitions of sarcopenia have broadened the criteria for diagnosis to include components of strength and/or physical performance. The predictive validity of these more recent definitions has not been established.
Before “sarcopenia” is defined as a clinical syndrome, biomarker, risk factor, or an outcome in clinical trials, the utility of this measure should be evaluated. To establish the utility of a novel measure, several conditions must be met. First, the measure must increase the likelihood of development of other adverse outcomes, independent of age and potentially other known clinical factors (such as body mass index). Second, the measure should improve our ability to discriminate those who go on to develop outcomes from those who do not. Third, the measure should appropriately and significantly reclassify people in terms of risk of development of adverse outcomes.
Therefore, we evaluated the associations, discriminative ability and reclassification of five definitions of sarcopenia1, 2, 5–7, 9, 17 using four adverse outcomes (recurrent falls, hip fractures, functional limitations and mortality) in the Osteoporotic Fractures in Men (MrOS) study, a prospective cohort of community dwelling older men.
Methods
Study population
In 2000–2002, 5,994 ambulatory community-dwelling men aged ≥65 years without bilateral hip replacements were enrolled in MrOS, a multi-center cohort study of aging and osteoporosis.18, 19 All men provided written informed consent, and the study was approved by the Institutional Review Board at each center.
Clinical measurements
Weight was measured on a balance beam or digital scale, and height by wall-mounted stadiometers. BMI was calculated as weight (kg)/height2 (m2). Appendicular lean mass (ALM) and total hip bone mineral density (BMD) were assessed by DXA (Hologic 4500 scanners, Waltham, MA, USA) as previously described.20 Gait speed was measured over a 6 m course using the average of two trials (m/s).21 Grip strength (kg) from two tests of each hand was assessed using Jamar handheld dynamometers; the maximum value obtained across all tests was analyzed. Ability and time to complete five repeated chair stands was assessed. Men self-reported a physician diagnosis of a number of medical conditions (see footnote Table 2); the number of these conditions was summed. Participants also self-reported activity level (Physical Activity Scale for the Elderly, PASE)22, race, alcohol use, smoking status, health status (excellent/good vs. fair/poor/very poor), and history of fracture before the baseline visit.
Table 2.
Characteristics (mean±SD or N(%)) of MrOS Participants by Consensus Definitions of Sarcopenia
| Characteristic | Baumgartnerb | Newmanc | EWGSOPd | |||
|---|---|---|---|---|---|---|
| No Sarcopenia | Sarcopenia | No Sarcopenia | Sarcopenia | No Sarcopenia | Sarcopenia | |
| (N= 4633) | (N= 1301) | (N= 4748) | (N= 1186) | (N= 5677) | (N= 257) | |
| Age, y | 72.9 ± 5.5a | 76.2 ± 6.4 | 73.1 ± 5.7 | 75.7 ± 6.2 | 73.4 ± 5.7 | 79.9 ± 6.5 |
| White race | 4148 (89.5) | 1160 (89.2) | 4219 (88.9) | 1089 (91.8) | 5082 (89.5) | 226 (87.9) |
| Height, cm | 174.3 ± 6.8 | 173.5 ± 6.9 | 174.0 ± 6.8 | 174.7 ± 6.7 | 174.3 ± 6.7 | 170.1 ± 6.7 |
| Weight, kg | 86.1 ± 12.6 | 72.4 ± 8.9 | 84.0 ± 13.2 | 79.6 ± 12.4 | 83.7 ± 13.0 | 70.2 ± 9.3 |
| BMI, kg/m2h | 28.31 ± 3.6 | 24.02 ± 2.3 | 27.7 ± 3.8 | 26.1 ± 3.6 | 27.5 ± 3.8 | 24.2 ± 2.5 |
| Gait speed, m/s | 1.21 ± 0.22 | 1.16 ± 0.23 | 1.21 ± 0.23 | 1.15 ± 0.23 | 1.21 ± 0.22 | 0.96 ± 0.27 |
| Grip strength, kg | 42.9 ± 8.3 | 37.3 ± 7.6 | 42.7 ± 8.4 | 37.6 ± 7.7 | 42.2 ± 8.1 | 28.2 ± 6.6 |
| Chair stands inability | 97 (2.1) | 67 (5.2) | 86 (1.8) | 78 (6.6) | 124 (2.2) | 40 (15.6) |
| ALM, kgi | 25.3 ± 3.1 | 20.5 ± 2.0 | 25.0 ± 3.3 | 21.2 ± 2.5 | 24.5 ± 3.4 | 19.3 ± 1.8 |
| ALM/ht2, kg/m2 | 8.3 ± 0.8 | 6.8 ± 0.4 | 8.2 ± 0.8 | 6.9 ± 0.6 | 8.0 ± 0.9 | 6.7 ± 0.4 |
| ALM/BMI | 0.90 ± 0.11 | 0.86 ± 0.11 | 0.91 ± 0.11 | 0.82 ± 0.11 | 0.90 ± 0.1 | 0.80 ± 0.1 |
| One or more medical conditionsj | 2277 (49.2) | 746 (57.3) | 2324 (49.0) | 699 (58.9) | 2845 (50.1) | 178 (69.3) |
| Excellent/good health | 4009 (86.6) | 1089 (83.8) | 4132 (87.2) | 966 (81.5) | 4910 (86.5) | 188 (73.2) |
| Smoking | ||||||
| Never | 1714 (37.0) | 510 (39.2) | 1797 (37.9) | 427 (36.0) | 2121 (37.4) | 103 (40.1) |
| Past | 2771 (59.8) | 734 (56.4) | 2797 (58.9) | 708 (59.7) | 3361 (59.2) | 144 (56.0) |
| Current | 147 (3.2) | 57 (4.4) | 153 (3.2) | 51 (4.3) | 194 (3.4) | 10 (3.9) |
| Alcohol use, drink/week | ||||||
| 0–2 | 2762 (59.7) | 781 (60.1) | 2842 (60.0) | 701 (59.2) | 3360 (59.3) | 183 (71.2) |
| 3–13 | 1333 (28.8) | 362 (27.9) | 1366 (28.8) | 329 (27.8) | 1647 (29.1) | 48 (18.7) |
| 14+ | 531 (11.5) | 157 (12.1) | 533 (11.2) | 155 (13.1) | 662 (11.7) | 26 (10.1) |
| PASE scorek | 151.2 ± 68.0 | 131.7 ± 66.2 | 151.6 ± 68.2 | 128.1 ± 64.5 | 148.9 ± 67.8 | 104.0 ± 61.5 |
| Femoral neck BMD, g/cm2l | 0.800 ± 0.127 | 0.728 ± 0.114 | 0.794 ± 0.128 | 0.747 ± 0.119 | 0.789 ± 0.127 | 0.693 ± 0.109 |
| Non-spine fracture after age 50 | 1069 (23.1) | 315 (24.2) | 1088 (22.9) | 296 (5.0) | 1305 (23.0) | 79 (30.7) |
| Characteristic | IWGe | FNIH Definition #1f | FNIH Definition #2g | |||
|---|---|---|---|---|---|---|
| No Sarcopenia | Sarcopenia | No Sarcopenia | Sarcopenia | No Sarcopenia | Sarcopenia | |
| (N= 5657) | (N= 277) | (N= 5846) | (N= 88) | (N= 5916) | (N= 18) | |
| Age, y | 73.4 ± 5.7a | 79.3 ± 6.7 | 73.6 ± 5.8 | 78.1 ± 6.6 | 73.6 ± 5.8 | 82.8 ± 5.2 |
| White race | 5065 (89.5) | 243 (87.7) | 5225 (89.4) | 83 (94.3) | 5291 (89.4) | 17 (94.4) |
| Height, cm | 174.3 ± 6.8 | 172.0 ± 6.8 | 174.3 ± 6.7 | 165.4 ± 4.7 | 174.2 ± 6.8 | 164.6 ± 5.5 |
| Weight, kg | 83.6 ± 13.1 | 72.5 ± 9.6 | 83.2 ± 13.2 | 76.6 ± 12.3 | 83.1 ± 13.2 | 77.0 ± 15.5 |
| Body mass index, kg/m2 | 27.5 ± 3.8 | 24.5 ± 2.5 | 27.4 ± 3.8 | 28.0 ± 3.9 | 27.4 ± 3.8 | 28.4 ± 5.1 |
| Gait speed, m/s | 1.22 ± 0.22 | 0.84 ± 0.14 | 1.20 ± 0.23 | 1.01 ± 0.25 | 1.20 ± 0.23 | 0.64 ± 0.1 |
| Grip strength, kg | 42.0 ± 8.4 | 33.7 ± 7.3 | 41.9 ± 8.3 | 21.7 ± 3.4 | 41.7 ± 8.4 | 21.1 ± 4.3 |
| Chair stands inability | 117 (2.1) | 47 (17.0) | 148 (2.5) | 16 (18.4) | 153 (2.6) | 11 (64.7) |
| ALM, kg | 24.5 ± 3.4 | 19.9 ± 1.9 | 24.3 ± 3.5 | 20.3 ± 3.0 | 24.3 ± 3.5 | 20.3 ± 3.7 |
| ALM/ht2, kg/m2 | 8.0 ± 0.9 | 6.7 ± 0.4 | 8.0 ± 0.9 | 7.4 ± 1.1 | 8.0 ± 0.9 | 7.5 ± 1.4 |
| ALM/BMI | 0.90 ± 0.10 | 0.82 ± 0.10 | 0.89 ± 0.11 | 0.73 ± 0.05 | 0.89 ± 0.11 | 0.72 ± 0.06 |
| One or more medical conditions | 2833 (50.1) | 190 (68.6) | 2965 (50.7) | 58 (65.9) | 3012 (50.9) | 11 (61.1) |
| Excellent/good health | 4899 (86.6) | 199 (71.8) | 5035 (86.2) | 63 (71.6) | 5087 (86.0) | 11 (61.1) |
| Smoking | ||||||
| Never | 2128 (37.6) | 96 (34.7) | 2190 (37.5) | 34 (38.6) | 2219 (37.5) | 5 (27.8) |
| Past | 3343 (59.1) | 162 (58.5) | 3455 (59.1) | 50 (56.8) | 3493 (59.1) | 12 (66.7) |
| Current | 185 (3.3) | 19 (6.9) | 200 (3.4) | 4 (4.6) | 203 (3.4) | 1 (5.6) |
| Alcohol use, drink/week | ||||||
| 0–2 | 3364 (59.5) | 179 (64.9) | 3481 (59.6) | 62 (70.5) | 3528 (59.7) | 15 (83.3) |
| 3–13 | 1630 (28.9) | 65 (23.6) | 1677 (28.7) | 18 (20.5) | 1693 (28.7) | 2 (11.1) |
| 14+ | 656 (11.6) | 32 (11.6) | 680 (11.7) | 8 (9.1) | 687 (11.6) | 1 (5.6) |
| PASE score | 148.9 ± 67.7 | 107.8 ± 64.5 | 147.7 ± 68.0 | 99.6 ± 61.3 | 147.2 ± 68.0 | 66.2 ± 60.4 |
| Femoral neck BMD, g/cm2 | 0.788 ± 0.127 | 0.710 ± 0.117 | 0.785 ± 0.128 | 0.746 ± 0.129 | 0.784 ± 0.128 | 0.703 ± 0.121 |
| Non-spine fracture after age 50 | 1301 (23.0) | 83 (30.1) | 1361 (23.3) | 23 (26.1) | 1376 (23.3) | 8 (44.4) |
Bold text indicates pair-wise differences within definitions p<0.05.
Baumgartner: presence of low lean mass (ALM/ht2≤7.23 kg/m2)
Newman: The equation used to calculate residuals was ALM (kg) =− 22.48 +24.14*height(m) + 0.21*total fat mass (kg) (17); the cutpoint was ≤−0.204 kg/m29
EWGSOP (European Working Group for Sarcopenia in Older Persons): presence of slowness (gait ≤0.8 m/s) plus low lean mass (ALM/ht2≤7.23 kg/m2) or weakness (grip<30 kg)
IWG (International Working Group): presence of slowness (gait<1.0 m/s) and low lean mass (ALM/ht2≤7.23 kg/m2)
FNIH (FNIH: Foundation for NIH Sarcopenia Project) definition #1: Presence of both weakness (grip<26 kg) and low lean mass (ALM/BMI <0.789)
FNIH definition #2: Presence of slowness (gait≤0.8 m/s), weakness (grip<26 kg) and low lean mass (ALM/BMI <0.789)
BMI: body mass index
ALM: appendicular lean mass
Medical conditions include stroke, diabetes, hyper- or hypothyroidism, Parkinson’s disease, myocardial infarction, congestive heart failure, chronic obstructive pulmonary disease (COPD), or non-skin cancer.
PASE: Physical Activity Scale for the Elderly
BMD: bone mineral density
P-values for continuous variables from a t-test if normally distributed, a Wilcoxon rank-sum test if skewed; for categorical variables from a chi-square test.
Sarcopenia definitions
Published operational definitions for sarcopenia include: Baumgartner;9 Newman;17 the International Working Group (IWG);2 the European Working Group on Sarcopenia Older Persons (EWGSOP);1 European Society for Clinical Nutrition and Metabolism Special Interest Group on cachexia-anorexia in chronic wasting diseases (ESPEN);3 the Society of Sarcopenia, Cachexia, and Wasting Disorders (SCWD);4 and the Foundation for the NIH Sarcopenia Project (FNIH Sarcopenia Project).6 (Table 1). The ESPEN and SCWD recommendations were similar to EWGSOP and IWG, respectively, and therefore were not analyzed separately. The consensus definitions are similar in that all combine lean mass assessed by DXA with a strength and/or physical performance component; the Newman and Baumgartner definitions rely on lean mass estimates alone. The definitions also overlap to some extent. For lean mass, the EWGSOP and IWG definitions employ the Baumgartner criteria as the lean mass component, and the EWGSOP and FNIH definitions both define slowness as gait speed as ≤0.8 m/s.
Table 1.
Criteria and Prevalence for Consensus Definitions of Sarcopenia in the Osteoporotic Fractures in Men (MrOS) Study
| Slowness Definition | Prevalence | Weakness Definition | Prevalence | Low lean mass Definition | Prevalence | Summary definition Definition | Prevalence | |
|---|---|---|---|---|---|---|---|---|
| International Working Group (IWG) | Gait speed <1.0 m/s | 17.4% (N=1034) | Not included | N/A | ALM/ht2 ≤7.23 kg/m2 | 20.9% (N=1239) | Sarcopenia: both slowness and low lean mass | 4.7% (N=277) |
| European Working Group on Sarcopenia Older Persons (EWGSOP) | Gait speed ≤0.8 m/s | 4.4% (N=262) | Grip strength <30 kg | 8.0% (N=474) | ALM/ht2 ≤7.23 kg/m2 | 20.9% (N=1239) | 1) Sarcopenia: low lean mass plus either slowness or weakness 2) Severe sarcopenia: all three criteriaa |
1) 4.3% (N=257) 2) 0.4% (N=26) |
| Foundation for the NIH (FNIH) Sarcopenia Project primary definition | Gait speed ≤0.8 m/s | 4.4% (N=262) | Grip strength <26 kg | 3.9% (N=233) | ALM/BMI <0.789b | 17.3% (N=1025) | 1) weakness and low lean mass 2) slowness with weakness and low lean mass |
1) 1.5% (N=88) 2) 0.3% (N=18) |
| Baumgartner | Not included | N/A | Not included | N/A | ALM/ht2 ≤7.23 kg/m2 | 20.9% (N=1239) | Presence of low lean mass | 20.9% (N=1239) |
| Newman | Not included | N/A | Not included | N/A | Residual of actual ALM - predicted ALM from equationc | 20.0% (N=1186) | Presence of low lean mass | 20.0% (N=1186) |
Since prevalence of EWGSOP severe sarcopenia was low, both sarcopenia and severe sarcopenia were analyzed together
The FNIH Sarcopenia Project also proposed an alternative definition using ALM<19.75 kg for low lean mass (prevalence: 8.9%, N=525). Using the alternative definition, prevalence of “weakness and low lean mass” was 1.1% (N=67) and prevalence of “slowness with weakness and low lean mass” was 0.3% (N=16).
The equation used to calculate residuals was ALM (kg) =− 22.48 +24.14*height(m) + 0.21*total fat mass (kg) as derived for men in the Health ABC study (17); the cut-point for the residual was ≤−0.204 kg/m2
ALM=appendicular lean mass, NIH = National Institute of Health
Outcomes
Men answered mailed questionnaires about falls and fractures three times per year; response to these questionnaires exceeded 99%. When a participant did not return a questionnaire in a timely fashion, clinic staff contacted the participant or his next of kin. Men who reported two or more falls in the year after baseline were considered “recurrent fallers”; those who reported none or only one fall were not considered recurrent fallers. Fractures and deaths were centrally adjudicated by physician review of radiology reports, death certificates and/or and hospital discharge summaries when available. Men were queried about self-reported functional limitation (defined as inability to complete any of the following tasks: walk 2–3 blocks, climb 10 steps without resting, prepare meals, shop, or do heavy housework) at baseline and the second clinic visit questionnaire 4.6 years later.
Statistical analyses
Of the 5994 men at baseline, 60 were missing gait speed, grip strength or lean mass data, leaving 5,934 eligible for inclusion in follow-up analyses. Analysis of each outcome included a different number of participants. For recurrent falls, 106 men were missing follow-up data, leaving 5,828 in analyses. For hip fractures, all 5934 men had follow-up data. For functional limitations, 1200 men were classified as having a functional limitation at baseline, 19 were missing this data at baseline, 989 were missing follow-up data for functional limitations at Visit 2 (including those who died or terminated prior to the visit), leaving 3,726 in the functional limitations analyses. For mortality, 65 were missing final adjudication of vital status (due to a missing or pending collection of death certificate) leaving 5,869 men in mortality analyses.
We compared characteristics of participants by presence or absence of each sarcopenia definition, using t-tests, Wilcoxon tests and chi-square tests as appropriate.
Proportional hazards models were used to estimate hazard ratios (HRs) and 95% confidence intervals for hip fractures and mortality, and the proportionality assumption was tested and was not found to be violated. Logistic regression models were used to estimate odds ratios (ORs) and 95% confidence intervals for recurrent falls and functional limitations. All models were age-adjusted, hip fracture models were also adjusted by femoral neck BMD.
To quantify the discriminative ability of each sarcopenia definition for the study outcomes, we calculated the area under the curve (AUC) from receiver-operator characteristic (ROC) from logistic models and the analogous Harrell’s C-statistic23 from proportional hazards models. The AUC or C-statistic was calculated in the referent models, and we also calculated the AUC or C-statistic in models that additionally included the sarcopenia definition. The difference (95% confidence interval) in AUC or C-statistic and between these two models was calculated. Referent models for falls, functional limitations and mortality included age alone; for hip fractures, the referent model included age and BMD.
To quantify the amount of reclassification attributable to addition of each sarcopenia definition to the referent model, we used the Net Reclassification Improvement (NRI) statistic.24 A no-category approach to calculating the NRI was used, since established risk thresholds for study outcomes are not widely used in clinical settings. Risk estimates were calculated as the predicted probability of the event from logistic regression models or one minus the survivor function estimate from proportional hazard models. For example, for mortality, we determined two proportions for those who died: 1) the proportion whose predicted probability was increased by the addition of the sarcopenia definition to the referent model (representing appropriate reclassification) and 2) the proportion whose risk estimate decreased by addition of the sarcopenia definition to the referent model (representing inappropriate reclassification). To ensure that small changes in predicted probability between the old and new models was not driving the NRI values, each individual’s predicted probability must have changed by at least ±1%; otherwise their predicted probability change was considered to be zero. We then subtracted the proportion that was inappropriately reclassified from the proportion that was appropriately reclassified, resulting in the net reclassification for those who died. For those who did not die, we also calculated the proportion with appropriate reclassification (the proportion whose risk estimates decreased with the addition of the sarcopenia definition to the referent model), and from this we subtracted the proportion with inappropriate reclassification (the proportion whose risk estimate increased with the addition of the sarcopenia definition to the referent model) resulting in the net reclassification for those who did not die. To calculate the overall NRI, we then added the net reclassification values for those who died to the reclassification values for those who did not die. The overall NRI ranges from −2 to +2, with negative values indicating inappropriate reclassification and positive values indicating appropriate reclassification. Confidence intervals were calculated from standard errors described by Pencina.24
Analyses were conducted using SAS version 9.2 (SAS Institute Inc, Cary, NC) or Stata 12.1 (StataCorp. 2011. Stata Statistical Software: Release 12. College Station, TX: StataCorp LP).
Results
Overall, the prevalence of sarcopenia was low to moderate (Table 1). Characteristics of participants by presence/absence of sarcopenia for each definition are presented in Table 2. In general, those classified as having sarcopenia (by any definition) were older, weaker, had lower lean mass, more co-morbid conditions, worse self-rated health, lower activity level and lower BMD than those classified as not having sarcopenia. Associations between sarcopenia classification and smoking, alcohol use, BMI and history of fracture varied by the definition utilized.
A total of 694 men (11.9%) were classified as recurrent fallers in the year after the baseline exam. Neither the Baumgartner nor Newman definitions were associated with recurrent falls. All sarcopenia definitions that incorporated weakness or slowness were associated with a 2–3 fold higher likelihood of recurrent falls compared to men without sarcopenia, however the FNIH Definition #2 did not reach statistical significance, perhaps because so few met the definition (Figure 1) Overall, when compared to the referent model with age alone, changes in the AUCs with the addition of each sarcopenia definitions that included slowness or weakness mirrored the significance of the associations (that is, the odds ratios) but tended to be very small in absolute magnitude with the greatest difference in the AUC only 0.01 (for the IWG definition). For all sarcopenia definitions that included weakness or slowness, the NRI showed improved reclassification for those men without an event (0.03 to 0.35), but there was also substantial reclassification in the inappropriate direction for those with events (−0.05 to −0.33) resulting in no overall reclassification improvement (−0.05 to 0.01) (Table 3). Both the Baumgartner and the Newman definitions appropriate reclassified events, but inappropriately reclassified non-events, resulting in no change in the overall NRI.
Figure 1.
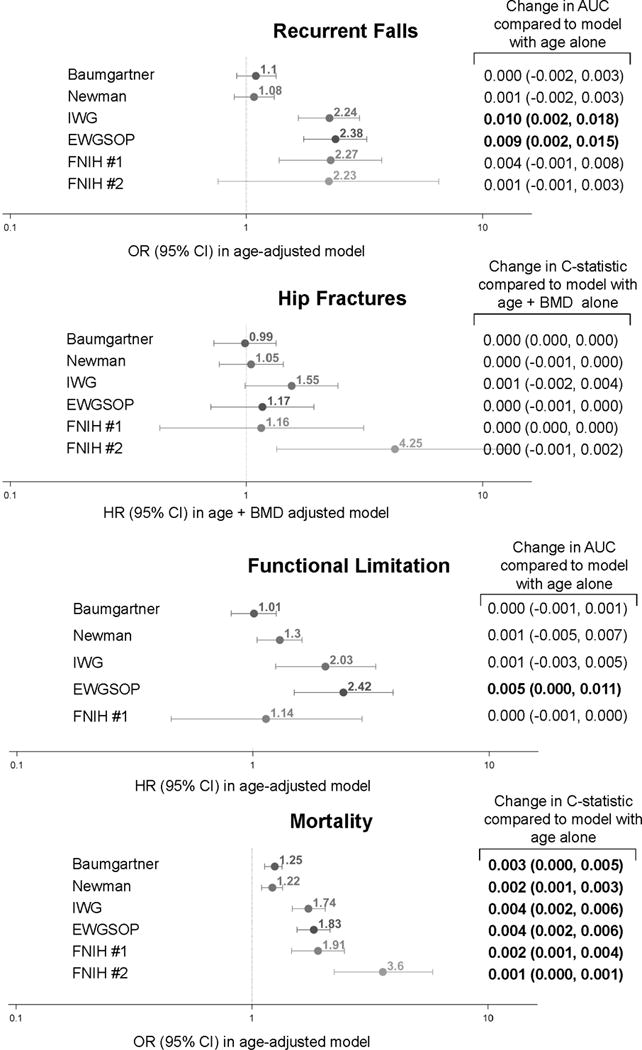
Association and Discrimination of Sarcopenia Definitions with Recurrent Falls, Hip Fractures, Functional Limitations and Mortality in Older Men.
AUC (area under curve) for model with age alone for falls was 0.577.
C-statistic for model with age and BMD alone for hip fractures was 0.806
AUC for model with age alone for functional limitations was 0.632.
C-statistic for model with age alone for mortality was 0.684.
Bold text indicates p<0.05.
IWG: presence of slowness (gait<1.0 m/s) and low lean mass (ALM/ht2≤7.23 kg/m2)
EWGSOP: presence of slowness (gait ≤0.8 m/s) plus low lean mass (ALM/ht2≤7.23 kg/m2) or weakness (grip<30 kg)
FNIH definition #1: Presence of both weakness (grip<26 kg) and low lean mass (ALM/BMI <0.789)
FNIH definition #2: Presence of slowness (gait≤0.8 m/s), weakness (grip<26 kg) and low lean mass (ALM/BMI <0.789)
IWG = International Working Group; EWGSOP = European Working Group for Sarcopenia in Older Persons, FNIH = Foundation for NIH Sarcopenia Project, ALM=appendicular lean mass, BMI=body mass index,
Table 3.
Reclassification of MrOS Participants After Addition of Baumgartner, Newman, IWG, EWGSOP or FNIH Definitions of Sarcopenia to a Simple Model with Age (for Recurrent falls, Functional limitations, and Mortality) or Age and Bone Mineral Density (for Hip Fractures)
| Baumgartner | Newman | IWG | EWG | FNIH Definition #1 | FNIH Definition #2 | ||
|---|---|---|---|---|---|---|---|
| Recurrent falls over 1 year | |||||||
|
| |||||||
| N=694 with eventb | Appropriately reclassified | 143 (21%) | 117 (17%) | 70 (10%) | 68 (10%) | 22 (3%) | 5 (1%) |
| Inappropriately reclassified | 61 (9%) | 66 (10%) | 298 (43%) | 298 (43%) | 101(15%) | 37 (5%) | |
| No change | 490 (71%) | 511 (74%) | 326 (47%) | 328 (47%) | 571(82%) | 652 (94%) | |
| NRI (95%CI), events | 0.12 (0.08, 0.16) | 0.07 (0.04, 0.11) | −0.33 (−0.38, −0.28) | −0.33 (−0.38, −0.28) | −0.11 (−0.14, −0.08) | −0.05 (−0.06, −0.03) | |
|
| |||||||
| N=5134 without eventc | Appropriately reclassified | 285 (6%) | 284 (6%) | 1934 (38%) | 1947(38%) | 416 (8%) | 154 (3%) |
| Inappropriately reclassified | 916 (18%) | 675 (13%) | 195 (4%) | 176(3%) | 61 (1%) | 12 (0%) | |
| No change | 3933 (77%) | 4175 (81%) | 3005 (59%) | 3011(59%) | 4657 (91%) | 4968 (97%) | |
| NRI (95%CI), non-events | −0.12 (−0.14, −0.11) | −0.08 (−0.09, −0.06) | 0.34 (0.32, 0.35) | 0.35 (0.33, 0.36) | 0.07 (0.06, 0.08) | 0.03 (0.02, 0.03) | |
|
| |||||||
| Overall NRI (95% CI) | 0% (−5%, 4%) | 0% (−4%, 4%) | 0.01 (−0.04, 0.06) | 0.01 (−0.04, 0.06) | −0.05 (−0.08, −0.01) | −0.02 (−0.04, 0.00) | |
|
| |||||||
| Hip fractures over 9.8 years | |||||||
|
| |||||||
| N=207 with event | Appropriately reclassified | 4 (2%) | 12 (6%) | 20 (10%) | 12 (6%) | 3 (1%) | 3 (1%) |
| Inappropriately reclassified | 3 (1%) | 5 (2%) | 41 (20%) | 11 (5%) | 2 (1%) | 12 (6%) | |
| No change | 200 (97%) | 190 (92%) | 146 (71%) | 184 (89%) | 202 (98%) | 192 (93%) | |
| NRI (95%CI), events | 0.00 (−0.02, 0.03) | 0.03 (0.0, 0.07) | −0.10 (−0.17, −0.03) | 0.00 (−0.04, 0.05) | 0.00 (−0.02, 0.03) | −0.04 (−0.08, −0.01) | |
|
| |||||||
| N=5727 without event | Appropriately reclassified | 39 (1%) | 159 (3%) | 497 (9%) | 175 (3%) | 39 (1%) | 197 (3%) |
| Inappropriately reclassified | 41 (1%) | 180 (3%) | 231 (4%) | 132 (2%) | 38 (1%) | 47 (1%) | |
| No change | 5647 (99%) | 5388 (94%) | 4999 (87%) | 5420 (95%) | 5650 (99%) | 5483 (96%) | |
| NRI (95%CI), non-events | 0.00 (0.00, 0.00) | 0.00 (−0.01, 0.00) | 0.05 (0.04, 0.06) | 0.01 (0.00, 0.01) | 0.00 (0.00, 0.00) | 0.03 (0.02, 0.03) | |
|
| |||||||
| Overall NRI (95% CI) | 0.00 (0.02, 0.03) | 0.03 (−0.01, 0.07) | −0.06 (−0.13, 0.02) | 0.01 (−0.03, 0.06) | 0.01 (−0.02, 0.03) | −0.02 (−0.05, 0.02) | |
|
| |||||||
| Functional limitations over 4.6 years | |||||||
|
| |||||||
| N=590 with event | Appropriately reclassified | 38 (6%) | 133 (23%) | 28 (5%) | 31 (5%) | 6 (1%) | N/Aa |
| Inappropriately reclassified | 0 (0%) | 236 (40%) | 181 (31%) | 242 (41%) | 0 (0%) | ||
| No change | 552 (94%) | 221 (37%) | 381 (65%) | 317 (54%) | 584 (99%) | ||
| NRI (95%CI), events | 0.06 (0.04, 0.08) | −0.17 (−0.24, −0.11) | −0.26 (−0.30, −0.22) | −0.36 (−0.40, −0.31) | 0.01 (0.00, 0.02) | ||
|
| |||||||
| N=3136 without event | Appropriately reclassified | 1 (0%) | 982 (31%) | 581 (19%) | 807 (26%) | 0 (0%) | |
| Inappropriately reclassified | 147 (5%) | 495 (16%) | 51 (2%) | 46 (1%) | 20 (1%) | ||
| No change | 2988 (95%) | 1659 (53%) | 2504 (80%) | 2283 (73%) | 3116 (99%) | ||
| NRI (95%CI), non-events | −0.05 (−0.05, −0.04) | 0.16 (0.13, 0.18) | 0.17 (0.15, 0.18) | 0.24 (0.23, 0.26) | −0.01 (−0.01, 0.00) | ||
|
| |||||||
| Overall NRI (95% CI) | 0.02 (0.00, 0.04) | −0.02 (−0.09, 0.05) | −0.09 (−0.14, −0.04) | −0.11 (−0.16, −0.07) | 0.00 (0.00, 0.01) | ||
|
| |||||||
| Deaths over 9.8 years | |||||||
|
| |||||||
| N=2003 with event | Appropriately reclassified | 543 (27%) | 474 (24%) | 193 (10%) | 192 (10%) | 58 (3%) | 22 (1%) |
| Inappropriately reclassified | 938 (47%) | 930 (46%) | 1001 (50%) | 1009 (50%) | 602 (30%) | 377 (19%) | |
| No change | 522 (26%) | 599 (30%) | 809 (40%) | 802 (40%) | 1343 (67%) | 1604 (80%) | |
| NRI (95%CI), events | −0.20 (−0.23, −0.16) | −0.23 (−0.26, −0.19) | −0.40 (−0.43, −0.38) | −0.41 (−0.44 −0.38) | −0.27 (−0.29, −0.25) | −0.18 (−0.20, −0.16) | |
|
| |||||||
| N=3866 without event | Appropriately reclassified | 2220 (57%) | 2109 (55%) | 1392 (36%) | 1382 (36%) | 811(21%) | 306 (8%) |
| Inappropriately reclassified | 687 (18%) | 646 (17%) | 393 (10%) | 420 (11%) | 45 (1%) | 103 (3%) | |
| No change | 959 (25%) | 1111 (29%) | 2081 (54%) | 2064 (53%) | 3010 (78%) | 3457 (89%) | |
| NRI (95%CI), non-events | 0.40 (0.37, 0.42) | 0.38 (0.35, 0.40) | 0.26 (0.24, 0.28) | 0.25 (0.23, 0.27) | 0.20 (0.19, 0.21) | 0.05 (0.04, 0.06) | |
|
| |||||||
| Overall NRI (95% CI) | 0.20 (0.16, 0.24) | 0.15 (0.11, 0.19) | −0.15 (−0.18, −0.11) | −0.16 (−0.19, −0.12) | −0.07 (−0.10, −0.05) | −0.13 (−0.15, −0.10) | |
There were no incident functional limitations in men who met the FNIH definition #2, so these models could not be run.
Bold text indicates p<0.05.
For events, appropriate reclassification occurs when estimated risk increases when the additional factor is added to the model; inappropriate reclassification occurs when estimated risk decreases when the additional factor is added to the model.
For non-events, appropriate reclassification occurs when estimated risk decreases when the additional factor is added to the model; inappropriate reclassification occurs when estimated risk increases when the additional factor is added to the model.
IWG: presence of slowness (gait<1.0 m/s) and low lean mass (ALM/ht2≤7.23 kg/m2)
EWGSOP: presence of slowness (gait ≤0.8 m/s) plus low lean mass (ALM/ht2≤7.23 kg/m2) or weakness (grip<30 kg)
FNIH definition #1: Presence of both weakness (grip<26 kg) and low lean mass (ALM/BMI<0.789)
FNIH definition #2: Presence of slowness (gait≤0.8 m/s), weakness (grip<26 kg) and low lean mass (ALM/BMI<0.789)
IWG = International Working Group; EWGSOP = European Working Group for Sarcopenia in Older Persons, FNIH = Foundation for NIH Sarcopenia Project, ALM=appendicular lean mass, BMI = body mass index, NRI = net reclassification improvement.
During follow-up (9.8±3.0 years), 207 men (3.5%) experienced a hip fracture. There was no association between sarcopenia (IWG, EWGSOP, Newman or Baumgartner) or “weakness and low lean mass” by the FNIH (definition #1) and hip fracture risk (Figure 1). Men with “slowness with weakness and low lean mass” by the FNIH (definition #2) had a 4-fold increased risk of hip fracture compared to those without this condition, although the confidence intervals were wide. When compared to the referent model with age and BMD, the addition of none of the sarcopenia definitions resulted in significant changes in the C-statistic. None of the sarcopenia definitions significantly improved the reclassification of participants compared to a referent model (overall NRI −0.06 to 0.01, p>0.05) (Table 3).
During follow-up (4.6±0.4 years), 590 (15.8%) men had a new functional limitation. Men who met the Newman, IWG or EWGSOP definition had an increased likelihood of functional limitation. There was no association between the Baumgartner definition or the FNIH “weakness and low lean mass” (definition #1) and development of a functional limitation. The association between the FNIH definition “slowness with weakness and low lean mass” (definition #2) and functional limitation could not be estimated as only one of the participants in this subset (those free of functional limitations at baseline met the criteria for the FNIH definition #2.
During follow-up (9.8±3.0 years), 2003 men (34.1%) died. Men who met any definition of sarcopenia had an increased risk of mortality compared to those without these conditions (Figure 1). When compared to the referent model with age alone, changes in the C-statistic with the addition of the all sarcopenia definitions were statistically significant but very small in magnitude (0.001 to 0.004, p<0.05).For sarcopenia definitions that included a weakness or slowness component, the NRI showed improved reclassification for those men without an event (0.05 to 0.26), but frequent reclassification in the inappropriate direction for those with events (0.18 to 0.41) resulted in overall reclassification in the inappropriate direction (−0.07 to −0.16) (Table 3). The Baumgartner and Newman definitions that include lean mass alone demonstrated significant overall reclassification in the appropriate direction (0.20 and 0.15) for mortality. This reclassification was primarily due to correct reclassification of a large number of men without events (0.40 and 0.38) that was partly off-set by inappropriate reclassification in non-events (−0.20 and −0.23).
We evaluated the FNIH alternative definitions (Table 4.) The FNIH alternative definitions did not materially change estimates for falls, hip fracture, functional limitations and mortality when compared to the primary FNIH definitions. Neither of the FNIH alternative summary definitions significantly changed the AUC compared to the referent model, with the exception of the alternative definition #1 and a small change in the C-statistic for mortality. In addition, overall NRI for these outcomes was either not significant, or was in the inappropriate direction.
Table 4.
Association, Discrimination and Reclassification for FNIH Alternative Sarcopenia Definitions with Falls, Functional Limitation, Hip Fractures and Mortality in Older Men
| Recurrent falls | FNIH Alternative Sarcopenia Classification | |
|---|---|---|
| Definition #1 | Definition #2 | |
| Association and discrimination | ||
| OR (95% CI) in model with age alone | 2.33 (1.32, 4.10) | 2.37 (0.79, 7.07) |
| Change in AUC (95% CI) compared to model with age alone | 0.003 (−0.001, 0.007) | 0.000 (−0.001, 0.001) |
| Reclassification | ||
| Among those with event (N=694)a | ||
| Appropriately reclassified | 18 (3%) | 5 (1%) |
| Inappropriately reclassified | 105 (15%) | 40 (6%) |
| No change | 571 (82%) | 649 (94%) |
| NRI c (95%CI), events | −0.13 (−0.16, −0.10) | −0.05 (−0.07, −0.03) |
| Among those without event (N=5134)b | ||
| Appropriately reclassified | 433 (8%) | 159 (3%) |
| Inappropriately reclassified | 45 (1%) | 11 (0%) |
| No change | 4656 (91%) | 4964 (97%) |
| NRI (95%CI), non-events | 0.08 (0.07, 0.08) | 0.03 (0.02, 0.03) |
| Overall NRI (95% CI) | −0.05 (−0.08, −0.02) | −0.02 (−0.04, 0.00) |
|
| ||
| Hip Fractures | ||
| Association and discrimination | ||
| HR (95% CI) in model with age + BMD | 1.68 (0.74, 3.81) | 5.46 (1.71, 17.46) |
| Change in C-statistic (95% CI) compared to model with age + BMD | −0.001 (−0.001, 0.000) | 0.000 (−0.001, 0.000) |
| Reclassification | ||
| Among those with event (N=207)a | ||
| Appropriately reclassified | 6 (3%) | 3 (1%) |
| Inappropriately reclassified | 11 (5%) | 17 (8%) |
| No change | 190 (92%) | 187 (90%) |
| NRI c (95%CI), events | −0.02 (−0.06, 0.01) | −0.07 (−0.11, −0.03) |
| Among those without event (N=5727)b | ||
| Appropriately reclassified | 185 (3%) | 213 (4%) |
| Inappropriately reclassified | 60 (1%) | 53 (1%) |
| No change | 5482 (96%) | 5461 (95%) |
| NRI (95%CI), non-events | 0.02 (0.02, 0.03) | 0.03 (0.02,0.03) |
| Overall NRI (95% CI) | 0.00 (−0.04, 0.04) | −0.04 (−0.08, 0.00) |
|
| ||
| Functional Limitations | ||
| Association and discrimination | ||
| OR (95% CI) in model with age alone | 1.01 (0.81, 1.23) | 1.30 (1.04, 1.65) |
| Change in AUC (95% CI) compared to model with age alone | 0.000 (−0.001, 0.001) | 0.001 (−0.005, 0.007) |
| Reclassification | ||
| Among those with event (N=590)a | ||
| Appropriately reclassified | 38 (6%) | 133 (23%) |
| Inappropriately reclassified | 0 (0%) | 236 (40%) |
| No change | 552 (94%) | 221 (37%) |
| NRI c (95%CI), events | 0.06 (0.04, 0.08) | −0.17 (−0.24, −0.11) |
| Among those without event (N=3136)b | ||
| Appropriately reclassified | 1 (0%) | 982 (31%) |
| Inappropriately reclassified | 147 (5%) | 495 (16%) |
| No change | 2988 (95%) | 1659 (53%) |
| NRI (95%CI), non-events | −0.05 (−0.05, −0.04) | 0.16 (0.13, 0.18) |
| Overall NRI (95% CI) | 0.02 (0.00, 0.04) | −0.02 (−0.09, 0.05) |
|
| ||
| Mortality | ||
| Association and discrimination | ||
| HR (95% CI) in model with age alone | 2.03 (1.51, 2.73) | 3.49 (2.01, 6.05) |
| Change in C-statistic (95% CI) compared to model with age and BMD | 0.002 (0.001, 0.003) | 0.001 (0.000, 0.002) |
| Reclassification | ||
| Among those with event (N=2003)a | ||
| Appropriately reclassified | 52 (3%) | 22 (1%) |
| Inappropriately reclassified | 551 (28%) | 306 (15%) |
| No change | 1400 (70%) | 1675 (84%) |
| NRI c (95%CI), events | −0.25 (−0.27, −0.23) | −0.14 (−0.16, −0.13) |
| Among those without event (N=3866)b | ||
| Appropriately reclassified | 641 (17%) | 222 (6%) |
| Inappropriately reclassified | 123 (3%) | 130 (3%) |
| No change | 3102 (80%) | 3514 (91%) |
| NRI (95%CI), non-events | 0.13 (0.12, 0.15) | 0.02 (0.01, 0.03) |
| Overall NRI (95% CI) | −0.12 (−0.14, −0.09) | −0.12 (−0.14, −0.10) |
Bold text indicates p<0.05.
For recurrent falls, AUC for model with age alone was 0.577.
For hip fractures, C-statistic for model with age and BMD was 806.
For functional limitations, AUC for model with age alone was 0.632
For mortality, C-statistic for model with age alone was 0.684.
FNIH alternative definition #1: Presence of both weakness (grip<26 kg) and low lean mass (ALM<19.75 kg)
FNIH alternative definition #2: Presence of slowness (gait≤0.8 m/s), weakness (grip<26 kg) and low lean mass (ALM<19.75 kg)
FNIH = Foundation for NIH Sarcopenia Project, ALM=appendicular lean mass, AUC=area under the curve, BMD=bone mineral density, NRI = net reclassification improvement
For events, appropriate reclassification occurs when estimated risk increases when the additional factor is added to the model; inappropriate reclassification occurs when estimated risk decreases when the additional factor is added to the model.
For non-events, appropriate reclassification occurs when estimated risk decreases when the additional factor is added to the model; inappropriate reclassification occurs when estimated risk increases when the additional factor is added to the model.
Discussion
In sum, our results suggest that these proposed definitions of sarcopenia as currently constructed would be of limited clinical utility in healthy, community dwelling men. Despite differences between the definitions in cut-points for gait speed, grip strength and lean mass, the risk estimates for falls, fracture and mortality were increased and fairly similar across the definitions. The proposed sarcopenia definitions do not appear to materially change discrimination based on AUC and C-statistic analyses for falls, hip fracture, functional limitations or mortality compared to simple models. Overall, only the Baumgartner and Newman definitions significantly improved reclassification in the appropriate direction for mortality; none of other definitions significantly reclassified men in the expected direction in terms of risk of recurrent falls, hip fractures, functional limitations or mortality when compared to simple models.
One challenge for evaluating usefulness of a definition of sarcopenia is that the selection of the outcome against which to evaluate candidate definitions is not obvious. Age-related decline in muscle function is likely related to a host of outcomes including falls, fractures, functional limitation, hospitalization, disability and mortality. For example, physical performance, particularly slow gait speed, is related to falls, hip fracture, disability, and mortality.21, 25–28 Thus, no single outcome can serve as a gold standard against which to evaluate potential clinical definitions of sarcopenia. A few reports have evaluated individual consensus definitions against single outcomes such as mortality,29–31 but have not undertaken more complete analyses comparing the predictive validity of multiple proposed definitions of sarcopenia with risk of several adverse outcomes simultaneously as we have done here.
Recent analyses have supported an association between the FNIH components (the low lean mass criterion using ALM/BMI and/or the weakness criterion) or the composite definition with limitations in walking, disability or physical performance in older adults,32–34 although these reports did not evaluate discrimination or reclassification of the FNIH sarcopenia definition or its components. One report in older adults in Hong Kong found that none of several sarcopenia definitions considered predicted incident physical limitations and that AUC for the various definitions were similarly low.35 With regard to hip fracture, we found that the c-statistic for a simple model with age and BMD alone was 0.806, and that none of the sarcopenia definitions significantly improved the c-statistic above this simple model. The discriminative ability of the FRAX algorithm36 for fracture risk has been previously evaluated in MrOS; the AUC in those models that accounted for the competing risk of mortality were 0.77 for the FRAX algorithm that included BMD and 0.69 for the FRAX algorithm that did not include BMD.37
We initially postulated that a clinical diagnosis of sarcopenia would identify those at high risk of these adverse outcomes, as decreased physical performance and strength (and to a lesser extent low lean mass) have been previously associated with falls, hip fractures, disability, and mortality.21, 25, 27, 28 However, our results do not support this hypothesis, and there are several possible reasons for our findings. First, the proposed operational definitions may not correctly identify the underlying condition. Refinement of the definition of sarcopenia, with omission of some criteria and addition of others, may more accurately identify those at risk. For example, while slow gait speed appears to increased risk of many health outcomes,26, 28 alternative measures, such as inability to rise from chair, may better stratify those at risk of poor outcomes. In previous analyses in MrOS, we found that men unable to rise from a chair had an 8-fold increased risk of hip fracture compared to men with the fastest (best) performance on the repeat chair stand test.21 However, we have not yet evaluated the reclassification and discriminative ability chair rise performance for the outcomes examined in the present analyses. Similarly, although assessment of grip strength is highly reproducible,38 and is associated with falls, hip fractures, disability and mortality,21, 25, 39, 40 it is possible that lower extremity strength is a more clinically relevant measure in terms of risk stratification. However, lower extremity strength is more difficult to accurately measure in a clinical setting than is grip strength. Also, muscle power includes both strength and velocity; alternative definitions of sarcopenia with a criterion based on power may improve discriminative ability, but again, measures of lower extremity power are also difficult to assess in clinical settings. In addition, lean mass from DXA is only a surrogate measure of muscle mass41, and more direct and precise assessment of muscle mass could lead to different results. In addition, aside from the Newman definition, none of the sarcopenia definitions take into account fat mass. Criteria that include the relative amount of lean mass to fat mass as well as physical function have not been developed and may provide better predictive validity than current measures that do not account for fat. Another possibility is that sarcopenia, as currently conceptualized, is not a true clinical syndrome, in that the presence of this condition does not increase the risk of subsequent poor outcomes regardless of the operational definition used.
MrOS is a large, well characterized cohort with little loss to follow-up and excellent assessment of endpoints. However, a few limitations must be noted. First, the MrOS cohort was relatively healthy and well-functioning, overweight, with a low prevalence of sarcopenia at baseline, especially for the definitions of sarcopenia that include both low lean mass and a functional component. The results of these analyses may differ in a less healthy population with a higher prevalence of sarcopenia or with higher or lower body weight. However, if these definitions of sarcopenia are found to be more discriminative in terms of risk of poor outcomes in more infirm populations, such evidence would not necessarily support the use of the definitions in a general clinic population. Second, the MrOS cohort is all male and mostly white. Therefore, extrapolation of these results to other groups may not be warranted. Separate criteria for sarcopenia for non-white race groups have been suggested, for example for Asians;42 however these criteria are not data driven and the predictive and discriminative ability of these race-specific criteria have not been evaluated. Further evaluation or development of sarcopenia definitions in non-white populations is warranted. Third, MrOS data were included in the pooled analyses that were used, in part, to develop the FNIH sarcopenia definitions. Thus, we initially expected that the FNIH definitions (and their alternatives) may perform better (in terms of discrimination and reclassification) than the other definitions that did not directly employ MrOS data in their construction. However, none of the definitions of sarcopenia performed well; thus, the inclusion of the MrOS data in the previous analyses was unlikely to influence our conclusions. Fourth, we only evaluated sarcopenia measures from a single visit. We have not determined the extent to which sarcopenia status changes over time and whether fluctuating sarcopenia status confers risk of clinical outcomes. Finally, the use of the NRI to evaluate a new marker has been criticized for several reasons,43, 44 mostly notably because the NRI statistic does not weigh the importance of reclassification based on clinical consequences; that is, the importance of reclassification of those with events is given equal weight to reclassification in those without events. However, even when our data are interpreted without the calculation of the overall NRI, our conclusions are unchanged. The goal of adding new information about sarcopenia to a clinical assessment is to better identify those at risk of poor outcomes, rather than excluding those at lower risk. In our data, adding information about sarcopenia resulted in lower estimated risk of the outcome amongst those who went on to have an event which would result in correctly identifying fewer, not more, men at risk of adverse outcomes. Thus, even without relying on the overall NRI, we still conclude that the sarcopenia definitions do not help identify men who are at risk of adverse outcomes.
We conclude that although sarcopenia by any of the definitions used was associated with an increased likelihood of recurrent falls and an increased risk of mortality (and less consistently associated with risk of hip fractures and functional limitations), the definitions do not improve on age alone in terms of discrimination and reclassification of risk of important adverse outcomes in community dwelling older men. Thus, in their current state these definitions are unlikely to be clinically useful in a general population of older men. Before implementation of any sarcopenia definition in clinical practice, it should be shown to be useful in predicting geriatric outcomes of interest as well as providing good discrimination and reclassification of risk of these outcomes. Future studies should investigate the utility of these criteria in populations at higher risk of adverse outcomes.
Acknowledgments
The authors would like to acknowledge Ms. Augusta Broughton for her administrative assistance with the manuscript.
The Osteoporotic Fractures in Men (MrOS) Study is supported by National Institutes of Health funding. The following institutes provide support: the National Institute on Aging (NIA), the National Institute of Arthritis and Musculoskeletal and Skin Diseases (NIAMS), the National Center for Advancing Translational Sciences (NCATS), and NIH Roadmap for Medical Research under the following grant numbers: U01 AG027810, U01 AG042124, U01 AG042139, U01 AG042140, U01 AG042143, U01 AG042145, U01 AG042168, U01 AR066160, and UL1 TR000128. The sponsor had no role in design and conduct of the study; collection, management, analysis, and interpretation of the data; and preparation, review, or approval of the manuscript. CGL receives support from a VA Clinical Science Research and Development Career Development Award, Project number 5IK2CW000729-02.
Sponsor’s role: The sponsor had no role in the design, methods, subject recruitment, data collections, analysis or preparation of paper.
Footnotes
Conflict of interest: Dr. Cawthon reports consultancy with Amgen, Eli Lilly and KineMed, and grants to her institution from IMS Health, GlaxoSmithKline, Merck and Amgen for work outside this manuscript. Dr. Ensrud serves as a consultant on a Data Monitoring Committee for Merck Sharpe & Dohme. Dr. Cummings reports consultancy with Eli Lilly and GlaxoSmithKline for work outside this manuscript. Drs. Orwoll, Hoffman, Nevitt, Lee, Lane, Barrett-Connor, Kado, Cauley and Stefanick, and Ms. Blackwell have nothing to disclose.
Authors’s Contributions: PMC monitored data collection for the whole study, wrote the statistical analysis plan, drafted and revised the paper. She is guarantor. TLB analyzed the data, and drafted and revised the paper. JC, EB-C, MLS, KEE and ESO enrolled study participants at their clinical sites, and revised the paper. SRC oversaw the study design at the study coordinating center and revised the paper. DMK, CGL, ARH, MMN and NEL revised the draft paper. All authors designed the study.
Contributor Information
Peggy M Cawthon, Scientist, California Pacific Medical Center Research Institute, San Francisco Coordinating Center, 550 16th Street, 2nd floor, Box #0560, San Francisco, CA 94158, 415 514 8150 (fax), 415 4766 084.
Terri L Blackwell, Senior Biostatistician, California Pacific Medical Center Research Institute, San Francisco Coordinating Center, 550 16th Street, 2nd floor, Box #0560, San Francisco, CA 94158.
Jane Cauley, Professor, University of Pittsburgh, A510 Crabtree Hall, Pittsburgh, PA 15261.
Deborah M Kado, Associate Professor, University of California, San Diego, 8899 University Center Lane, San Diego, CA 92122.
Elizabeth Barrett-Connor, Professor, University of California, San Diego, 9500 Gilman Drive, Mail Code 0607, La Jolla, CA 92093-0607.
Christine G Lee, Staff Physician, Portland VA Medical Center, 3710 SW US Veterans Hospital Rd., R&D 45, Portland, OR 97239.
Andrew R Hoffman, Professor, Stanford University, 300 Pasteur Dr, A175 MC 5303, Stanford, CA 94305.
Michael M Nevitt, Professor, UCSF, San Francisco Coordinating Center, 550 16th Street, 2nd floor, Box #0560San Francisco, CA 94158.
Marcia L Stefanick, Professor, Stanford University, Medical School Office Building, 1265 Welch Rd, Room X308, Stanford, CA 94305-5411.
Nancy E Lane, Professor, U.C. Davis Medical Center, University of California, Davis, 4625 2nt Avenue, Suite 2001, Sacramento, California 95817.
Kristine E Ensrud, Professor, University of Minnesota and Minneapolis VA Health System, One Veterans Drive, Minneapolis, MN 55417.
Steven R Cummings, Senior Scientist, California Pacific Medical Center Research Institute, 185 Berry Street, Suite 5700, San Francisco, CA 94107.
Eric S Orwoll, Professor, Oregon Health and Science University, 3181 SW Sam Jackson Park Rd, Portland, OR 97201.
References
- 1.Cruz-Jentoft AJ, Baeyens JP, Bauer JM, et al. Sarcopenia: European consensus on definition and diagnosis: Report of the European Working Group on Sarcopenia in Older People. Age and ageing. 2010;39:412–423. doi: 10.1093/ageing/afq034. [DOI] [PMC free article] [PubMed] [Google Scholar]
- 2.Fielding RA, Vellas B, Evans WJ, et al. Sarcopenia: an undiagnosed condition in older adults. Current consensus definition: prevalence, etiology, and consequences. International working group on sarcopenia. Journal of the American Medical Directors Association. 2011;12:249–256. doi: 10.1016/j.jamda.2011.01.003. [DOI] [PMC free article] [PubMed] [Google Scholar]
- 3.Muscaritoli M, Anker SD, Argiles J, et al. Consensus definition of sarcopenia, cachexia and pre-cachexia: joint document elaborated by Special Interest Groups (SIG) “cachexia-anorexia in chronic wasting diseases” and “nutrition in geriatrics”. Clin Nutr. 2010;29:154–159. doi: 10.1016/j.clnu.2009.12.004. [DOI] [PubMed] [Google Scholar]
- 4.Morley JE, Abbatecola AM, Argiles JM, et al. Sarcopenia with limited mobility: an international consensus. Journal of the American Medical Directors Association. 2011;12:403–409. doi: 10.1016/j.jamda.2011.04.014. [DOI] [PMC free article] [PubMed] [Google Scholar]
- 5.Alley DE, Shardell MD, Peters KW, et al. Grip Strength Cutpoints for the Identification of Clinically Relevant Weakness. J Gerontol A Biol Sci Med Sci. 2014;69:559–566. doi: 10.1093/gerona/glu011. [DOI] [PMC free article] [PubMed] [Google Scholar]
- 6.Studenski SA, Peters KW, Alley DE, et al. The FNIH Sarcopenia Project: Rationale, Study Description, Conference Recommendations and Final Estimates. J Gerontol A Biol Sci Med Sci. 2014;69:547–558. doi: 10.1093/gerona/glu010. [DOI] [PMC free article] [PubMed] [Google Scholar]
- 7.Cawthon PM, Peters KW, Shardell MD, et al. Cut-points for low appendicular lean mass that identify older adults with clinically significant weakness. J Gerontol A Biol Sci Med Sci. 2014;69:567–575. doi: 10.1093/gerona/glu023. [DOI] [PMC free article] [PubMed] [Google Scholar]
- 8.Epidemiologic and methodologic problems in determining nutritional status of older persons. Am J Clin Nutr; Proceedings of a conference; Albuquerque, New Mexico. October 19–21, 1988; 1989. pp. 1121–1235. [PubMed] [Google Scholar]
- 9.Baumgartner RN, Koehler KM, Gallagher D, et al. Epidemiology of sarcopenia among the elderly in New Mexico. Am J Epidemiol. 1998;147:755–763. doi: 10.1093/oxfordjournals.aje.a009520. [DOI] [PubMed] [Google Scholar]
- 10.Janssen I. Influence of sarcopenia on the development of physical disability: the Cardiovascular Health Study. Journal of the American Geriatrics Society. 2006;54:56–62. doi: 10.1111/j.1532-5415.2005.00540.x. [DOI] [PubMed] [Google Scholar]
- 11.Janssen I, Heymsfield SB, Ross R. Low relative skeletal muscle mass (sarcopenia) in older persons is associated with functional impairment and physical disability. Journal of the American Geriatrics Society. 2002;50:889–896. doi: 10.1046/j.1532-5415.2002.50216.x. [DOI] [PubMed] [Google Scholar]
- 12.Zoico E, Di Francesco V, Mazzali G, et al. High baseline values of fat mass, independently of appendicular skeletal mass, predict 2-year onset of disability in elderly subjects at the high end of the functional spectrum. Aging clinical and experimental research. 2007;19:154–159. doi: 10.1007/BF03324682. [DOI] [PubMed] [Google Scholar]
- 13.Ramsay SE, Whincup PH, Shaper AG, Wannamethee SG. The relations of body composition and adiposity measures to ill health and physical disability in elderly men. Am J Epidemiol. 2006;164:459–469. doi: 10.1093/aje/kwj217. [DOI] [PubMed] [Google Scholar]
- 14.Visser M, Harris TB, Langlois J, et al. Body fat and skeletal muscle mass in relation to physical disability in very old men and women of the Framingham Heart Study. The journals of gerontology Series A, Biological sciences and medical sciences. 1998;53:M214–221. doi: 10.1093/gerona/53a.3.m214. [DOI] [PubMed] [Google Scholar]
- 15.Visser M, Langlois J, Guralnik JM, et al. High body fatness, but not low fat-free mass, predicts disability in older men and women: the Cardiovascular Health Study. Am J Clin Nutr. 1998;68:584–590. doi: 10.1093/ajcn/68.3.584. [DOI] [PubMed] [Google Scholar]
- 16.Visser M, Goodpaster BH, Kritchevsky SB, et al. Muscle mass, muscle strength, and muscle fat infiltration as predictors of incident mobility limitations in well-functioning older persons. The journals of gerontology Series A, Biological sciences and medical sciences. 2005;60:324–333. doi: 10.1093/gerona/60.3.324. [DOI] [PubMed] [Google Scholar]
- 17.Newman AB, Kupelian V, Visser M, et al. Sarcopenia: alternative definitions and associations with lower extremity function. Journal of the American Geriatrics Society. 2003;51:1602–1609. doi: 10.1046/j.1532-5415.2003.51534.x. [DOI] [PubMed] [Google Scholar]
- 18.Blank JB, Cawthon PM, Carrion-Petersen ML, et al. Overview of recruitment for the osteoporotic fractures in men study (MrOS) Contemp Clin Trials. 2005;26:557–568. doi: 10.1016/j.cct.2005.05.005. [DOI] [PubMed] [Google Scholar]
- 19.Orwoll E, Blank JB, Barrett-Connor E, et al. Design and baseline characteristics of the osteoporotic fractures in men (MrOS) study–a large observational study of the determinants of fracture in older men. Contemp Clin Trials. 2005;26:569–585. doi: 10.1016/j.cct.2005.05.006. [DOI] [PubMed] [Google Scholar]
- 20.Lee CG, Boyko EJ, Nielson CM, et al. Mortality risk in older men associated with changes in weight, lean mass, and fat mass. Journal of the American Geriatrics Society. 2011;59:233–240. doi: 10.1111/j.1532-5415.2010.03245.x. [DOI] [PMC free article] [PubMed] [Google Scholar]
- 21.Cawthon PM, Fullman RL, Marshall L, et al. Physical performance and risk of hip fractures in older men. Journal of bone and mineral research: the official journal of the American Society for Bone and Mineral Research. 2008;23:1037–1044. doi: 10.1359/JBMR.080227. [DOI] [PMC free article] [PubMed] [Google Scholar]
- 22.Washburn RA, Smith KW, Jette AM, Janney CA. The Physical Activity Scale for the Elderly (PASE): development and evaluation. J ClinEpidemiol. 1993;46:153–162. doi: 10.1016/0895-4356(93)90053-4. [DOI] [PubMed] [Google Scholar]
- 23.Harrell FE, Jr, Lee KL, Mark DB. Multivariable prognostic models: issues in developing models, evaluating assumptions and adequacy, and measuring and reducing errors. Stat Med. 1996;15:361–387. doi: 10.1002/(SICI)1097-0258(19960229)15:4<361::AID-SIM168>3.0.CO;2-4. [DOI] [PubMed] [Google Scholar]
- 24.Pencina MJ, D’Agostino RB, Sr, Steyerberg EW. Extensions of net reclassification improvement calculations to measure usefulness of new biomarkers. Stat Med. 2011;30:11–21. doi: 10.1002/sim.4085. [DOI] [PMC free article] [PubMed] [Google Scholar]
- 25.Chan BK, Marshall LM, Winters KM, Faulkner KA, Schwartz AV, Orwoll ES. Incident Fall Risk and Physical Activity and Physical Performance among Older Men: The Osteoporotic Fractures in Men Study. Am J Epidemiol. 2007;165:696–703. doi: 10.1093/aje/kwk050. [DOI] [PubMed] [Google Scholar]
- 26.Studenski S, Perera S, Patel K, et al. Gait speed and survival in older adults. Jama. 2011;305:50–58. doi: 10.1001/jama.2010.1923. [DOI] [PMC free article] [PubMed] [Google Scholar]
- 27.Cooper R, Kuh D, Hardy R. Objectively measured physical capability levels and mortality: systematic review and meta-analysis. Bmj. 2010;341:c4467. doi: 10.1136/bmj.c4467. [DOI] [PMC free article] [PubMed] [Google Scholar]
- 28.Guralnik JM, Ferrucci L, Pieper CF, et al. Lower extremity function and subsequent disability: consistency across studies, predictive models, and value of gait speed alone compared with the short physical performance battery. The journals of gerontology Series A, Biological sciences and medical sciences. 2000;55:M221–M231. doi: 10.1093/gerona/55.4.m221. [DOI] [PubMed] [Google Scholar]
- 29.Dam TL, Peters KW, Fragala MS, et al. An Evidence-Based Comparison of Operational Criteria for the Presence of Sarcopenia. J Gerontol A Biol Sci Med Sci. 2014;69:584–590. doi: 10.1093/gerona/glu013. [DOI] [PMC free article] [PubMed] [Google Scholar]
- 30.McLean RR, Shardell MD, Alley DE, et al. Criteria for Clinically Relevant Weakness and Low Lean Mass and Their Longitudinal Association With Incident Mobility Impairment and Mortality: The Foundation for the National Institutes of Health (FNIH) Sarcopenia Project. J Gerontol A Biol Sci Med Sci. 2014;69:576–583. doi: 10.1093/gerona/glu012. [DOI] [PMC free article] [PubMed] [Google Scholar]
- 31.Landi F, Cruz-Jentoft AJ, Liperoti R, et al. Sarcopenia and mortality risk in frail older persons aged 80 years and older: results from ilSIRENTE study. Age and ageing. 2013;42:203–209. doi: 10.1093/ageing/afs194. [DOI] [PubMed] [Google Scholar]
- 32.Cooper R, Bann D, Wloch EG, Adams JE, Kuh D. “Skeletal muscle function deficit” in a nationally representative british birth cohort in early old age. The journals of gerontology Series A, Biological sciences and medical sciences. 2015;70:604–607. doi: 10.1093/gerona/glu214. [DOI] [PMC free article] [PubMed] [Google Scholar]
- 33.Hirani V, Blyth F, Naganathan V, et al. Sarcopenia Is Associated With Incident Disability, Institutionalization, and Mortality in Community-Dwelling Older Men: The Concord Health and Ageing in Men Project. Journal of the American Medical Directors Association. 2015 doi: 10.1016/j.jamda.2015.02.006. [DOI] [PubMed] [Google Scholar]
- 34.Spira D, Buchmann N, Nikolov J, et al. Association of Low Lean Mass With Frailty and Physical Performance: A Comparison Between Two Operational Definitions of Sarcopenia-Data From the Berlin Aging Study II (BASE-II) The journals of gerontology Series A, Biological sciences and medical sciences. 2015 doi: 10.1093/gerona/glu246. [DOI] [PubMed] [Google Scholar]
- 35.Woo J, Leung J, Morley JE. Defining sarcopenia in terms of incident adverse outcomes. Journal of the American Medical Directors Association. 2015;16:247–252. doi: 10.1016/j.jamda.2014.11.013. [DOI] [PubMed] [Google Scholar]
- 36.Kanis JA, Oden A, Johnell O, et al. The use of clinical risk factors enhances the performance of BMD in the prediction of hip and osteoporotic fractures in men and women. Osteoporosis international: a journal established as result of cooperation between the European Foundation for Osteoporosis and the National Osteoporosis Foundation of the USA. 2007;18:1033–1046. doi: 10.1007/s00198-007-0343-y. [DOI] [PubMed] [Google Scholar]
- 37.Ettinger B, Ensrud KE, Blackwell T, Curtis JR, Lapidus JA, Orwoll ES. Performance of FRAX in a cohort of community-dwelling, ambulatory older men: the Osteoporotic Fractures in Men (MrOS) study. Osteoporosis international: a journal established as result of cooperation between the European Foundation for Osteoporosis and the National Osteoporosis Foundation of the USA. 2013;24:1185–1193. doi: 10.1007/s00198-012-2215-3. [DOI] [PMC free article] [PubMed] [Google Scholar]
- 38.Roberts HC, Denison HJ, Martin HJ, et al. A review of the measurement of grip strength in clinical and epidemiological studies: towards a standardised approach. Age and ageing. 2011;40:423–429. doi: 10.1093/ageing/afr051. [DOI] [PubMed] [Google Scholar]
- 39.Rantanen T. Muscle strength, disability and mortality. Scand J Med Sci Sports. 2003;13:3–8. doi: 10.1034/j.1600-0838.2003.00298.x. [DOI] [PubMed] [Google Scholar]
- 40.Rantanen T, Guralnik JM, Foley D, et al. Midlife hand grip strength as a predictor of old age disability. Jama. 1999;281:558–560. doi: 10.1001/jama.281.6.558. [DOI] [PubMed] [Google Scholar]
- 41.Stimpson SA, Turner SM, Clifton LG, et al. Total-body creatine pool size and skeletal muscle mass determination by creatine-(methyl-d3) dilution in rats. J Appl Physiol. 2012;112:1940–1948. doi: 10.1152/japplphysiol.00122.2012. [DOI] [PubMed] [Google Scholar]
- 42.Chen LK, Liu LK, Woo J, et al. Sarcopenia in Asia: consensus report of the Asian Working Group for Sarcopenia. Journal of the American Medical Directors Association. 2014;15:95–101. doi: 10.1016/j.jamda.2013.11.025. [DOI] [PubMed] [Google Scholar]
- 43.Leening MJ, Vedder MM, Witteman JC, Pencina MJ, Steyerberg EW. Net reclassification improvement: computation, interpretation, and controversies: a literature review and clinician’s guide. Annals of internal medicine. 2014;160:122–131. doi: 10.7326/M13-1522. [DOI] [PubMed] [Google Scholar]
- 44.Vickers AJ, Pepe M. Does the net reclassification improvement help us evaluate models and markers? Annals of internal medicine. 2014;160:136–137. doi: 10.7326/M13-2841. [DOI] [PubMed] [Google Scholar]