

Abstract
Many biological processes involve the mechanistic/mammalian target of rapamycin complex 1 (mTORC1). Thus, the challenge of deciphering mTORC1-mediated functions during normal and pathological states in the central nervous system is challenging. Because mTORC1 is at the core of translation, we have investigated mTORC1 function in global and regional protein expression. Activation of mTORC1 has been generally regarded to promote translation. Few but recent works have shown that suppression of mTORC1 can also promote local protein synthesis. Moreover, excessive mTORC1 activation during diseased states represses basal and activity-induced protein synthesis. To determine the role of mTORC1 activation in protein expression, we have used an unbiased, large-scale proteomic approach. We provide evidence that a brief repression of mTORC1 activity in vivo by rapamycin has little effect globally, yet leads to a significant remodeling of synaptic proteins, in particular those proteins that reside in the postsynaptic density. We have also found that curtailing the activity of mTORC1 bidirectionally alters the expression of proteins associated with epilepsy, Alzheimer's disease, and autism spectrum disorder—neurological disorders that exhibit elevated mTORC1 activity. Through a protein–protein interaction network analysis, we have identified common proteins shared among these mTORC1-related diseases. One such protein is Parkinson protein 7, which has been implicated in Parkinson's disease, yet not associated with epilepsy, Alzheimers disease, or autism spectrum disorder. To verify our finding, we provide evidence that the protein expression of Parkinson protein 7, including new protein synthesis, is sensitive to mTORC1 inhibition. Using a mouse model of tuberous sclerosis complex, a disease that displays both epilepsy and autism spectrum disorder phenotypes and has overactive mTORC1 signaling, we show that Parkinson protein 7 protein is elevated in the dendrites and colocalizes with the postsynaptic marker postsynaptic density-95. Our work offers a comprehensive view of mTORC1 and its role in regulating regional protein expression in normal and diseased states.
The mechanistic/mammalian target of rapamycin complex 1 (mTORC1)1 is a serine/threonine protein kinase that is highly expressed in many cell types (1). In the brain, mTORC1 tightly coordinates different synaptic plasticities — long-term potentiation (LTP) and long-term depression (LTD) — the molecular correlates of learning and memory (2–5). Because mTORC1 is at the core of many synaptic signaling pathways downstream of glutamate and neurotrophin receptors, many hypothesize that dysregulated mTORC1 signaling underlies cognitive deficits observed in several neurodegenerative diseases (3, 6–17). For example, mTORC1 and its downstream targets are hyperactive in human brains diagnosed with Alzheimer's disease (AD) (18–20). Additionally in animal models of autism spectrum disorder (ASD), altered mTORC1 signaling contributes to the observed synaptic dysfunction and aberrant network connectivity (13, 15, 21–27). Furthermore, epilepsy, which is common in AD and ASD, has enhanced mTORC1 activity (28–32).
Phosphorylation of mTORC1, considered the active form, is generally regarded to promote protein synthesis (33). Thus, many theorize that diseases with overactive mTORC1 arise from excessive protein synthesis (14). Emerging data, however, show that suppressing mTORC1 activation can trigger local translation in neurons (34, 35). Pharmacological antagonism of N-methyl-d-aspartate (NMDA) receptors, a subtype of glutamate receptors that lies upstream of mTOR activation, promotes the synthesis of the voltage-gated potassium channel, Kv1.1, in dendrites (34, 35). Consistent with these results, in models of temporal lobe epilepsy there is a reduction in the expression of voltage-gated ion channels including Kv1.1 (30, 31, 36). Interestingly in a model of focal neocortical epilepsy, overexpression of Kv1.1 blocked seizure activity (37). Because both active and inactive mTORC1 permit protein synthesis, we sought to determine the proteins whose expression is altered when mTORC1 phosphorylation is reduced in vivo.
Rapamycin is an FDA-approved, immunosuppressive drug that inhibits mTORC1 activity (38). We capitalized on the ability of rapamycin to reduce mTORC1 activity in vivo and the unbiased approach of mass spectrometry to identify changes in protein expression. Herein, we provide evidence that mTORC1 activation bidirectionally regulates protein expression, especially in the PSD where roughly an equal distribution of proteins dynamically appear and disappear. Remarkably, using protein–protein interaction networks facilitated the novel discovery that PARK7, a protein thus far only implicated in Parkinson's disease, (1) is up-regulated by increased mTORC1 activity, (2) resides in the PSD only when mTORC1 is active, and (3) is aberrantly expressed in a rodent model of TSC, an mTORC1-related disease that has symptoms of epilepsy and autism. Collectively, these data provide the first comprehensive list of proteins whose abundance or subcellular distributions are altered with acute changes in mTORC1 activity in vivo.
EXPERIMENTAL PROCEDURES
Sample Preparation
We used three sets of paired sibling male Sprague-Dawley rats (seven to 9-weeks old) that were housed together. Within each pair, one received rapamycin (10 mg/kg) and the other received an equal volume of DMSO (carrier, control) via intraperitoneal (intraperitoneal) injection. After one hour, the animals were sacrificed. Cortices were homogenized, nuclei were pelleted by low speed centrifugation (100 × g), and the resulting supernatant was analyzed as cell lysates (L). To obtain synaptoneurosomes, homogenized cortices were processed as described (39). An aliquot of the synaptoneurosome fraction from each animal was solubilized in 1% triton X-100 (10min) and centrifuged (12,000 × g) to yield a triton X-100-soluble fraction (soluble, S) and a triton X-100-insoluble fraction (pellet, PSD). To prepare protein for LC-MS/MS, lysates, soluble, and PSD fractions were further solubilized in SDS-sample buffer. SDS-solubilized fractions were run on a 10% SDS-polyacrylamide gel (4min). The migration was stopped as the ladder began to separate. Gel plugs containing the sample were sectioned and sent for mass spectrometry analysis. Animal experiments were performed according to the National Institutes of Health's Guide for the Care and Use of Laboratory Animals and approved by the UT-Austin Institutional Care and Usage Committee.
Western Blot Analysis
Proteins were separated by SDS-polyacrylamide gel electrophoresis (PAGE). To visualize the proteins, we used the following antibodies: rabbit anti-phospho-mTOR Ser2448 (1:2000; Cell Signaling, Danvers, MA), mouse anti-mTOR (1:5000; Life Technologies, Grand Island, NY), mouse anti-Park7 (1:2000; Novus Biologicals, Littleton, CO) mouse anti-PSD-95 (1:10,000; NeuroMab, Davis, CA), mouse antisynapsin 1 (1:10,000; Synaptic Systems, Goettingen, Germany), rabbit polyclonal anti-α tubulin (1:50,000; Abcam, Cambridge, MA), mouse ribosomal S6 (1:1000, Cell Signaling) and rabbit anti-phospho-S6 (1:1000, Cell Signaling). Membranes were subsequently incubated in fluorescence-conjugated secondary antibodies (AF680, Life Technologies; AF800, LiCor, Lincoln, NE; 1:5000). Using the Odyssey CLx infrared imaging system, we obtained fluorescent images of the membranes. ImageJ (National Institutes of Health) software was used for densitometry analyses of proteins.
In-gel Tryptic Digestion
The gels were cut into 1 mm cubes after washing gels with water for 15min. Gel pieces were transferred to a clean Eppendorf tube followed by adding 100 μl of water and incubating for 15min. All the water was removed. This washing step was repeated with 50% acetonitrile (ACN) and 100% ACN two times. A 100 μl volume of 100 mm ammonium bicarbonate buffer was added followed by a 5min incubation. All the liquid was removed and the samples were subjected to drying in speed-vacuum until they were completely dried. For reduction/alkylation, 100 μl of 10 mm dithiothreitol (DTT) suspended in 100 mm ammonium bicarbonate buffer was added to the dried samples. This was followed by incubation in a water bath at 55 °C for 45min. After removing the alkylation solution, 100 μl of 55 mm iodoacetamide (IAA) suspended in 100 mm ammonium bicarbonate buffer was added into the reduced samples followed by incubating at 37.5 °C for 30 min. The alkylated samples were then washed with 100 μl of 100 mm ammonium bicarbonate buffer and incubated for 5min. A 100 μl of acetonitrile was added to make one to one ratio of solutions with incubation for 15min. All the solutions were removed. The samples were then dried before digestion. Trypsin digestion solution was prepared with 4 μl trypsin in 96 μl of 100 mm ammonium bicarbonate buffer. The amount of trypsin was determined using enzyme/protein ratio of 1:50 w/w because 200 μg of proteins were loaded into the gel. A 100 μl of trypsin digestion solution was added to the alkylated samples and then incubated for 45 min on ice. This allows the gels to absorb the trypsin digestion solution. The solution was removed if it was excessive. The samples were incubated at 37.5 °C overnight. The addition of 2% trifluoroacetic acid (TFA) acidified the digestion. The tryptic digests were extracted from the gel by adding 0.1%TFA and incubating in ice water bath with sonication. The solutions were then collected in a separate clean Eppendorf tube. This extraction step was repeated with 30% ACN/0.1% TFA and 60% ACN/0.1% TFA three times. The collected peptides were then dried in a speed-vacuum and resuspended in 0.1% formic acid prior to LC-MS/MS analysis.
Mass Spectrometry
LC-MS/MS
Trypsin digested samples were subjected to LC-MS/MS analysis using Dionex 3000 Ultimate nano-LC system (Dionex, Sunnyvale, CA) interfaced to LTQ Orbitrap Velos mass spectrometer (Thermo Scientific, San Jose, CA) equipped with a nano-ESI source. The samples were initially online-purified using a PepMap 100 C18 cartridge (3 μm, 100Å, Dionex). The purified peptides were then separated using a PepMap 100 C18 capillary column (75 μm id × 150 mm, 2 μm, 100Å, Dionex). The separation of peptides was achieved at 350 nl/min flow rate, using the following gradient: 0–10 min 5% solvent B (98% ACN with 0.1% formic acid), 10–65 min ramping solvent B 5–20%, 55–90 min ramping solvent B 20–30%, 90–105 min ramping solvent B 30–50%, 105–110min maintaining solvent B at 80%, 110–111 min decreasing solvent B 80–5%, and 111–120 min sustaining solvent B at 5%. Solvent A was a 2% ACN aqueous solution containing 0.1% formic acid. The separation and scan time was set to 120 min.
The LTQ Orbitrap Velos mass spectrometer was operated with three scan events. The first scan event was a full MS scan of 380–2000 m/z at a mass resolution of 15,000. The second scan event was CID MS/MS of parent ions selected from the first scan event with an isolation width of 3.0 m/z, a normalized collision energy (CE) of 35%, and an activation Q value of 0.250. The third scan event was set to acquire HCD MS/MS of the parent ions selected from the first scan event. The isolation width of HCD experiment was set to 3.0 m/z while the normalized CE was set to 45% with an activation time of 0.1 ms. The CID and HCD MS/MS were performed on the five most intense ions observed in the MS scan event.
Data Processing
Quantitation was attained employing normalized spectral counts that were calculated by Scaffold Q+ (Proteome Software, Inc., Portland, OR).
The identification of proteins/peptides was achieved using MASCOT database (40). Proteome Discoverer version 1.2 software (Thermo Scientific, San Jose, CA) was used to generate a mascot generic format file (*.mgf) that was subsequently employed for database searching using MASCOT version 2.3.2 (Matrix Science Inc., Boston, MA). Parent ions were selected from a mass range of 350–10000Da with a minimum peak count of one. The parameters from Mascot Daemon were set to search against the UniProt Rattus database (UniProt release 2013_11). Oxidation of methionine was set as a variable modification while carbamidomethylation of cysteine was as a fixed modification. The formation of propionamide adducts on cysteine, N terminus and C terminus of peptides was added as variable modification because of the use of polyacrylamide gels. Trypsin was selected with missed cleavages up to two. Peptides were searched with a precursor ion mass tolerance of 6ppm or better and fragment ion mass tolerance of 1.5Da. The MASCOT results were imported to Scaffold version 3.6.3 (41) (Proteome Software, Inc.). Scaffold probabilistically validates the identification of peptides and proteins assigned by MASCOT using PeptideProphet (42) and ProteinProphet (43) algorithms, respectively. Peptide identifications were accepted with a MASCOT ion score greater than 20, whereas protein identifications were accepted with a probability greater than 99%. The accepted proteins contain at least two identified peptides. The number of entries in the database (or subset of databases) searched was 7875 entries. The false discovery rate (FDR) was 0.2% for identification of peptides and proteins. Quantitation of identified proteins was then achieved based on spectral counts after normalization (supplemental Table S1A–S1C). The mass spectrometry proteomics data have been deposited to the ProteomeXchange Consortium (http://proteomecentral.proteomexchange.org)via the PRIDE partner repository with the data set identifier PXD002724.
Bioinformatics
Data Preparation
From the three biological replicates that were generated for each condition or treatment, namely DMSO (control) and rapamycin (supplemental Table S1A), we thresholded the identified peptides by removing proteins that returned zero spectral counts in two biological replicates from each condition. We then averaged each protein across replicates for each condition, excluding zero values from the average. The thresholded protein list for each condition was used for Gene Ontology classification as detailed below. The data were further processed by dividing the averaged rapamycin spectral count data by the averaged DMSO spectral count data for each subcellular fraction. This produced three lists of rapamycin fold-change over control for each of the subcellular fractions. Finally, we applied a log2 transformation to the fold-change data allowing us to easily compare difference in protein abundance for each protein found in its respective fraction. Mitochondrial proteins were filtered from fractions based on the MitoMiner database for R. Norvegicus mitochondrial proteins (44).
Gene Ontology Clustering
The unique protein lists for each condition described above were loaded into DAVID—an online tool for functional annotation and Gene Ontology clustering (45, 46). Data were analyzed in DAVID using the biological process (BP_FAT) ontology as well as the KEGG pathway database (KEGG_PATHWAY). We used the DAVID Functional Annotation Chart and Functional Annotation Clustering using the default settings (EASE score threshold = 0.1). DAVID EASE score is a modified version of the Fischer Exact p value that allows for comparison of cluster enrichment.
Network Analysis
Gene Ontology clustering was first performed in DAVID to produce a Functional Annotation Chart. This chart was then loaded into the Cytoscape plugin Enrichment Map which performed further enrichment to identify clusters of high overlap and visualization in the form of an undirected network (47). We used the following Enrichment Map tuning parameters to enrich DAVID results: p value cut-off = 0.001, Q-value cut-off = 0.05, and overlap coefficient cut-off = 0.6. We used both Cytoscape 2.8.3 and Cytoscape 3.1.0 for our analysis (48). Network statistics, random network generation, and network merge analysis (to identify unique GO terms in each treatment) were performed in Cytoscape 2.8.3 using the base plugins. Protein–protein interaction networks were generated using the BisoGenet plugin (49). Inputs were mapped as protein identifiers using protein–protein interaction data from the BioGRID and MINT databases. Network was built by adding neighbors to seed proteins up to a distance of 2. Our output network was represented in terms of proteins. Networks were analyzed using degree, betweenness, and closeness centrality network statistics. Hub proteins were identified using the degree network statistic.
Gene Diseases Databases
For all gene lists, we matched genes in the database overlapping with our own protein list. The ASD gene list was obtained from SFARI (Simons Foundation Autism Research Initiative) (50). The epilepsy gene list was obtained from the CarpeDB online epilepsy gene database (http://www.carpedb.ua.edu/). The Alzheimer's disease gene list was obtained from the AlzGene database top 10 list in combination with the Alzheimer's disease pathway from the KEGG Pathway database (hsa05010) (51, 52).
Statistics, Data Analysis, and Image Processing
Data processing and preparation were performed in Microsoft Excel 2010 and the R programming language (http://www.r-project.org/). Statistics and visualization was performed with the R programming language and GraphPad Prism 6. The following R packages were used for analysis: equivalence (http://cran.r-project.org/web/packages/equivalence/index.html), ggplot2, gplots (http://cran.r-project.org/web/packages/gplots/index.html), moments (http://cran.r-project.org/web/packages/moments/index.html), plyr, and reshape2 (53–57). R Scripts for generating figures and statistical analysis deposited at: http://github.com/snamjoshi/MCP2015_Niere_Namjoshi_etal.
Bio-orthogonal Noncanonical Amino Acid Tagging and Proximity Ligation Assay Tandem (BONCAT-PLA)
Visualization of new proteins was conducted similar to Workman et al. (58). Following incubation of 21 DIV hippocampal neurons in 500 μl methionine-free media for 30 min at 37 °C, azidohomoalanine (AHA, Life Technologies) and equal volume of rapamycin (final concentration = 200 nm) or DMSO were added to the media. 1 h after treatment, cells were fixed as described by Workman et al. (58, 59). Click-it metabolic labeling was then performed according to manufacturer's instructions (Life Technologies). Biotin-alkyne was used to detect new proteins. PLA was subsequently conducted according to manufacturer's directions (Duolink, Sigma). Mouse, anti-biotin (1:500, Abcam), rabbit anti-GAP-43 (1:500, Abcam), rabbit anti-SNAP-25 (1:100, Abcam), mouse anti-PARK7 (1:1000, Sigma), rabbit anti-biotin (1:500, Sigma), and chicken anti-MAP2 (1:2000, Abcam) antibodies were used.
Stereotaxic In Vivo Virus Injection And Hippocampal Immunohistochemistry
To remove TSC1 in Tsc1 conditional knockout mice (Tsc1tm1Djk/J, Jackson Laboratory, Bar Harbor, ME), Cre-recombinase and GFP packaged in adeno-associated virus (AAV-Cre and AAV-GFP) were stereotaxically injected into the hippocampus of 7 to 8-week-old male mice as described (58). The following coordinates (from bregma) were used: −2.2 mm A/P, ± 1.5 mm M/L; −2.5 mm A/P, and ± 1.6 mm M/L. Two weeks after injection, mice were transcardially perfused with phosphate buffered saline (0.1 m) and the brains were postfixed in 4% paraformaldehyde. Fifty-micrometer-thick hippocampal slices were prepared and checked for GFP expression. Slices that expressed GFP were processed from immunohistochemistry as described (60) using the following primary antibodies: mouse anti-PARK7 (1:100, Sigma Aldrich), guinea pig anti-PSD95 (1:100, Synaptic Systems), and chicken anti-MAP2 (1:500). After overnight primary antibody incubation in 4 °C, the following secondary antibodies were used: AF405, Cy3, and AF647.
Immunocytochemistry (ICC)
Dissociated hippocampal neurons, 18–25 days in vitro (DIV), were prepared from embryonic rat pups (E17–18) similar to Sosanya et al. (35). For Tsc1 cultures, neurons were prepared from postnatal (0–3 days) Tsc1 conditional knockout pups similar to Niere et al. (61). Cre-2A-GFP (Puro), CMV-lentivirus (GenTarget, Inc., San Diego, CA) was used to reduce TSC1 expression. GFP (CMV)-Puro lentiviral particles was used as a control. Virus was added to cultures at 7–9 DIV and allowed to express for 9–14 days. GFP immunofluorescence was used to identify infected pyramidal neurons. Cells were fixed in 4% paraformaldehyde for 10 min at 37 °C and permeabilized in 0.2% Triton X-100 for 10 min similar to Niere et al. (61). Fixed cells were incubated in primary rabbit anti-GAP43 (1:500, Abcam), rabbit anti-SNAP25 (1:100, Abcam), or mouse anti-PARK7 (1:1000, Sigma Aldrich), and chicken anti-MAP2 (1:2000, Abcam). Goat anti-Synapsin (1:500, Santa Cruz Biotechnology, Dallas, TX) and guinea pig anti-PSD95 (1:500, Synaptic Systems) were used to visualize the pre- and postsynaptic structures, respectively. Following overnight primary antibody incubation in 4 °C, appropriate secondary antibodies (1:500, Life Technologies) were applied: AlexaFluor488 (AF488), AF647, AF405, and Cy3 (Jackson ImmunoResearch). Note, chicken anti-MAP2 used in conjunction with AF405 produces a granular appearance when imaged. In any given cell culture experiment, image acquisition across all conditions was performed on the same day using similar duration and intensity of excitation light. All fluorescence images were acquired on a Leica SP5 disk confocal microscope (Wetzlar, Germany) using an oil-immersion, 63x lens, sampled at 1024 × 1024.
Image Analysis
For PSD-95 and synapsin colocalization analysis, Z-stacks of nine planes at 0.5 μm/plane for each dendrite were imaged. Only one plane that had the strongest signal from the protein of interest was analyzed. The Pearson's correlation coefficient (PCC) was determined using the ImageJ plugin JACoP. The same threshold value was applied across all conditions using the threshold function in ImageJ. For BONCAT-PLA, Z-stacks of eight to nine planes at 0.5 μm/plane were imaged. For BONCAT/PLA analysis, two planes, for a total of 1 μm thickness that had the brightest MAP2 signals were max projected using ImageJ. The projected images were analyzed for PLA and MAP2 immunofluorescence (IF). PLA and MAP2 signals were thresholded to at least thrice above background that remained constant within an experiment. To determine the background for each signal in Metamorph, the average fluorescence intensity in a circular region of ∼90 μm2 adjacent to the region of interest was obtained. The dendritic PLA value for each protein was normalized to the corresponding MAP2 IF as a volume control. For BONCAT-PLA measurements, the product of the total area, intensity, and puncta number of BONCAT-PLA in each dendrite was quantified. Dendritic MAP2 IF was determined by multiplying the total area and average intensity of MAP2. The BONCAT-PLA/MAP2 values were normalized to the average BONCAT-PLA/MAP2 of control (DMSO) dendrites to reflect the total change in protein with treatment. Secondary dendrites (50 μm long and 1 μm thick) were used for analysis to minimize variability in dendritic caliber. To quantify dendritic PARK7 in hippocampal slices, Z-stacks of 12 planes were used at 1 μm/plane. Only one plane where MAP2 signal is distinct but not saturated was analyzed. For each dendrite, the product of the total area and intensity of PARK7 was determined and normalized to its corresponding MAP2 immunofluorescence as a volume control. Each dendritic PARK7/MAP2 value was normalized to the average PARK7/MAP2 of wildtype dendrites. To outline the dendrites in hippocampal slices, the MAP2 signal was saturated to define the dendrite. The “Find Edges” function in ImageJ was used to create an outline of the dendrite.
RESULTS
Rapid mTORC1 Suppression In Vivo Affects Synaptic Processes
Having previously shown that repressing mTORC1 in dissociated hippocampal neurons induced Kv1.1 mRNA translation in dendrites, we sought to identify in vivo the effects of briefly reducing mTORC1 activity on the proteomic expression of the cortex (34, 35). We used naïve rats because our goal was to identify proteins that may be common across all diseases where mTORC1 activity is aberrantly regulated without biasing our data toward any one disease. We also took advantage of tandem mass spectrometry (LC-MS/MS) which can identify numerous proteins in a mixture and is not dependent upon access to antibody epitopes (62). Because local translation is rapid, we used a single intraperitoneal injection of rapamycin (10 mg/kg) and harvested cortices within one hour to detect changes in protein expression that may be because of new protein synthesis (34, 61, 63–67). To verify the effectiveness of intraperitoneal injection of rapamycin in reducing mTORC1 activity in vivo, we compared cortical lysates (Lysates) isolated from rats injected with carrier (control/DMSO) to those injected with rapamycin by Western blotting for the active form of mTORC1 (P-mTORC1) and its downstream target ribosomal S6 (P-S6). Indeed, one hour after systemic administration, rapamycin effectively reduced the activities of mTORC1 (0.50 ± 0.14 of control) and ribosomal S6 (S6) (0.21 ± 0.08 of control), as indicated by the ratio of the phosphorylated protein over the total protein (i.e. P-mTORC1/mTORC1 and P-S6/S6; Fig. 1A) (31).
Fig. 1.

Rapamycin reduces mTORC1 activity and rapidly alters translation and synaptic function. A, One hour, systemic administration of rapamycin (10 mg/kg body weight) reduced mTORC1 activity as measured by densitometric analyses of phosphorylated mTORC1 (P-mTORC1, Ser2448) and its downstream target, phosphorylated ribosomal S6 (P-S6). To obtain fold-changes in activity, ratios of P-mTORC1 to mTORC1 and P-S6 to S6 were normalized to DMSO values. In DMSO, P-mTORC1 and P-S6 values equal 1 (dashed line, home cage control). Rapamycin, P-mTORC1 = 0.50 ± 0.14; Rapamycin, P-S6 = 0.21 ± 0.08 (Mean ± S.E.). n = 3 animals per condition. Statistics: *, p < 0.05; Student's t test. B, Enrichment network comparing differences in proteins GO clustering between DMSO and rapamycin treatments for the lysate fraction. Network generated from the GO biological process database by output from the DAVID Functional Annotation Chart and further enrichment with Enrichment Map (see Experimental Procedures). Tuning parameters used to enrich DAVID results: p value cut-off = 0.001, Q-value cut-off = 0.05, overlap coefficient cut-off = 0.6. A node represents a GO biological process containing genes from the experimental treatments. An edge indicates proteins shared between nodes. Edge thickness corresponds to the number of proteins shared between nodes and edge length corresponds to enrichment overlap between nodes. Light blue lines indicate DMSO treatment and dark blue indicates rapamycin treatments. Two edges of different colors connecting the same nodes indicate proteins shared between processes for both treatments. Red lines indicate unique differences in biological processes between treatments. Green arrow indicates biological process of synaptic vesicle maturation, the node with the most unique connections. Annotations based on general description of processes contained in the cluster. Network statistics listed in supplemental Table S2.
Next, we performed LC-MS/MS analyses on cortical lysates from carrier and rapamycin treated rats. To assess the consistency of spectral count measurements among replicates (i.e. three independent rats/treatment), we measured the average standard errors across all proteins for each treatment (supplemental Fig. S1A; DMSO = 0.169 ± 0.006, RAPA = 0.157 ± 0.006). We also calculated spectral count correlations across all proteins for each replicate within a treatment (supplemental Fig. S1B; r2 > 0.93 (DMSO), r2 > 0.94 (RAPA), average r2 across replicates). The small variability in standard error and tight correlation among all replicates across all proteins in each treatment denote consistent sample preparation and spectral count measurements.
We first ascertained the global influence of rapidly suppressing mTORC1 by constructing biological networks using the Gene Ontology (GO) of each protein identified in the lysates fraction. Normalized spectral counts were averaged for each of the three biological replicates across all treatments. To find the most highly enriched biological processes, proteins were filtered into unique lists that were loaded into DAVID (45, 46). DAVID uses a modified version of Fisher's Exact Test to produce an “EASE” score that measures the significance of clustering enrichment among the proteins under consideration. Because of the high number of biological processes that resulted from DAVID clustering data, we used the DAVID functional annotation chart in conjunction with the Cytoscape plugin Enrichment Map to visualize gene/protein clusters with the highest overlap (47, 48). This approach allowed us to create biological networks organized into highly enriched functional units (Fig. 1B). Each node in this network is a GO biological process containing a statistically significant cluster of proteins from either rapamycin or control/DMSO treatment (based on DAVID EASE score). The edge connecting the nodes illustrates the relatedness of the biological processes, such that a shorter edge indicates a greater overlap of proteins between processes. GO biological processes that contain a high overlap in common proteins were circled and given a label that generally describes the processes it contains.
To differentiate rapamycin-dependent biological processes in lysates, we overlapped control/DMSO and rapamycin networks and colored unique edges between the two fractions in red (Fig. 1B). This approach revealed a high level of overlap between the GO biological process cluster for the DMSO (gray) and RAPA (blue) networks (Fig. 1B). We further characterized the networks by mean closeness centrality, mean clustering coefficient, and mean neighborhood connectivity (supplemental Table S2) (68, 69). This evaluation also indicated a stark similarity between DMSO and rapamycin networks, suggesting that acute attenuation of mTORC1 activity does not largely alter the global network. However, our analysis unexpectedly revealed that a brief inhibition of mTORC1 significantly affected GO biological processes observed at the synapse—ion homeostasis, metal ion transport, regulation of membrane potential, and regulation of secretion—in addition to the expected changes in translation, as indicated by the red connections (see supplemental Table S3 for unique GO terms between treatments). Furthermore, synaptic vesicle maturation particularly stood out with its high level of unique connections between vesicle trafficking, neuron projection and morphogenesis, and protein transport (Fig. 1B, green arrow, lower right corner). These results suggest that acute alterations in mTORC1 activity greatly impact synaptic function.
PSD Proteome is Labile During Brief Rapamycin Exposure and Contains More mTORC1-Responsive Proteins
Because network analysis of lysates revealed stark changes in synaptic processes after one hour of mTORC1 inhibition, we isolated synaptoneurosomes from cortices of control and rapamycin-treated rats. Through a series of filtration steps and detergent solubilization, we isolated fractions of synaptoneurosomes that were soluble (supernatant, S, containing neuronal processes void of the PSD) and insoluble (pellet, P, PSD) in the detergent, triton X-100 (TX-100) (Fig. 2A, illustration of biochemical isolation) (70, 71). We used this modified approach for enriching PSD to allow us to identify promising proteins that directly interact with resident proteins of PSD (see Experimental Procedures). To verify the purity of the fractionation we assayed for well-characterized resident proteins of each fraction. As indicated by Western blot analysis, the pellet is enriched for PSD-95—a postsynaptic marker—and the supernatant is enriched for tubulin and synaptophysin 1—a presynaptic marker (Fig. 2B) (72–74). Furthermore, phospho-S6 (P-S6)—a downstream marker of mTORC1 activity—was reduced in the PSD, indicating that mTORC1 was successfully inhibited by rapamycin in this fraction (DMSO = 1.00 ± 0.31; RAPA = 0.12 ± 0.05) (Fig. 2C). Next, we subjected soluble and PSD fractions to LC-MS/MS to determine the proteins that were up- or down-regulated during acute reduction of mTORC1 activity. Again, to assess consistency between replicates we measured the average standard errors and spectral count correlations across all proteins (supplemental Fig. S2A; PSD/DMSO = 0.222 ± 0.007, PSD/RAPA = 0.198 ± 0.006; SOL/DMSO = 0.184 ± 0.005, SOL/RAPA = 0.179 ± 0.005; supplemental Fig. S2B; r2 > 0.85 (PSD/DMSO), r2 > 0.88 (PSD/RAPA); r2 > 0.90 (SOL/DMSO), r2 > 0.90 (SOL/RAPA)).
Fig. 2.

Proteins in postsynaptic region rapidly and bidirectionally respond to mTORC1 repression. A, Schematic diagram indicating the steps and reagents used to generate the PSD-enriched (P), and triton X-100-soluble (S) portions of the cortices. To isolate P and S, synaptoneurosomes were solubilized in triton-X 100 (TX-100, 1%). B, By Western blot analysis, top, TX-100-insoluble pellet (P) was enriched in postsynaptic density-95 (PSD-95, postsynaptic marker) while bottom, TX-100-soluble supernatant (S) was enriched for synapsin 1 (SYN1, presynaptic marker) and tubulin. C, In the PSD, rapamycin reduces P-S6 level (DMSO = 1.00 ± 0.31; RAPA = 0.12 ± 0.05; n = 3 animals per condition). Actin was used as loading control because PSD fraction is void of tubulin, as shown in B. Statistics: *, p < 0.05; Student's t test. D, Histogram showing log2 transformed fold-change levels across the PSD (supplemental Table S4–S5). Central gray box represents proteins that changed by 0–10% compared with control conditions. For PSD fraction: n = 401 proteins, nlog2 fold-change > 0 = 210, nlog2 fold-change < 0 = 191. Descriptive statistics: mean ± S.D. = −0.006 ± 0.5; variance = 0.25 CI [0.224, 0.281]; skewness = 0.40; kurtosis = 4.14. CI for variance calculated from X2 statistic. Bartlett's Test shows variances of lysates, PSD, and soluble fold-change distributions are unequal (p < 0.0002). E, Number of proteins in PSD where computing log2 fold-change (RAPA/DMSO) was not possible because the average spectral counts for either rapamycin or DMSO treatments was zero. These proteins are described as “out-of-range.” DMSO column represents 50 proteins whose average spectral counts for the rapamycin treatment condition was zero. RAPA column represents 39 proteins whose average spectral counts for DMSO treatment condition was zero (supplemental Table S6).
To determine how acute mTORC1 repression affects the subcellular distribution of proteins, we examined changes in expression. The average value of each protein that was detected in rapamycin was normalized to the average value of the corresponding protein in DMSO and thus reported as the fold change of RAPA/DMSO. We found that the majority of the proteins (∼73–75%) in PSD changed their expression profiles within one hour after reducing mTORC1 activity as determined by variance (PSD: 0.25 CI[0.224, 0.281]) and fold-changes in protein expression (see supplemental Table S4 for PSD proteins that are insensitive to mTORC1 activity and supplemental Table S5 for PSD proteins whose expression changes). Furthermore, the direction of change as indicated by the histogram is approximately equal between the expected reduction with mTORC1 inhibition (negative fold-change) and the unexpected increase (positive fold-change) in expression (Fig. 2D). More interestingly, we discovered out-of-range proteins that could only be detected in either DMSO or rapamycin (Fig. 2E; supplemental Table S6). In PSD, 50 proteins could no longer be detected, whereas 39 new proteins were identified upon inhibiting mTORC1. The dynamic disappearance and emergence of out-of-range proteins in PSD suggest that mTORC1 not only regulates the expression of proteins but also regulates them in a site-specific fashion.
Brief Rapamycin Exposure Alters Localization and Expression of Proteins Associated with mTORC1-Related Disorders
Dysregulated mTORC1 signaling is implicated in many neurological disorders such as epilepsy, Alzheimer's disease (AD), and autism spectrum disorder (ASD) (11, 12). We thus examined our data for disease-related proteins whose expressions were up-regulated in a region-specific fashion during a brief reduction in mTORC1 activity. Like Kv1.1, these newly identified proteins that are up-regulated with mTORC1 inhibition could potentially serve as novel therapeutic targets (37). Using available databases, we compiled a list of proteins associated with epilepsy (from CarpeDB), Alzheimer's disease (AlzGene and KEGG Alzheimer's disease pathway (hsa05010)) and ASD (SFARIgene) (supplemental Table S7A). We then determined which of these candidate genes appeared in our MS/MS data sets (supplemental Table S7B). This list was then filtered to remove all mitochondrial genes. Proteins that were detected in two out of three samples per treatment or absent in all samples were considered for fold-expression and spatial distribution analyses as indicated on the heat maps (Fig. 3). We detected 38 epilepsy, 15 AD, and 14 ASD-associated proteins (Fig. 3; supplemental Table S8). A brief one hour reduction in mTORC1 signaling was sufficient to alter the expression of select proteins bidirectionally with ∼23% (red) and ∼17% (yellow) increasing their expression when mTORC1 is active and inhibited, respectively (beyond ± 0.5 log2 fold change; supplemental Table S8). As expected, Kv1.1 protein (Kcna1) was only detected in the soluble fraction when mTORC1 was repressed, confirming our previous findings (31, 34, 35). Notably, ∼11% of the disease-related proteins showed changes where mTORC1 activity had a different impact depending on the subcellular fraction. Our analyses suggest that proteins associated with aberrant mTORC1 disorders are differentially regulated at the subcellular level by mTORC1 activity.
Fig. 3.
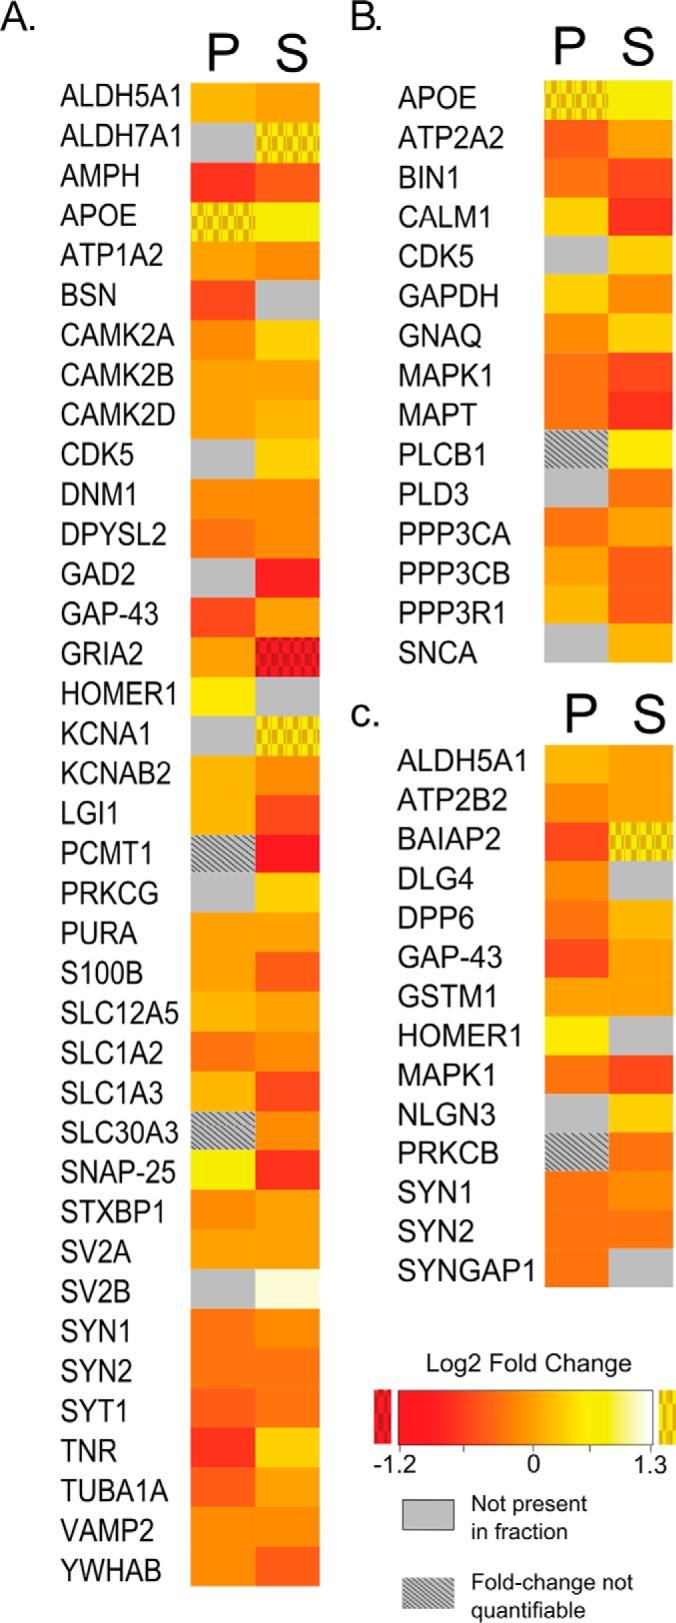
mTORC1 inhibition swiftly alters the expression of epilepsy, Alzheimer's disease (AD), and autism spectrum disorder (ASD) proteomes in a region-specific fashion. Epilepsy genes were obtained from the CarpeDB epilepsy gene database. AD genes were obtained from the AlzGene (top 10 list) and the KEGG Pathway Database for AD (KEGG hsa05010). ASD genes were obtained from the Simons Foundation Autism Research Initiative (supplemental Table S7–S8). Using these databases heatmaps were generated to represent protein expression in our PSD (P) and soluble (S) fractions following mTORC1 inhibition. For heatmaps, textured icons indicate out-of-range proteins with fold-changes of 0/Control (red textured) or RAPA/0 (yellow textured). Gray indicates that the protein was not detected in the fraction. Textured gray indicates that the fold-change was not quantifiable because only one of the three biological replicates for that treatment condition produced a nonzero spectral count value. A, Heatmap showing the log2 fold-change for the epilepsy proteins. B, Heatmap showing the log2 fold-change for the AD proteins. C, Heatmap showing the log2 fold-change for the ASD proteins.
Rapid mTORC1 Inhibition Bidirectionally Regulates Protein Syntheses of GAP-43 and SNAP-25
A few proteins appeared to be up-regulated in the PSD at one hour after mTORC1 inhibition (Fig. 3). We focused our attention on SNAP-25 as reduction of SNAP-25 has been observed in age-related dementia including AD (75–77). This reduction has been largely attributed to a loss of synapses or dysfunction of presynaptic vesicular release (75–78). Unexpectedly, we found SNAP-25 to be up-regulated in the PSD with rapamycin treatment, arguing that SNAP-25 may be important postsynaptically as well. To determine if the increase in SNAP-25 in the PSD with mTORC1 inhibition was because of new protein synthesis we used bio-orthogonal noncanonical amino acid tagging (BONCAT) and proximity ligation assay (PLA) in tandem, after repressing mTORC1 for one hour in cultured hippocampal neurons (Fig. 4) (58, 59). BONCAT identifies newly synthesized proteins that incorporate an azidohomoalanine (AHA)-tagged noncanonical amino acid. Using alkyne-azide click chemistry, proteins that contain AHA are labeled with biotin. In combination with PLA, which emits a fluorescent signal only when two antibodies (anti-biotin and anti-SNAP-25) are within 30–40 nm of each other, we are able to identify new SNAP-25 protein specifically. Rapamycin, as predicted, increased new SNAP-25 in dendrites (2.18 ± 0.34 of control; Fig. 4A–4C). We selected GAP-43 protein as a control that is down-regulated in PSD with mTORC1 inhibition (79). Consistent with our MS/MS analyses showing reduced GAP-43 in PSD, we previously showed that Gap-43 mRNA decays with mTORC1 inhibition (35). Because our MS/MS data showed that GAP-43 is reduced in the PSD, we suspected that mTORC1 inhibition attenuates GAP-43 protein synthesis. Indeed, there was a significant reduction in new GAP-43 in rapamycin-treated neurons relative to control neurons (0.39 ± 0.08 of control; Fig. 4D–4F), supporting our previous report that mTORC1 inhibition reduces Gap-43 mRNA (35). We noticed that the signal for both SNAP-25 and GAP-43 within or near dendrites was punctate—perhaps suggesting synaptic localization. We attempted to co-label pre- and postsynaptic sides of the synapse in combination with BONCAT-PLA. However, the antibodies for the presynaptic protein synapsin and the postsynaptic protein PSD-95 did not work after the BONCAT-PLA procedure. Nevertheless, these data do suggest that inhibition of mTORC1 for one hour promotes new synthesis of SNAP-25 protein while reducing synthesis of new GAP-43.
Fig. 4.

mTORC1 suppression oppositely alters the appearance of new SNAP-25 and GAP-43. A, Representative merged images of newly synthesized SNAP-25 protein (green) as determined by BONCAT-PLA when mTORC1 is active (left) or repressed (right) in or near MAP2-positive dendrites (red) of hippocampal cultured neurons. Scale bar = 20 μm. B, Blown up dendrite outlined in A by a dotted box. Control- (left) and rapamycin-treated (right) dendrite showing new SNAP-25 (top), MAP2 (middle), and merged image (bottom). Arrows indicate new SNAP-25 protein. Scale bar = 5 μm. C, Quantification of new SNAP-25 localized within or near the dendrite. Note, SNAP-25 increases with rapamycin. (DMSO = 1.00 ± 0.20, n = 33 dendrites; RAPA = 2.18 ± 0.34, n = 37 dendrites). D, Representative merged images of newly synthesized GAP-43 protein (green) and MAP2-positive dendrites (red) and cell bodies treated with carrier (left) or rapamycin (right). Scale bar = 20 μm. E, Blown up dendrite outlined in D by a dotted box. Control- (left) and rapamycin-treated (right) dendrite showing new GAP-43 (top), MAP2 (middle), and merged image (bottom). Arrows indicate new GAP-43 protein. Scale bar 5 = μm. F, Quantification of new GAP-43 protein in or near dendrites. Note, GAP-43 protein synthesis is reduced with rapamycin. (DMSO = 1.00 ± 0.12, n = 38 dendrites; RAPA = 0.39 ± 0.08, n = 30 dendrites). MAP2 signal is saturated for visualization purposes to clearly see all dendritic branches associated with new SNAP-25 or GAP-43. Statistics: **, p < 0.01; ***, p < 0.001; Student's t test.
Acute mTORC1 Repression Bidirectionally Regulates the Expression of SNAP-25 and GAP-43 in the PSD
To determine if changes in expression of SNAP-25 and GAP-43 with mTORC1 inhibition are synaptic, we treated cultured hippocampal neurons with carrier (control) or rapamycin (200 nm) for 1 hour. We subsequently immunostained for GAP-43 or SNAP-25, while costaining for MAP2, PSD-95, and synapsin to visualize SNAP-25 and GAP-43 at the synapse. We then asked if the amount of SNAP-25 or GAP-43 that colocalizes with the pre- or postsynaptic terminals changes with mTORC1 activity. To do this we determined the amount of colocalized protein by plotting the fluorescence intensity of GAP-43 or SNAP-25 with the intensity of PSD-95 or synapsin and calculated the Pearson's correlation coefficient (PCC) on a pixel-by-pixel basis. Because both SNAP-25 and GAP-43 have been best characterized presynaptically, we used the PCC between SNAP-25 or GAP-43 and synapsin to normalize between conditions (80, 81). We found that rapamycin-treated neurons expressed more SNAP-25 that colocalized with the postsynaptic protein PSD-95, shifting its normalized PCC from 1.6 ± 0.12 to 2.1 ± 0.07 (Fig. 5A–5D). In contrast, rapamycin reduced the normalized PCC between GAP-43 and PSD-95 from 1.36 ± 0.08 to 1.0 ± 0.09 (Fig. 5E–5H). Interestingly, rapamycin had no significant effect on the normalized PCC for either SNAP-25 or GAP-43 with the presynaptic protein synapsin. Consistent with the localization of Gap-43 and Snap-25 mRNAs in the dendrites, our findings show that GAP-43 and SNAP-25 proteins are present postsynaptically (82, 83). Moreover, we show that acute mTORC1 inhibition oppositely regulates the colocalization of SNAP-25 and GAP-43 with the postsynaptic marker PSD-95.
Fig. 5.

Rapid mTORC1 repression bidirectionally modifies subcellular expression of SNAP-25 and GAP-43. A, Representative images of neurons showing differential expression of SNAP-25 (red) colocalizing with the postsynaptic density protein PSD-95 (green) and the dendritic protein MAP2 (blue) when mTORC1 is active (DMSO, left panel) or repressed (Rapamycin, right panel). Scale bar = 20 μm. See also supplemental Fig. S3. B, Blown up dendrites, indicated by dotted box in A, of SNAP-25 (top), PSD-95 (middle) and merged image showing colocalization (bottom). White arrows indicate SNAP-25 that colocalize with PSD-95. Blue arrows indicate SNAP-25 that colocalize with synapsin. C, Same dendrite as in B, representative staining of the presynaptic protein synapsin (top) colocalized with SNAP-25 (bottom, merged). Scale bar = 5 μm. D, Normalized PCC averaged over many dendrites for SNAP-25 and the postsynaptic marker PSD-95 or the presynaptic marker synapsin and SNAP-25. All raw PCC values were normalized to the average PCC between SNAP-25 and synapsin in control condition (DMSO, D). Dotted line indicates the average normalized PCC between SNAP-25 and synapsin in control condition. Note, there was an increase in the PCC of SNAP-25 with PSD-95 in rapamycin treatment (DMSO, D, = 1.63 ± 0.12, n = 34 dendrites; Rapamycin, R, = 2.12 ± 0.07, n = 24 dendrites). There was no significant difference in PCC between treatments for SNAP-25 and synapsin (DMSO = 1.00 ± 0.13, n = 34 dendrites; Rapamycin = 1.16 ± 0.11, n = 24 dendrites). E, Representative images of neurons showing differential expression of GAP-43 (red), PSD-95 (green), and MAP2 (blue) when mTORC1 is active (DMSO, left panel) or repressed (Rapamycin, right panel). Scale bar 20 μm. F, Blown up dendrites, indicated by dotted box in E, of GAP-43 (top), PSD-95 (middle) and merged image showing colocalization (bottom). White arrows indicate GAP-43 that colocalize with PSD-95. Blue arrows indicate GAP-43 that colocalize with synapsin. See also supplemental Fig. S3. G, Same dendrite as in F, representative staining of synapsin (top) colocalized with GAP-43 (bottom, merged). Scale bar = 5 μm. H, Normalized PCC averaged over many dendrites for GAP-43 and the postsynaptic marker PSD-95 or the presynaptic marker synapsin and GAP-43. All raw PCC values were normalized to the average PCC between GAP-43 and synapsin in control condition (DMSO, D). Dotted line indicates the average normalized PCC between GAP-43 and synapsin in control condition. Note, there was a decrease in the normalized PCC of GAP-43 with PSD-95 in rapamycin treatment (DMSO, D, = 1.36 ± 0.08, n = 36 dendrites; Rapamycin, R, = 1.00 ± 0.09, n = 36 dendrites). There was no significant difference in PCC between treatments for GAP-43 and synapsin (DMSO = 1.00 ± 0.09, n = 36 dendrites; Rapamycin = 0.92 ± 0.08, n = 36 dendrites). Statistics: *, significantly different by one-way ANOVA, Tukey's multiple comparison; #, significantly different by single t test from PCC of SNAP-25 or GAP-43 with synapsin in DMSO. Chicken anti-MAP2 was imaged with 405 nm laser (see “Experimental Procedures”).
Protein–Protein Interaction Network Analysis Exposes Snca and Park7 as Novel Protein Hubs Shared by Epilepsy, AD, and ASD
Seizures are commonly observed in epilepsy, AD, and ASD. We, therefore, considered the possibility that the proteins linked to these disorders (Fig. 3) interact with each other in some way to elicit a shared disease phenotype. Using a Venn diagram to determine which of the previously identified candidate proteins are common in epilepsy, AD and ASD, we found that few if any were shared by the three disorders (Fig. 6A; two genes from published data (left) and zero genes from our data (right)). We next sought to determine potential protein–protein interactions (PPI) using epilepsy-, AD-, and ASD-related proteins from our MS/MS data. To do this, we first created a PPI network for each disease by seeding each network with its relevant disease-related proteins (48 for epilepsy, 44 for AD, and 19 in ASD). We then constructed each network by adding neighbors to the seed proteins up to a distance of two nodes to exact intimate protein interactions (Fig. 6B, left, right, bottom). Using the degree statistic, we looked for the top nodes that formed the largest number of connections to other nodes (supplemental Table S9A1–S9A3), thus allowing us to identify intermediate molecules (herein referred to as hubs) that may link proteins implicated in epilepsy, AD, and ASD. To identify common hubs for all three disorders, we created a network using all 102 proteins identified in these diseases (Fig. 6B, center). The combined network identified several candidate common hubs (supplemental Table S9A4, top 10 hubs), with mitogen-activated protein kinase 3 (MAPK3), small ubiquitin-like modifier 3 (SUMO3), α-synuclein (SNCA), and Parkinson protein 7 (PARK7/DJ-1) showing the highest degree statistics in epilepsy, AD, and ASD (Fig. 6B, center). To verify that these common hubs were specific to epilepsy, AD, and ASD, we chose 102 random neuronal proteins from the R. norvegicus protein database (NCBI) and created a PPI network under the same parameters. MAPK3, SUMO3, SNCA, and PARK7 hubs were not identified as top candidates by the random PPI network, suggesting that the epilepsy-, AD-, and ASD-associated proteins that we have identified from our MS/MS data are uniquely interconnected.
Fig. 6.

Protein–protein interaction (PPI) network analysis determines Parkinson protein 7 (PARK7) as a candidate molecule that may give rise to pathologies common in epilepsy, AD and ASD. A, Venn diagrams depicting candidate genes common between epilepsy, Alzheimer's disease (AD), and autism spectrum disorder (ASD). (Left, Databases) Venn diagram for genes obtained from disease databases (supplemental Table S7A). The genes in the intersection include amyloid precursor protein (APP) and glutamate receptor ionotropic, N-methly-d-aspartate 2A (Grin2A/GluN2). (Right, Our data) Subset of left Venn diagram showing only those genes present in our data set (Supplemental Table S9B–S9D). B, Protein–protein interaction networks for epilepsy (left), AD (right), and ASD (bottom) based on candidate genes. The combined PPI network (center) was seeded with epilepsy, AD, and ASD candidate proteins found in our data set (supplemental Table S8). Network seed genes are represented by nodes colored in red (epilepsy), magenta (AD), blue (ASD), or orange (combined PPI network). Light blue nodes indicate intermediate PPI interactions between seed genes. Green nodes indicate proteins connected to hub proteins of high degree and/or betweenness centrality (highly trafficked or connected nodes), referred to in the text as “terminal hub proteins.” Proteins around central PPI network indicate proteins connected to the terminal hub proteins including PARK7.
Because these common hubs interact with a high number of proteins, altering the protein abundance of a hub could strongly affect the expression of neighboring proteins, as indicated by their exclusive connections to a cluster of proteins (Fig. 6B, arrow from each hub pointing to green clusters or terminal hub proteins; supplemental Table S9). Although two out of the top four hubs for the combined PPI network were identified in our MS/MS data set: PARK7 and SNCA (Fig. 6B; supplemental Table S10), none of them are currently identified as common to the epilepsy, AD, and ASD databases (supplemental Table S7A). Moreover, although SNCA has been identified in AD (Fig. 3B), PARK7 is absent in all three disorders. Our collective findings highlight the advantage of constructing PPI networks to identify common molecules that may underlie shared pathologic phenotypes of mTORC1-related disorders.
PARK7 Levels at the Synapse Require Active mTORC1
Because we identified PARK7 as a novel hub common to epilepsy, AD, and ASD (Fig. 6B), we performed GO functional annotation to gain insight into how changes in PARK7 expression may alter the expression of terminal hub proteins (Fig. 7A; supplemental Table S10C). Not surprisingly, PARK7 is linked to translation-related processes, suggesting a putative central role in diseases with elevated mTORC1 activity and aberrant translation, like epilepsy, AD, and ASD (Fig. 7A). Of note, our MS/MS data indicate that mTORC1 activity favors an overall increase in PARK7 throughout the dendrite with the biggest impact at the PSD (Fig. 7B, heat map). After performing Western blot analysis on cortical PSD fractions isolated from rats that were intraperitoneal injected with carrier or rapamycin for one hour (Fig. 7C), we found that PARK7 was significantly reduced in the PSD by ∼75% when mTORC1 was inhibited (Rapamycin = 0.24 ± 0.10, Control = 1.00 ± 0.06, p < 0.002), confirming our MS/MS data.
Fig. 7.

mTORC1 activity regulates PARK7 protein expression in PSD and protein synthesis in dendrites. A, DAVID clustering results for PARK7 terminal hub proteins. PARK7 associates with proteins that are involved in translation, ribonucleoprotein (RNP) complex biogenesis, and ribosome assembly. The abscissa accounts the number of proteins that have been shown to associate with PARK7 for each of the GO biological process (ordinate) (supplemental Table S10). B, Heatmap for PARK7 in PSD (P) and soluble (S) fractions. Heatmap is shown as log2 fold-change. In PSD, PARK7 is an out-of-range protein with fold-change of 0/Control (red textured). C, mTORC1 inhibition for 1h by intraperitoneal injection of rapamycin reduces PARK7 levels in PSD-enriched fraction of rat cortices, similar to MS/MS data in B. Top: representative Western blots. Bottom: densitometric analysis of Western blots. (DMSO = 1.00 ± 0.06; Rapamycin, RAPA, = 0.24 ± 0.10; n = 3 animals per condition; **, p < 0.002). D, Representative images of cultured neurons treated with carrier (DMSO, left) and rapamycin (200 nm, right) showing differential expression of PARK7 (red), PSD-95 (green), and MAP2 (blue). Scale bar 20 μm. E, Blown up dendrites indicated by dotted box in D, of PARK7 (top), PSD-95 (middle) and merged image showing colocalization (bottom). White arrows indicate PARK7 that colocalize with the postsynaptic protein PSD-95. Blue arrows indicate PARK7 that colocalize with the presynaptic protein synapsin. F, Same dendrite as in D, representative staining of synapsin (top) colocalized with PARK7 (bottom, merged). Scale bar = 5 μm. G, Normalized PCC averaged over many dendrites for PARK7 and PSD-95 or PARK7 and synapsin. All raw PCC values were normalized to the average PCC between PARK7 and synapsin in control condition (DMSO, D). Dotted line indicates the average normalized PCC of PARK7 and synapsin in DMSO. Note, PCC of PARK7 with PSD-95 (DMSO, D, = 1.47 ± 0.08, n = 24 dendrites; Rapamycin, R, = 1.17 ± 0.05, n = 24 dendrites) and synapsin (DMSO = 1.00 ± 0.08, n = 24 dendrites; Rapamycin = 0.67 ± 0.06, n = 24 dendrites) decreased at 1 hour after mTORC1 inhibition. Statistics: * and **, significantly different by one-way ANOVA, Tukey's multiple comparison; #, significantly different by single t test from PCC of PARK7 with synapsin in DMSO. H, Representative images of newly synthesized PARK7 protein, as determined by BONCAT-PLA, when mTORC1 is active (left, top) or repressed (right, top) in or near MAP2-positive dendrites (middle panels). Arrows indicate new PARK7 protein. Overlay images of new PARK7 proteins and MAP2 (bottom panels). Scale = 5 μm. See supplemental Fig. S7. I, Rapamycin reduces new PARK7 (DMSO = 1.00 ± 0.11, n = 26 dendrites; RAPA = 0.76 ± 0.05, n = 36 dendrites). Statistics: *, p < 0.05; Student's t test. Chicken anti-MAP2 was imaged with 405 nm laser (see “Experimental Procedures”).
Next, we measured the colocalization of PARK7 with the postsynaptic protein PSD-95 and the presynaptic protein synapsin. Remarkably, rapamycin reduced the normalized PCC of PARK7 and PSD-95 as well as PARK7 and synapsin from ∼1.47 to 1.17 and ∼1.00 to 0.67, respectively (Fig. 7D–7G). Thus, our MS/MS, Western blot analysis, and colocalization findings show that mTORC1 inhibition reduces PARK7 at the synapse.
If active mTORC1 increases total PARK7 protein through new translation, then rapamycin should reduce synthesis of new PARK7 protein. Surprisingly, using BONCAT-PLA, we found that acute inhibition of mTORC1 reduced synthesis of new PARK7 proteins in dendrites only by ∼25% (Fig. 7H–7I; RAPA = 0.76 ± 0.05, Control = 1.00 ± 0.11). Although these results show that mTORC1 positively regulates the translation of Park7 mRNA, the dramatic loss of PARK7 in the PSD also suggest that inhibiting mTORC1 may indirectly destabilize PARK7 protein.
PARK7 Expression is Elevated in Dendrites of Neurons in a Mouse Model of Tuberous Sclerosis Complex
To test the power of our PPI network to identify new proteins that may be aberrantly expressed in neurological disorders, we used a mouse model of tuberous sclerosis complex (TSC), a disease that exhibits epilepsy and autistic behaviors. In the Tsc1 conditional knockout (cKO) mouse, expression of Cre recombinase virus elevates mTORC1 activity by knocking down the expression of TSC1 protein, an upstream repressor of mTOR. We prepared dissociated hippocampal neurons from Tsc1 cKO mice and infected them at 7–9 DIV with Cre (Tsc1 KO) or GFP (control/WT) for 9–14 days. Using an immunohistochemical approach, we then measured dendritic PARK7 expression at 21 DIV. We found that PARK7 protein in dendrites was markedly increased in neurons infected with Cre (WT = 1.00 ± 0.22, KO = 1.79 ± 0.11; Fig. 8A–8B), suggesting that mTORC1 activation enhances dendritic PARK7 expression.
Fig. 8.

PARK7 protein expression is elevated in dendrites and colocalizes with the PSD in Tsc1 knockout neurons. A, Representative images of basal PARK7 protein (top panel) in MAP2-positive dendrites (middle) of wildtype (WT) and Tsc1 conditional knockout (cKO) neurons expressing CRE (KO). Arrows indicate PARK7 protein. Overlay images of PARK7 protein and dendrites (bottom panel). Scale bar = 5 μm. B, Quantification of PARK7 protein in or near dendrites. Knockout of Tsc1 increases basal PARK7 protein (WT = 1.00 ± 0.11, n = 9 dendrites; KO = 1.79 ± 0.22, n = 18 dendrites). Statistics: *, p < 0.05; Student's t test. C, Tsc1 cKO mice expressing CRE (KO) or GFP (WT) in the CA1 region of the hippocampus. Phospho-ribosomal S6 protein (P-S6, left panel) staining as a downstream indicator of mTORC1 activity. Slices were costained with PARK7 (right). No changes in MAP2 or GFP expression were observed in WT and KO neurons (See supplemental Fig. S5). Enlarged cell bodies, characteristic of overactive mTORC1 signaling, are observed in KO. PARK7 is pseudocolored to easily visualize the difference in PARK7 immunofluorescence between WT and KO neurons. Scale bar = 20 μm. (See supplemental Fig. S6 for low magnification images) D. Colocalization analysis of PARK7 and the postsynaptic density protein PSD-95 in the dendrites located in the stratum radiatum of CA1 hippocampal slices from WT and Tsc1 KO. MAP2 staining (left panel) of hippocampal slices show the representative dendrites (outlined by orange dashed boxes). * denotes cell body in WT and KO to show that blown up images are approximately at an equal distance from cell bodies. Scale bar = 5 μm. Dendrites indicated by the orange dashed boxes (left panel) were blown up (right panels, outlined by white dashed lines) to visualize the colocalization between PARK7 and PSD-95. Representative dendrites show that PARK7 expression (average signal intensity indicated below for relative comparison) is higher in the KO than the WT. Increased colocalized pixels between PARK7 with PSD-95 in the KO are noted by the higher PCC reported below the merged images. Scale bar = 2.5 μm. Pseudocolored images of PARK7 and PSD-95 show increased expression of PARK7 in KO dendrites. E, Quantification of basal PARK7 in the dendrites of WT and KO stratum radiatum as shown in D. Note, ∼twofold increase in KO (WT = 1.00 ± 0.08, n = 36 dendrites; KO = 1.97 ± 0.06, n = 36 dendrites). For each dendrite, PARK7 immunofluorescence (IF) was normalized by its respective MAP2 IF. F, Quantification of average PCC over many dendrites between PARK7 and PSD-95 (WT = 0.10 ± 0.01, n = 36 dendrites; KO = 0.30 ± 0.03, n = 36 dendrites). PCC increases in KO, consistent with overactive mTORC1 signaling. Statistics: Student's t test; ***, p < 0.001. Chicken anti-MAP2 was imaged with 405 nm laser (see “Experimental Procedures”).
To further extend these findings we stereotaxically injected a recombinant adeno-associated virus (rAAV) for Cre (Tsc1 KO) or EGFP (control) into the hippocampus of adult Tsc1 cKO mice. Immunostaining of hippocampi from these mice showed an increase in the downstream marker of mTORC1 activity, phospho-S6 ribosomal protein, along with the typical increase in cell body size relative to control (Fig. 8C and supplemental Fig. S6) (84). Of note, the increase in basal levels of dendritic PARK7 in Tsc1 KO mice agreed with our results in cultured neurons (WT = 1.00 ± 0.08, KO = 1.97 ± 0.06; Fig. 8C, 8D, and 8E). Moreover, these mice showed more PARK7 colocalized with PSD-95 than control mice (WT = 0.10 ± 0.01, n = 36 dendrites; KO = 0.30 ± 0.03, n = 36 dendrites; Fig. 8D and 8F). As predicted by our MS/MS and bioinformatics analyses, our findings show that in a disease model where mTORC1 is overactive PARK7 expression increases.
DISCUSSION
Combined Neuroproteomics Approach Sets a Framework for New Discoveries in mTORC1-Dependent Synapse Remodeling
To generate a comprehensive view of acute mTORC1 function, we have employed tandem mass spectrometry in concert with bioinformatics analyses. Our multipronged approach has shown that mTORC1 widely acts on protein expression by inducing differences in regional expression of proteins and the appearance and disappearance of proteins within a rapid timescale. One of the most striking findings is that ∼75% of the proteins found within the PSD fraction change in abundance, suggesting that mTORC1's immediate and most pronounced function is to remodel the synapse.
mTORC1 Signaling Dynamically and Bidirectionally Regulates Protein Expression
Numerous studies have established the positive function of mTORC1 activation on protein expression, but very few have examined its opposite effect (33–35, 85). Having previously shown in cultures that repression of mTORC1 by rapamycin increases Kv1.1 translation locally in dendrites, we present here that reduction of mTORC1 activity in vivo up-regulates protein expression in a region-specific manner (34). Specifically, we observe that ∼30% of proteins in the PSD are elevated upon mTORC1 repression (Fig. 2D). One of these proteins is SNAP-25, which markedly increased in the PSD at 1 hour after inhibiting mTORC1. Although SNAP-25, a part of the SNARE complex, has been best characterized for its presynaptic role in neurotransmitter release, reduced levels are associated with postsynaptic dysfunction. Notably, these include phenotypes that are associated with ASD such as reduced spine density, amplitude of miniature excitatory postsynaptic potentials (mEPSP), and activity induced forms of potentiation (84, 86–89). Moreover, SNAP-25 has recently been shown to facilitate the removal of kainate receptors (KARs), which are implicated in epileptogenesis, from the membrane surface (83, 90–95). Our results may help explain why in part rapamycin reduces seizure frequency in mTOR-related diseases, possibly through the increased expression of SNAP-25 in the PSD and the removal of KARs.
PARK7 is a Putative, Dysregulated Translational Hub in Overactive mTOR-Related Diseases
Individuals with neurological diseases that have dysregulated mTOR activity often suffer spontaneous seizures (3, 6–17). We, therefore, looked for common proteins that are associated with epilepsy, AD, and ASD. Surprisingly, we did not detect a single protein shared by available databases for the three disorders that was also in our data set. By creating a PPI network of our disorder-associated data sets, however, we identified PARK7 as a putative protein shared by epilepsy, AD, and ASD. PARK7 is reported to be involved in transcriptional regulation and complexes with processing bodies (P-bodies) suggesting that it may also play a central role in translational regulation as suggested by our PPI network (96, 97). We hypothesize that the PARK7 translational module is aberrantly regulated in diseases with overactive mTORC1. Supporting our hypothesis, we have found increased protein expression in the dendrites of Tsc1 KO neurons, in which mTOR is overactive. Thus, exploring how PARK7 affects the expression of other proteins may represent a previously unexplored avenue for reversing dysregulated protein synthesis in ASD and other mTORC1-related diseases.
Our work, overall, provides evidence that changes in mTORC1 activity induce a rapid and dramatic remodeling of the synaptic proteome by increasing and decreasing syntheses of specific proteins and by altering the local expression of synaptic proteins. However, the precise subcellular targeting mechanisms remain to be determined. We also show that establishing PPI network hubs—common proteins and their associated molecules—or interactomes sets the stage for identifying proteins, like PARK7, that may account for phenotypic similarities among mTORC1-related diseases. Identification of these common hub proteins can open new avenues to mitigate debilitating phenotypes shared by many neurological disorders.
Supplementary Material
Acknowledgments
We thank Drs. Maria Person, Hans Hofmann, Viswanadham Sridhara, and Luisa Cacheaux for their valuable advice and technical assistance. We thank Drs. Cacheaux and Heaney for their critical reading of the manuscript.
Footnotes
Author contributions: FN and KRG designed research. FN and SN conducted experiments and analyzed data. SN performed bioinformatics analyses. ES and YM conducted mass spectrometry analyses. GS facilitated mass spectrometry experiments and provided technical advice. GAD and BVZ provided the virus and performed stereotaxic injections. FN, SN, and KRG wrote the manuscript.
* This work was supported by the National Science Foundation IOS 1026527 and IOS 1355158 (KRG), Postdoctoral Research Fellowship in Biology DBI-1306528 (FN); Department of Defense, United States Army Medical Research and Materiel Command USAMRMC Award W81XWH-14–1-0061 (KRG), NIAAA pilot grant from the Integrative Neuroscience Initiative on Alcoholism (KRG).
 This article contains supplemental Figs. S1 to S6 and Tables S1 to S10.
1 The abbreviations used are:
- mTORC1
- mechanistic/mammalian target of rapamycin complex 1
- AD
- Alzheimer's disease
- AHA
- azidohomoalanine
- APP
- amyloid precursor protein
- ASD
- autism spectrum disorder
- BONCAT
- bioorthogonal noncanonical amino acid tagging
- CI
- confidence interval
- cKO
- conditional knockout
- Cre
- Cre-recombinase
- DAVID
- database for annotation, visualization and integrated discovery
- DIV
- day in vitro
- Dlg4
- discs large homolog 4
- DMSO
- dimethyl sulfoxide
- EASE
- expression analysis systematic explorer
- FDA
- Food and Drug Administration
- GAP-43
- growth-associated protein-43
- GO
- gene ontology
- GRIN
- glutamate receptor, ionotropic NMDA subtype
- ICC
- immunocytochemistry
- GluN
- glutamate receptor, NMDA subtype
- KAR
- kainic acid receptor
- Kcna1
- potassium voltage-gated channel subfamily A member 1 gene
- KEGG
- Kyoto Encyclopedia of Genes and Genome
- KO
- knockout
- Kv1.1
- voltage-gated potassium channel subfamily A member 1 type 1 protein
- L
- lysates
- LTP
- long-term potentiation
- LTD
- long-term depression
- Mapk3
- mitogen-activated protein kinase 3
- mGlu
- metabotropic glutamate receptor
- mRNA
- messenger ribonucleic acid
- mTOR
- mechanistic/mammalian target of rapamycin
- NCBI
- National Center for Biotechnology Information
- NMDA
- N-methyl-D-aspartate
- P
- postsynaptic density/pellet
- P-bodies
- processing bodies
- Park7/DJ-1
- Parkinson protein 7
- PLA
- proximity ligation assay
- PPI
- protein–protein interaction
- PSD
- postsynaptic density
- PSD-95
- PSD 95kDa protein
- Rapa
- rapamycin
- S/SOL
- soluble/supernatant
- SEM
- standard error of the mean
- SFARI
- Simons Foundation Autism Research Initiative
- SNAP-25
- synaptosomal-associated 25 kDa
- SNCA
- α-synuclein
- SUMO3
- small ubiquitin-like modifier 3
- SYN1
- synapsin 1
- TSC
- tuberous sclerosis complex
- TX-100
- triton X-100
- UT
- University of Texas
- WT
- wildtype.
REFERENCES
- 1.Kim D. H., Sarbassov D. D., Ali S. M., King J. E., Latek R. R., Erdjument-Bromage H., Tempst P., and Sabatini D. M. (2002) mTOR interacts with raptor to form a nutrient-sensitive complex that signals to the cell growth machinery. Cell 110, 163–175 [DOI] [PubMed] [Google Scholar]
- 2.Tang S. J., Reis G., Kang H., Gingras A. C., Sonenberg N., and Schuman E. M. (2002) A rapamycin-sensitive signaling pathway contributes to long-term synaptic plasticity in the hippocampus. Proc. Natl. Acad. Sci. U.S.A. 99, 467–472 [DOI] [PMC free article] [PubMed] [Google Scholar]
- 3.Hou L. and Klann E. (2004) Activation of the phosphoinositide 3-kinase-Akt-mammalian target of rapamycin signaling pathway is required for metabotropic glutamate receptor-dependent long-term depression. J. Neurosci. 24, 6352–6361 [DOI] [PMC free article] [PubMed] [Google Scholar]
- 4.Hay N. and Sonenberg N. (2004) Upstream and downstream of mTOR. Genes Dev. 18, 1926–1945 [DOI] [PubMed] [Google Scholar]
- 5.Bove J., Martinez-Vicente M., and Vila M. (2011) Fighting neurodegeneration with rapamycin: mechanistic insights. Nat. Rev. Neurosci. 12, 437–452 [DOI] [PubMed] [Google Scholar]
- 6.Kelleher R. J. 3rd, Govindarajan A., Jung H. Y., Kang H., and Tonegawa S. (2004) Translational control by MAPK signaling in long-term synaptic plasticity and memory. Cell 116, 467–479 [DOI] [PubMed] [Google Scholar]
- 7.Takei N., Inamura N., Kawamura M., Namba H., Hara K., Yonezawa K., and Nawa H. (2004) Brain-derived neurotrophic factor induces mammalian target of rapamycin-dependent local activation of translation machinery and protein synthesis in neuronal dendrites. J. Neurosci. 24, 9760–9769 [DOI] [PMC free article] [PubMed] [Google Scholar]
- 8.Tsokas P., Grace E. A., Chan P., Ma T., Sealfon S. C., Iyengar R., Landau E. M., and Blitzer R. D. (2005) Local protein synthesis mediates a rapid increase in dendritic elongation factor 1A after induction of late long-term potentiation. J. Neurosci. 25, 5833–5843 [DOI] [PMC free article] [PubMed] [Google Scholar]
- 9.Gong R., Park C. S., Abbassi N. R., and Tang S. J. (2006) Roles of glutamate receptors and the mammalian target of rapamycin (mTOR) signaling pathway in activity-dependent dendritic protein synthesis in hippocampal neurons. J. Biol. Chem. 281, 18802–18815 [DOI] [PubMed] [Google Scholar]
- 10.Antion M. D., Hou L., Wong H., Hoeffer C. A., and Klann E. (2008) mGluR-dependent long-term depression is associated with increased phosphorylation of S6 and synthesis of elongation factor 1A but remains expressed in S6K-deficient mice. Mol. Cell. Biol. 28, 2996–3007 [DOI] [PMC free article] [PubMed] [Google Scholar]
- 11.Pei J. J. and Hugon J. (2008) mTOR-dependent signaling in Alzheimer's disease. J. Cell. Mol. Med. 12, 2525–2532 [DOI] [PMC free article] [PubMed] [Google Scholar]
- 12.Swiech L., Perycz M., Malik A., and Jaworski J. (2008) Role of mTOR in physiology and pathology of the nervous system. Biochim. Biophys. Acta 1784, 116–132 [DOI] [PubMed] [Google Scholar]
- 13.Sharma A., Hoeffer C. A., Takayasu Y., Miyawaki T., McBride S. M., Klann E., and Zukin R. S. (2010) Dysregulation of mTOR signaling in fragile X syndrome. J. Neurosci. 30, 694–702 [DOI] [PMC free article] [PubMed] [Google Scholar]
- 14.Hoeffer C. A. and Klann E. (2010) mTOR signaling: at the crossroads of plasticity, memory and disease. Trends Neurosci. 33, 67–75 [DOI] [PMC free article] [PubMed] [Google Scholar]
- 15.Ricciardi S., Boggio E. M., Grosso S., Lonetti G., Forlani G., Stefanelli G., Calcagno E., Morello N., Landsberger N., Biffo S., Pizzorusso T., Giustetto M., and Broccoli V. (2011) Reduced AKT/mTOR signaling and protein synthesis dysregulation in a Rett syndrome animal model. Hum. Mol. Genet. 20, 1182–1196 [DOI] [PubMed] [Google Scholar]
- 16.Santini E. and Klann E. (2011) Dysregulated mTORC1-dependent translational control: from brain disorders to psychoactive drugs. Front Behav. Neurosci. 5, 76. [DOI] [PMC free article] [PubMed] [Google Scholar]
- 17.Costa-Mattioli M. and Monteggia L. M. (2013) mTOR complexes in neurodevelopmental and neuropsychiatric disorders. Nat. Neurosci. 16, 1537–1543 [DOI] [PubMed] [Google Scholar]
- 18.An W. L., Cowburn R. F., Li L., Braak H., Alafuzoff I., Iqbal K., Iqbal I. G., Winblad B., and Pei J. J. (2003) Up-regulation of phosphorylated/activated p70 S6 kinase and its relationship to neurofibrillary pathology in Alzheimer's disease. Am. J. Pathol. 163, 591–607 [DOI] [PMC free article] [PubMed] [Google Scholar]
- 19.Li X., Alafuzoff I., Soininen H., Winblad B., and Pei J. J. (2005) Levels of mTOR and its downstream targets 4E-BP1, eEF2, and eEF2 kinase in relationships with tau in Alzheimer's disease brain. FEBS J. 272, 4211–4220 [DOI] [PubMed] [Google Scholar]
- 20.Yates S. C., Zafar A., Hubbard P., Nagy S., Durant S., Bicknell R., Wilcock G., Christie S., Esiri M. M., Smith A. D., and Nagy Z. (2013) Dysfunction of the mTOR pathway is a risk factor for Alzheimer's disease. Acta Neuropathol. Commun. 1, 3. [DOI] [PMC free article] [PubMed] [Google Scholar]
- 21.Zhou J., Blundell J., Ogawa S., Kwon C. H., Zhang W., Sinton C., Powell C. M., and Parada L. F. (2009) Pharmacological inhibition of mTORC1 suppresses anatomical, cellular, and behavioral abnormalities in neural-specific Pten knock-out mice. J. Neurosci. 29, 1773–1783 [DOI] [PMC free article] [PubMed] [Google Scholar]
- 22.Bateup H. S., Takasaki K. T., Saulnier J. L., Denefrio C. L., and Sabatini B. L. (2011) Loss of Tsc1 in vivo impairs hippocampal mGluR-LTD and increases excitatory synaptic function. J. Neurosci. 31, 8862–8869 [DOI] [PMC free article] [PubMed] [Google Scholar]
- 23.Luikart B. W., Schnell E., Washburn E. K., Bensen A. L., Tovar K. R., and Westbrook G. L. (2011) Pten knockdown in vivo increases excitatory drive onto dentate granule cells. J. Neurosci. 31, 4345–4354 [DOI] [PMC free article] [PubMed] [Google Scholar]
- 24.Zoghbi H. Y. and Bear M. F. (2012) Synaptic dysfunction in neurodevelopmental disorders associated with autism and intellectual disabilities. Cold Spring Harb. Perspect. Biol. 4, 1–22 [DOI] [PMC free article] [PubMed] [Google Scholar]
- 25.Bateup H. S., Johnson C. A., Denefrio C. L., Saulnier J. L., Kornacker K., and Sabatini B. L. (2013) Excitatory/inhibitory synaptic imbalance leads to hippocampal hyperexcitability in mouse models of tuberous sclerosis. Neuron 78, 510–522 [DOI] [PMC free article] [PubMed] [Google Scholar]
- 26.Gkogkas C. G., Khoutorsky A., Ran I., Rampakakis E., Nevarko T., Weatherill D. B., Vasuta C., Yee S., Truitt M., Dallaire P., Major F., Lasko P., Ruggero D., Nader K., Lacaille J. C., and Sonenberg N. (2013) Autism-related deficits via dysregulated eIF4E-dependent translational control. Nature 493, 371–377 [DOI] [PMC free article] [PubMed] [Google Scholar]
- 27.Weston M.C., Chen H., and Swann J.W. (2014) Loss of mTOR repressors Tsc1 or Pten has divergent effects on excitatory and inhibitory synaptic transmission in single hippocampal neuron cultures. Front. Mol. Neurosci. 7, 1. [DOI] [PMC free article] [PubMed] [Google Scholar]
- 28.Pun R. Y., Rolle I. J., Lasarge C. L., Hosford B. E., Rosen J. M., Uhl J. D., Schmeltzer S. N., Faulkner C., Bronson S. L., Murphy B. L., Richards D. A., Holland K. D., and Danzer S. C. (2012) Excessive activation of mTOR in postnatally generated granule cells is sufficient to cause epilepsy. Neuron 75, 1022–1034 [DOI] [PMC free article] [PubMed] [Google Scholar]
- 29.Wong M. (2014) mTOR strikes again: mTORC1 activation causes epilepsy independent of overt pathological changes. Epilepsy Curr. 14, 41–43 [DOI] [PMC free article] [PubMed] [Google Scholar]
- 30.Brewster A. L., Lugo J. N., Patil V. V., Lee W. L., Qian Y., Vanegas F., and Anderson A. E. (2013) Rapamycin reverses status epilepticus-induced memory deficits and dendritic damage. PLoS One 8, e57808. [DOI] [PMC free article] [PubMed] [Google Scholar]
- 31.Sosanya N. M., Brager D. H., Wolfe S., Niere F., and Raab-Graham K. F. (2015) Rapamycin reveals an mTOR-independent repression of Kv1.1 expression during epileptogenesis. Neurobiol. Dis. 73, 96–105 [DOI] [PubMed] [Google Scholar]
- 32.Crino P. B. (2008) Do we have a cure for tuberous sclerosis complex? Epilepsy Curr. 8, 159–162 [DOI] [PMC free article] [PubMed] [Google Scholar]
- 33.Laplante M. and Sabatini DM (2012) mTOR signaling in growth control and disease. Cell 149, 274–293 [DOI] [PMC free article] [PubMed] [Google Scholar]
- 34.Raab-Graham K. F., Haddick P.C., Jan Y. N., and Jan L. Y. (2006) Activity- and mTOR-dependent suppression of Kv1.1 channel mRNA translation in dendrites. Science 314, 144–148 [DOI] [PubMed] [Google Scholar]
- 35.Sosanya N. M., Huang P. P., Cacheaux L. P., Chen C. J., Nguyen K., Perrone-Bizzozero N. I., and Raab-Graham K. F. (2013) Degradation of high affinity HuD targets releases Kv1.1 mRNA from miR-129 repression by mTORC1. J. Cell Biol. 202, 53–69 [DOI] [PMC free article] [PubMed] [Google Scholar]
- 36.Poolos N. P. and Johnston D. (2012) Dendritic ion channelopathy in acquired epilepsy. Epilepsia 9, 32–40 [DOI] [PMC free article] [PubMed] [Google Scholar]
- 37.Wykes R. C., Heeroma J. H., Mantoan L., Zheng K., MacDonald D. C., Deisseroth K., Hashemi K. S., Walker M. C., Schorge S., and Kullmann D. M. (2012) Optogenetic and potassium channel gene therapy in a rodent model of focal neocortical epilepsy. Sci. Transl. Med. 4, 161ra152. [DOI] [PMC free article] [PubMed] [Google Scholar]
- 38.Seto B. (2012) Rapamycin and mTOR: a serendipitous discovery and implications for breast cancer. Clin. Transl. Med. 1, 29. [DOI] [PMC free article] [PubMed] [Google Scholar]
- 39.Workman E. R., Niere F, and Raab-Graham K. F. (2013) mTORC1-dependent protein synthesis underlying rapid antidepressant effect requires GABABR signaling. Neuropharmacology 73, 192–203 [DOI] [PubMed] [Google Scholar]
- 40.Brosch M., Yu L., Hubbard T., and Choudhary J. (2009) Accurate and sensitive peptide identification with Mascot Percolator. J. Proteome Res. 8, 3176–3181 [DOI] [PMC free article] [PubMed] [Google Scholar]
- 41.Searle B. C. (2010) Scaffold: a bioinformatic tool for validating MS/MS-based proteomic studies. Proteomics 10, 1265–1269 [DOI] [PubMed] [Google Scholar]
- 42.Keller A., Nesvizhskii A. I., Kolker E., and Aebersold R. (2002) Empirical statistical model to estimate the accuracy of peptide identifications made by MS/MS and database search. Anal. Chem. 74, 5383–5392 [DOI] [PubMed] [Google Scholar]
- 43.Nesvizhskii A. I., Keller A., Kolker E., and Aebersold R. (2003) A statistical model for identifying proteins by tandem mass spectrometry. Anal. Chem. 75, 4646–4658 [DOI] [PubMed] [Google Scholar]
- 44.Smith A. C., Blackshaw J. A., and Robinson A. J. (2012) MitoMiner: a data warehouse for mitochondrial proteomics data. Nucleic Acids Res. 40, D1160–1167 [DOI] [PMC free article] [PubMed] [Google Scholar]
- 45.Huang da W., Sherman B. T., and Lempicki R. A. (2009) Systematic and integrative analysis of large gene lists using DAVID bioinformatics resources. Nat. Protoc. 4, 44–57 [DOI] [PubMed] [Google Scholar]
- 46.Huang da W., Sherman B. T., and Lempicki R. A. (2009) Bioinformatics enrichment tools: paths toward the comprehensive functional analysis of large gene lists. Nucleic Acids Res. 37, 1–13 [DOI] [PMC free article] [PubMed] [Google Scholar]
- 47.Merico D., Isserlin R., Stueker O., Emili A., and Bader G. D. (2010) Enrichment map: a network-based method for gene-set enrichment visualization and interpretation. PLoS One 5, e13984. [DOI] [PMC free article] [PubMed] [Google Scholar]
- 48.Shannon P., Markiel A., Ozier O., Baliga N. S., Wang J. T., Ramage D., Amin N., Schwikowski B., and Ideker T. (2003) Cytoscape: a software environment for integrated models of biomolecular interaction networks. Genome Res. 13, 2498–2504 [DOI] [PMC free article] [PubMed] [Google Scholar]
- 49.Martin A., Ochagavia M. E., Rabasa L. C., Miranda J., Fernandez-de-Cossio J., and Bringas R. (2010) BisoGenet: a new tool for gene network building, visualization and analysis. BMC Bioinformatics 11, 91. [DOI] [PMC free article] [PubMed] [Google Scholar]
- 50.Abrahams B. S., Arking D. E., Campbell D. B., Mefford H. C., Morrow E. M., Weiss L. A., Menashe I., Wadkins T., Banerjee-Basu S., and Packer A. (2013) SFARI Gene 2.0: a community-driven knowledgebase for the autism spectrum disorders (ASDs). Mol. Autism 4, 36. [DOI] [PMC free article] [PubMed] [Google Scholar]
- 51.Bertram L., McQueen M. B., Mullin K., Blacker D., and Tanzi R. E. (2007) Systematic meta-analyses of Alzheimer disease genetic association studies: the AlzGene database. Nat. Genet. 39, 17–23 [DOI] [PubMed] [Google Scholar]
- 52.Kanehisa M., Goto S., Sato Y., Kawashima M., Furumichi M., and Tanabe M. (2014) Data, information, knowledge, and principle: back to metabolism in KEGG. Nucleic Acids Res. 42, D199–205 [DOI] [PMC free article] [PubMed] [Google Scholar]
- 53.Wickham H. (2007) Reshaping data with the reshape package. J. Stat. Softw. 21, 20 [Google Scholar]
- 54.Kampstra P. (2008) Beanplot: a boxplot alternative for visual comparison of distributions. J. Stat. Softw. 28, 9 [Google Scholar]
- 55.Wickham H. (2009) Ggplot2 : elegant graphics for data analysis (Springer, New York: ) pp viii, 212 p. [Google Scholar]
- 56.Wickham H. (2011) The split-apply-combine strategy for data analysis. J. Stat. Softw. 40, 29 [Google Scholar]
- 57.R Core Team (2015). R: A language and environment for statistical computing. R Foundation for Statistical Computing, Vienna, Austria: URL http://www.R-project.org/. [Google Scholar]
- 58.Workman E. R., Haddick P. C., Bush K., Dilly G. A., Niere F., Zemelman B. V., and Raab-Graham K. F. (2015) Rapid antidepressants stimulate the decoupling of GABA receptors from GIRK/Kir3 channels through increased protein stability of 14–3-3eta. Mol. Psychiatry 20, 298–310 [DOI] [PMC free article] [PubMed] [Google Scholar]
- 59.tom Dieck S., Kochen L., Hanus C., Heumuller M., Bartnik I., Nassim-Assir B., Merk K., Mosler T., Garg S., Bunse S., Tirrell D. A., and Schuman E. M. (2015) Direct visualization of newly synthesized target proteins in situ. Nat. Methods 12, 411–414 [DOI] [PMC free article] [PubMed] [Google Scholar]
- 60.Hays S. A., Huber K. M., and Gibson J. R. (2011) Altered neocortical rhythmic activity states in Fmr1 KO mice are due to enhanced mGluR5 signaling and involve changes in excitatory circuitry. J. Neurosci. 31, 14223–14234 [DOI] [PMC free article] [PubMed] [Google Scholar]
- 61.Niere F., Wilkerson J. R., and Huber K. M. (2012) Evidence for a fragile X mental retardation protein-mediated translational switch in metabotropic glutamate receptor-triggered Arc translation and long-term depression. J. Neurosci. 32, 5924–5936 [DOI] [PMC free article] [PubMed] [Google Scholar]
- 62.Aebersold R., Burlingame A. L., and Bradshaw R. A. (2013) Western blots versus selected reaction monitoring assays: time to turn the tables? Mol. Cell. Proteomics 12, 2381–2382 [DOI] [PMC free article] [PubMed] [Google Scholar]
- 63.Steward O. and Schuman E. M. (2001) Protein synthesis at synaptic sites on dendrites. Annu. Rev. Neurosci. 24, 299–325 [DOI] [PubMed] [Google Scholar]
- 64.Weiler I. J., Irwin S. A., Klintsova A. Y., Spencer C. M., Brazelton A. D., Miyashiro K., Comery T. A., Patel B., Eberwine J., and Greenough W. T. (1997) Fragile X mental retardation protein is translated near synapses in response to neurotransmitter activation. Proc. Natl. Acad. Sci. U.S.A. 94, 5395–5400 [DOI] [PMC free article] [PubMed] [Google Scholar]
- 65.Waung M. W., Pfeiffer B. E., Nosyreva E. D., Ronesi J. A., and Huber K. M. (2008) Rapid translation of Arc/Arg3.1 selectively mediates mGluR-dependent LTD through persistent increases in AMPAR endocytosis rate. Neuron 59, 84–97 [DOI] [PMC free article] [PubMed] [Google Scholar]
- 66.Ainsley J. A., Drane L., Jacobs J., Kittelberger K. A., and Reijmers L. G. (2014) Functionally diverse dendritic mRNAs rapidly associate with ribosomes following a novel experience. Nat. Commun. 5, 4510. [DOI] [PMC free article] [PubMed] [Google Scholar]
- 67.Donnelly C. J., Fainzilber M., and Twiss J. L. (2010) Subcellular communication through RNA transport and localized protein synthesis. Traffic 11, 1498–1505 [DOI] [PMC free article] [PubMed] [Google Scholar]
- 68.Yu H., Greenbaum D., Xin Lu H., Zhu X., and Gerstein M. (2004) Genomic analysis of essentiality within protein networks. Trends Genet. 20, 227–231 [DOI] [PubMed] [Google Scholar]
- 69.Nikiforova V. J. and Willmitzer L. (2007) Network visualization and network analysis. EXS 97, 245–275 [DOI] [PubMed] [Google Scholar]
- 70.Fiszer S. and Robertis E. D. (1967) Action of triton X-100 on ultrastructure and membrane-bound- enzymes of isolated nerve endings from rat brain. Brain Res. 5, 31–44 [DOI] [PubMed] [Google Scholar]
- 71.Cohen R. S., Blomberg F., Berzins K., and Siekevitz P. (1977) The structure of postsynaptic densities isolated from dog cerebral cortex. I. Overall morphology and protein composition. J. Cell Biol. 74, 181–203 [DOI] [PMC free article] [PubMed] [Google Scholar]
- 72.Arancio O., Kiebler M., Lee C. J., Lev-Ram V., Tsien R. Y., Kandel E. R., and Hawkins R. D. (1996) Nitric oxide acts directly in the presynaptic neuron to produce long-term potentiation in cultured hippocampal neurons. Cell 87, 1025–1035 [DOI] [PubMed] [Google Scholar]
- 73.Biederer T., Sara Y., Mozhayeva M., Atasoy D., Liu X., Kavalali E. T., and Sudhof T. C. (2002) SynCAM, a synaptic adhesion molecule that drives synapse assembly. Science 297, 1525–1531 [DOI] [PubMed] [Google Scholar]
- 74.Villasana L. E., Klann E., and Tejada-Simon M. V. (2006) Rapid isolation of synaptoneurosomes and postsynaptic densities from adult mouse hippocampus. J. Neurosci. Methods 158, 30–36 [DOI] [PMC free article] [PubMed] [Google Scholar]
- 75.Honer W. G. (2003) Pathology of presynaptic proteins in Alzheimer's disease: more than simple loss of terminals. Neurobiol. Aging 24, 1047–1062 [DOI] [PubMed] [Google Scholar]
- 76.Honer W. G., Barr A. M., Sawada K., Thornton A. E., Morris M. C., Leurgans S. E., Schneider J. A., and Bennett D. A. (2012) Cognitive reserve, presynaptic proteins, and dementia in the elderly. Transl. Psychiatry 2, e114. [DOI] [PMC free article] [PubMed] [Google Scholar]
- 77.Greber S., Lubec G., Cairns N., and Fountoulakis M. (1999) Decreased levels of synaptosomal associated protein 25 in the brain of patients with Down syndrome and Alzheimer's disease. Electrophoresis 20, 928–934 [DOI] [PubMed] [Google Scholar]
- 78.Washbourne P., Thompson P. M., Carta M., Costa E. T., Mathews J. R., Lopez-Bendito G., Molnar Z., Becher M. W., Valenzuela C. F., Partridge L. D., and Wilson M. C. (2002) Genetic ablation of the t-SNARE SNAP-25 distinguishes mechanisms of neuroexocytosis. Nat. Neurosci. 5, 19–26 [DOI] [PubMed] [Google Scholar]
- 79.Han M. H., Jiao S., Jia J. M., Chen Y., Chen C. Y., Gucek M., Markey S. P., and Li Z. (2013) The novel caspase-3 substrate Gap43 is involved in AMPA receptor endocytosis and long-term depression. Mol. Cell. Proteomics 12, 3719–3731 [DOI] [PMC free article] [PubMed] [Google Scholar]
- 80.Rizo J. and Sudhof T. C. (2012) The membrane fusion enigma: SNAREs, Sec1/Munc18 proteins, and their accomplices – guilty as charged? Annu. Rev. Cell Dev. Biol. 28, 279–308 [DOI] [PubMed] [Google Scholar]
- 81.Powell C. M. (2006) Gene targeting of presynaptic proteins in synaptic plasticity and memory: across the great divide. Neurobiol. Learn. Mem. 85, 2–15 [DOI] [PMC free article] [PubMed] [Google Scholar]
- 82.Cajigas I. J., Tushev G., Will T. J., tom Dieck S., Fuerst N., and Schuman E. M. (2012) The local transcriptome in the synaptic neuropil revealed by deep sequencing and high-resolution imaging. Neuron 74, 453–466 [DOI] [PMC free article] [PubMed] [Google Scholar]
- 83.Ovsepian S. V. and Dolly J. O. (2011) Dendritic SNAREs add a new twist to the old neuron theory. Proc. Natl. Acad. Sci. U.S.A. 108, 19113–19120 [DOI] [PMC free article] [PubMed] [Google Scholar]
- 84.Tavazoie S. F., Alvarez V. A., Ridenour D. A., Kwiatkowski D. J., and Sabatini B. L. (2005) Regulation of neuronal morphology and function by the tumor suppressors Tsc1 and Tsc2. Nat. Neurosci. 8, 1727–1734 [DOI] [PubMed] [Google Scholar]
- 85.Auerbach B. D., Osterweil E. K., and Bear M. F. (2011) Mutations causing syndromic autism define an axis of synaptic pathophysiology. Nature 480, 63–68 [DOI] [PMC free article] [PubMed] [Google Scholar]
- 86.Fossati G., Morini R., Corradini I., Antonucci F., Trepte P., Edry E., Sharma V., Papale A., Pozzi D., Defilippi P., Meier J. C., Brambilla R., Turco E., Rosenblum K., Wanker E. E., Ziv N. E., Menna E., and Matteoli M. (2015) Reduced SNAP-25 increases PSD-95 mobility and impairs spine morphogenesis. Cell Death Differ. 22, 125–143 [DOI] [PMC free article] [PubMed] [Google Scholar]
- 87.Antonucci F., Corradini I., Morini R., Fossati G., Menna E., Pozzi D., Pacioni S., Verderio C., Bacci A., and Matteoli M. (2013) Reduced SNAP-25 alters short-term plasticity at developing glutamatergic synapses. EMBO Rep. 14, 645–651 [DOI] [PMC free article] [PubMed] [Google Scholar]
- 88.Aldinger K. A., Plummer J. T., Qiu S., and Levitt P. (2011) SnapShot: genetics of autism. Neuron 72(2), 418–418 e411 [DOI] [PubMed] [Google Scholar]
- 89.Durand C. M., Perroy J., Loll F., Perrais D., Fagni L., Bourgeron T., Montcouquiol M., and Sans N. (2012) SHANK3 mutations identified in autism lead to modification of dendritic spine morphology via an actin-dependent mechanism. Mol. Psychiatry 17, 71–84 [DOI] [PMC free article] [PubMed] [Google Scholar]
- 90.Selak S., Paternain A. V., Aller M. I., Pico E., Rivera R., and Lerma J. (2009) A role for SNAP25 in internalization of kainate receptors and synaptic plasticity. Neuron 63, 357–371 [DOI] [PubMed] [Google Scholar]
- 91.Vincent P. and Mulle C. (2009) Kainate receptors in epilepsy and excitotoxicity. Neuroscience 158, 309–323 [DOI] [PubMed] [Google Scholar]
- 92.Rizo J. and Sudhof T. C. (2002) Snares and Munc18 in synaptic vesicle fusion. Nat. Rev. Neurosci. 3, 641–653 [DOI] [PubMed] [Google Scholar]
- 93.Catterall W. A. and Few A. P. (2008) Calcium channel regulation and presynaptic plasticity. Neuron 59, 882–901 [DOI] [PubMed] [Google Scholar]
- 94.Lau C. G., Takayasu Y., Rodenas-Ruano A., Paternain A. V., Lerma J., Bennett M. V., and Zukin R. S. (2010) SNAP-25 is a target of protein kinase C phosphorylation critical to NMDA receptor trafficking. J. Neurosci. 30, 242–254 [DOI] [PMC free article] [PubMed] [Google Scholar]
- 95.Tomasoni R., Repetto D., Morini R., Elia C., Gardoni F., Di Luca M., Turco E., Defilippi P., and Matteoli M. (2013) SNAP-25 regulates spine formation through postsynaptic binding to p140Cap. Nat. Commun. 4, 2136. [DOI] [PubMed] [Google Scholar]
- 96.Ariga H., Takahashi-Niki K., Kato I., Maita H., Niki T., and Iguchi-Ariga S. M. (2013) Neuroprotective function of DJ-1 in Parkinson's disease. Oxid. Med. Cell Longev. 2013:683920. [DOI] [PMC free article] [PubMed] [Google Scholar]
- 97.Miller-Fleming L., Antas P., Pais T. F., Smalley J. L., Giorgini F., and Outeiro T. F. (2014) Yeast DJ-1 superfamily members are required for diauxic-shift reprogramming and cell survival in stationary phase. Proc. Natl. Acad. Sci. U.S.A. 111, 7012–7017 [DOI] [PMC free article] [PubMed] [Google Scholar]
Associated Data
This section collects any data citations, data availability statements, or supplementary materials included in this article.