Abstract
We used a next-generation high-throughput sequencing platform to resequence the Xinguowei and Shouxing melon cultivars, the parents of Fengwei melon. We found 84% of the reads (under a coverage rate of “13×”) placed on the reference genome DHL92. There were 2,550,000 single-nucleotide polymorphisms and 140,000 structural variations in the two genomes. We also identified 1,290 polymorphic genes between Xinguowei and Shouxing. We combined specific length amplified fragment sequencing (SLAF-seq) and bulked-segregant analysis (super-BSA) to analyze the two parents and the F2 extreme phenotypes. This combined method yielded 12,438,270 reads, 46,087 SLAF tags, and 4,480 polymorphic markers (average depth of 161.81×). There were six sweet trait-related regions containing 13 differential SLAF markers, and 23 sour trait-related regions containing 48 differential SLAF markers. We further fine-mapped the sweet trait to the genomic regions on chromosomes 6, 10, 11, and 12. Correspondingly, we mapped the sour trait-related genomic regions to chromosomes 2, 3, 4, 5, 9, and 12. Finally, we positioned nine of the 61 differential markers in the sweet and sour trait candidate regions on the parental genome. These markers corresponded to one sweet and eight sour trait-related genes. Our study provides a basis for marker-assisted breeding of desirable sweet and sour traits in Fengwei melons.
Introduction
The melon (Cucumis melo L.) is an important horticultural crop, and has diverse phenotypes and genotypes that result in variations in fruit quality including sugar and acid content, aroma, and fruit shape [1]. The principal component of fruit quality in sweet melons is the content of sugar, primarily sucrose [2–4]. Details of the metabolic pathways involved in sucrose accumulation in melon fruit have been previously described [5]. The organic acid content in most melon fruit is very low (pH >6.0) [6]. However, some varieties accumulate high levels of acid (pH <5) [7–11], and some breeders of melons have combined high acidity and high sugar traits to develop dessert cultivars [12–14]. The hereditary characteristics of citric acid content and titratable acid have been studied in melon fruit [7]. A single major QTL for pH has been found to co-localize with major QTLs for citric and malic acids [8]. Furthermore, the linkage map position for pH genes has been reported and an SSR marker was identified as being tightly associated with pH [10]. A previous study showed in bred melons that the high sugar and low pH traits were inherited independently of each other, and that the acidity trait was particularly associated with citric acid levels [12]. However, the relationship between genomic variations and the sour trait phenotype has not been reported in melon fruit.
Fengwei melon is a hybrid obtained from the Shouxing and Xinguowei varieties, and has a unique sweet and sour taste that results from the combined traits of its parents. Shouxing [Cucumis melo L. ssp. melo cover. ameri (Pang) Greb] is a crossbred from multiple parents, while Xinguowei [Cucumis melo L. ssp. melo convar. ameri (Pang) Greb, a sour tasting Hami melon line bred using high-dose Co60 γ-ray irradiation] has a unique sweet and sour taste [13].
Over the past few years, various genetic and genomic resources for melon have become available. New genetic maps have been reported for numerous traits such as fruit size and shape, climacteric ripening, netting, color, various metabolites, total soluble solids, and pH [8,9,15,16]. Resequencing technology and bioinformatics tools have helped to unravel the genetic variations and diversity on a genome-wide scale [17]. Garcia-Mas et al. [18] sequenced the complete genome of the double haploid line, DHL92, and provided valuable information about this important cucurbit. Blanca et al. [19] resequenced the transcriptomes of 67 melon genotypes using a high-throughput SOLiD™ system. Bulked-segregant analysis (BSA) is used for fine-mapping of phenotypic mutants [20] and is substantially enhanced by whole genome sequencing [21]. The use of sequence-based markers such as restriction site-associated DNA (RAD) markers, helps to achieve high-density discovery and genotyping in large populations [22]. However, these technologies usually fail in the presence of repetitive genomic sequences that usually are not useful in mapping experiments. Sun et al. [23] developed an enhanced reduced representation library (RRL) sequencing method, known as specific length amplified fragment sequencing (SLAF-seq) technology, that combines locus-specific amplification and high-throughput sequencing. This technique avoids the selection of repetitive genomic sequences and is highly accurate, low-cost, and fast.
Therefore, the present study aimed to localize important genes related to the sweet and sour traits in Fengwei melon (the F1 hybrid of the Shouxing and Xinguowei varieties). We used parental resequencing and comparative genomics to compare whole genome variations and functional genes between the two parental lines, in order to provide references for the gene mapping of sweet and sour traits. We used a combination of SLAF-seq and BSA technology (super-BSA) to help identifying the genomic regions affecting these traits in pools of extreme phenotypes from the F2 population (Fengwei melon ⊗). Our specific objectives were: 1) to obtain sweetness and sourness candidate genes through bioinformatics mapping of candidate regions closely correlated with sweet and sour traits; and 2) to perform a combined analysis of genes in these regions and SLAF differential markers.
Materials and Methods
Plants
The Shouxing parental line [Cucumis melo L. ssp. melo convar. ameri (Pang.) Greb] is a crossbred from multiple parents and its fruit has a sweet taste. The other parental line used in this study, Xinguowei [designated guowei (sour taste Hami melon line bred from the 76–2 line using high-dose Co60 γ-ray irradiation [13]) × PI140471], is a sour-tasting variety. Fengwei melon is the F1 hybrid obtained using Shouxing as the female parent and Xinguowei as the male parent. Its fruit has a unique sour and sweet taste. We obtained the F2 segregating population by self-pollinating the F1 hybrid (Fengwei melon).
Ten plants of each of the female parent, male parent, and F1 and F2 populations were grown at the experimental field of Xinjiang Academy of Agricultural Science (Xinjiang Turpan, China) in an open field during spring 2012 (F2 individuals, n = 479) and autumn 2012 (F2 individuals, n = 500), and in a greenhouse in Xinjiang Turpan during autumn 2012 (F2 individuals, n = 514). No endangered or protected species were involved in this study.
Total soluble solids and pH of the fruit
A digital refractometer (Atago Co, Ltd, Tokyo, Japan) was used to measure the total soluble solids (TSS). A digital pH meter (Ohaus, Shanghai, China) was used to measure the pH of the juice [5]. The juice used in these experiments was extracted from a single fruit harvested from each plant. About 5 g of ripe flesh was taken from the equatorial portion of the fruit after removing the rind and seed cavity. The flesh was squeezed by hand, and the juice was collected and centrifuged to remove solid matter.
DNA extraction
DNA was extracted from young leaf tissue obtained from 10 female parent plants, 10 male parent plants, and 50 plants from each of the three extreme phenotypes from the F2 population, as described by Murray and Thompson [24].
Resequencing and detection of genome variations in the two parents
Paired-end (PE) and mate-pair Solexa libraries were prepared, according to the manufacturer's instructions (Illumina, Hayward, CA, USA). Shouxing and Xinguowei DNAs were randomly sheared. After electrophoresis, DNA fragments of the desired length were gel-purified. Adaptor ligation and DNA cluster preparation were performed, and the resulting DNA libraries were subjected to Solexa sequencing using an Illumina GAIIx (Illumina) platform. Low-quality reads (<20), reads with adaptor sequences, and duplicate reads were filtered out, and the remaining high-quality data were used for mapping, which was carried out with the Burrows-Wheeler alignment (BWA) software [25].
The SAMtools software [26] was used to detect single-nucleotide polymorphisms (SNPs), using the following parameters: 1) mpileup-f ref.fa-D-C 50-g-s-u; and 2) bcftools view-cegINv. The SNPs were then screened using the following criteria: 1) no less than 2× coverage depth (no less than 3× in the heterozygous locus); 2) no more than 3× the average depth (11×); and 3) discarding of all SNPs detected in repeat regions. Structural variations (SVs) were detected using Pindel 0.2.4 [27] (perl $Bin/bin/soft/pindel/bam2pindel.pl -i sort.bam -o output -s keys -om -pi 272.67) and BreakDancer [28] Max-0.0.1r61 (perl $Bin/bin/soft/breakdancer/bam2cfg.pl sort.bam -s 40 -q 35 > $breakdancer_dir/$sample.config). To obtain reliable SVs, the detected SVs were returned to the PE alignments between the parental lines and the reference, and were validated using the following criteria: 1) 2× to 100× coverage depth; and 2) a score >20 for the quality of the SV. In our results, the types of SV included insertion (INS) and deletion (DEL) (collectively, indels), interchromosomal translocation (CTX), deletion including insertion (DII), intrachromosomal translocation (ITX), and inversion (INV) [29]. The two parents were homozygous to the different alleles.
The localization of SNPs, indels, and SVs was based on annotations of gene models provided by reference genome databases (https://melonomics.net) [18], and was carried out using the snpEff software (http://snpeff.sourceforge.net/SnpEff_manual.html). The three types of polymorphism were annotated as genic (in gene regions) or intergenic (in non-gene regions). Genic SNPs, indels, and SVs were classified as exonic or intronic according to their localization. The GeneWise software [30] was used to separate the exonic SNPs into synonymous or non-synonymous types.
Annotation of differential gene function between Shouxing and Xinguowei
We compared the non-synonymous SNPs of the two parental lines and the SVs (including indels) in exons against the Kyoto Encyclopedia of Genes and Genomes (KEGG) databases, using the BLAST program with a cutoff E-value of 1×10⁻⁵.
Super-BSA pools, library construction, and high-throughput sequencing
Five different DNA pools were prepared by mixing equal amounts of DNA from the female Shouxing bulk ‘M’ (sweet) and male Xinguowei bulk ‘P’ (sour). Fifty plants were used from each of the three extreme phenotypes from the F2 population bulk (sweet, sour, and non-sweet non-sour). The library was constructed as described by Sun et al. [23], with small modifications. The GC content, repeated sequences, and genetic characteristics of the DNA pools were analyzed using SLAFPredict (Biomarker, Beijing, China). The genomic DNA pools were digested using the XhoI and MseI restriction enzymes, followed by PCR amplification, fragment amplification, fragment selection, fragment extraction and amplification, and fragment sequencing using the Illumina GAIIx system.
SLAF marker development and polymorphism analysis
All SLAF pair-end reads with clear index information were clustered based on sequence similarity, as detected by BLAT v.34 [31] (-tileSize = 11, -stepSize = 11, -minScore = 30). Sequences with over 90% identity were grouped in one SLAF locus, as described by Sun et al. [23]. Melon is a diploid species, and one locus contains at most four SLAF tags; therefore, groups containing more than four tags were filtered out as repetitive SLAFs. In this study, SLAFs with a sequence depth <164 were defined as low-depth SLAFs and were filtered out. SLAFs with 2, 3, or 4 tags were identified as polymorphic SLAFs and considered to be potential markers.
Fine mapping of the sweet and sour traits
All markers were identified based on the parental origin of alleles M and P, according to the sequencing depth. Msweet represented the depth for the sweet phenotype from the female line; Pnon-sweet non-sour represented the depth for the non-sweet non-sour phenotype from the male line; Mnon-sweet non-sour represented the depth for the non-sweet non-sour phenotype from the female parent; and Psour represented the depth for the sour phenotype from the male line. The following ratios were calculated: Ratio_sweet = Msweet/Pnon-sweet non-sour; and Ratio_sour = Psour/Mnon-sweet non-sour. In the case that Pnon-sweet non-sour = 0, Ratio_sweet was set to 1000; in the case that Mnon-sweet non-sour = 0, Ratio_sour was set to 1000. The thresholds for association were set at a ratio ≥3. Although the ratio measurement employed in this analysis has not been widely used in previous studies, it was recently described to be a good approach to BSA analysis [32]. It can be inferred that a ratio ≥3 means an SNP-index ratio ≥0.5. The SNP-index indicates the proportion of reads harboring a SNP that is different from the reference sequence [33].
We performed fine mapping of the genomic region according to the sequences of the sweet and sour trait-related SLAF markers in the scaffold. We used BLAT v.34 [31] (-tileSize = 11, -stepSize = 11, -minScore = 30) for every SLAF marker (https://melonomics.net) to determine the SLAF position in the genetic map.
Combined analysis of regions associated with sweet and sour traits and parental resequencing data
The genes in regions associated with sweet and sour traits and the differential SLAF markers were matched with the parental resequencing data using BLAT v.34 [31] (-tileSize = 11, -stepSize = 11, -minScore = 30). We used the annotation in ‘gff’ files of the genome to determine whether the markers covered the gene. We determined the variation in traits by analyzing the SNPs between genes and genome where correlated markers were located; or by analyzing the SNPs between samples (whether the SNP variation induced genetic variation and influenced the variation in the traits). Finally, we extracted the corresponding genes according to the physical location of the markers (in genes) and that correlated with the sweet and sour traits through gene function annotation.
Results
Variability in fruit TSS and pH in the two parents and the F1 and F2 populations
To estimate the variation in the TSS and pH of the ripe fruits, TSS and pH were measured in the parents and the F1 (Fengwei melon) and three F2 populations grown in Turpan during two growing seasons (open field in spring and autumn 2012, and greenhouse in autumn 2012). Results showed that there was significant variability in the TSS and pH traits between the parental, F1, and F2 populations (p≤0.01; Welch’s ANOVA test; Table 1). Fruits grown in the spring showed higher levels of TSS and pH than those grown in autumn. In addition, fruits grown in autumn had higher levels of TSS and pH when grown in a greenhouse than when grown in an open field. We used the greenhouse results from autumn 2012 in subsequent parent resequencing and super-BSA. Melon fruits with TSS ≥8 and pH >5.3 were considered sweet, while those with TSS <8 and pH ≤5.3 were considered sour. We characterized Shouxing as sweet (TSS >12, pH >6), Xinguowei as sour (TSS <8, pH <5), and F1 Fengwei as sweet and sour (TSS >12, pH <5). The F2 population produced four types of trait: sweet (TSS ≥8 and pH >5.3), sour (TSS <8 and pH ≤5.3), sweet and sour (TSS >12, pH <5) and non-sweet non-sour (TSS <8, pH >5.3). We selected the sweet (TSS >12, pH >6), sour (TSS <8, pH <5) and non-sweet non-sour (TSS <8, pH >5.3) pools from the F2 lines for subsequent super-BSA.
Table 1. TSS and pH data of the parental lines and F1 and F2 populations.
| Planting | Shouxing | Xinguowei | F1 | F2 | F2 | F2 | |
|---|---|---|---|---|---|---|---|
| Trait | season and location | (mean ± SD) | (mean ± SD) | (mean ± SD) | (mean ± SD) | (max ± SD) | (min ± SD) |
| TSS | Open field in spring | 13.8 ± 1.4 | 7.5 ± 1.1 | 13.2 ± 1.2 | 11.2 ± 1.5 | 15.2 ± 1.8 | 7.2 ± 0.6 |
| Open field in autumn | 12.2 ± 2.1 | 7.1 ± 1.3 | 12.2 ± 0.8 | 10.1 ± 1.1 | 13.2 ± 1.8 | 7.0 ± 0.5 | |
| Greenhouse in autumn | 12.7 ± 1.2 | 6.8 ± 0.9 | 12.6 ± 1.4 | 10.9 ± 0.9 | 15.2 ± 1.8 | 6.6 ± 0.3 | |
| pH | Open field in spring | 6.3 ± 0.2 | 4.6 ± 0.2 | 5.0 ± 0.6 | 5.5 ± 0.6 | 6.6 ± 0.9 | 4.4 ± 0.2 |
| Open field in autumn | 6.1 ± 0.1 | 4.5 ± 0.3 | 4.8 ± 1.1 | 5.4 ± 0.6 | 6.3 ± 0.9 | 4.4 ± 0.4 | |
| Greenhouse in autumn | 6.1 ± 0.2 | 4.4 ± 0.2 | 4.8 ± 0.6 | 5.2 ± 0.6 | 6.2 ± 0.9 | 4.3 ± 0.2 |
Mean and standard deviation (SD) values were calculated using JMP v7.0 software.
Discovery of polymorphism within genic regions related to fruit flavor traits
We used a Solexa Genome Analyzer II for genomic resequencing of the Shouxing and Xinguowei parental lines. Shouxing yielded 29,882,152 101-bp short sequences while Xinguowei produced 30,603,252 short sequences. We used the BWA software to match the 24,796,210 and 25,746,516 reads in the two parental lines to the reference genome, DHL92 (Table 2).
Table 2. Summary of the resequencing coverage.
| Sample | Total reads | Total_map (%) | Identity (%) | Depth | Coverage_ratio (%) |
|---|---|---|---|---|---|
| Shouxing | 29,882,152 | 82.98% | 98.91% | 13.07 | 93.55% |
| Xinguowei | 30,603,252 | 84.13% | 98.92% | 13.2 | 94.74% |
The analyses were conducted using the Map_stat_v0.1.pl software [34]. Total map (%): number of clean reads successfully mapping to the genome/total number of clean reads. Identity (%): (total number of all clean reads mapping to the genome—number of all mismatched bases)/total number of all clean reads mapping to the genome. Coverage_ratio (%): total number of bases mapping to the genome/genome size.
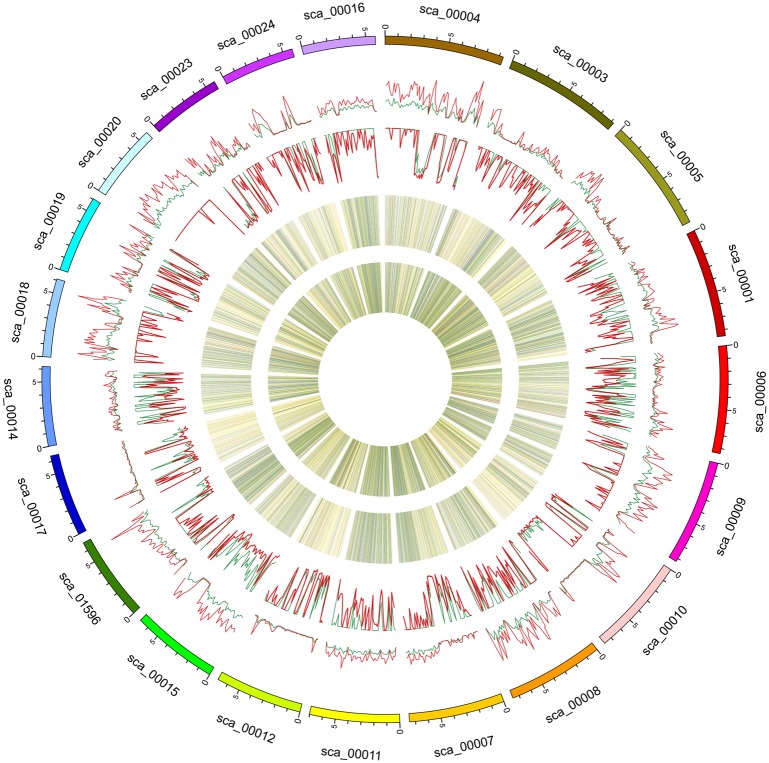
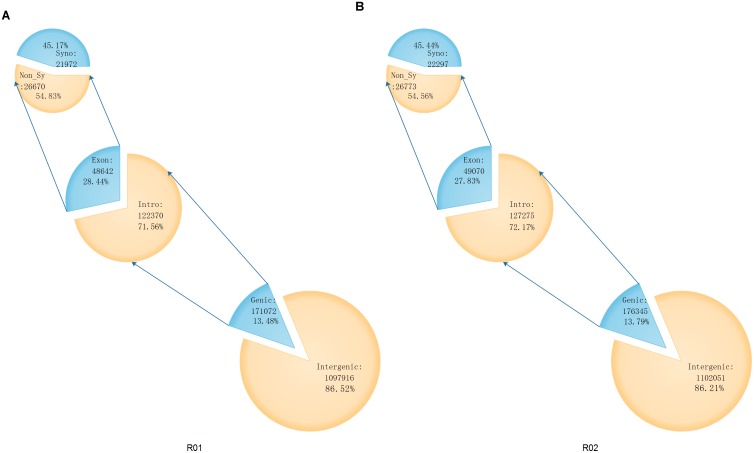
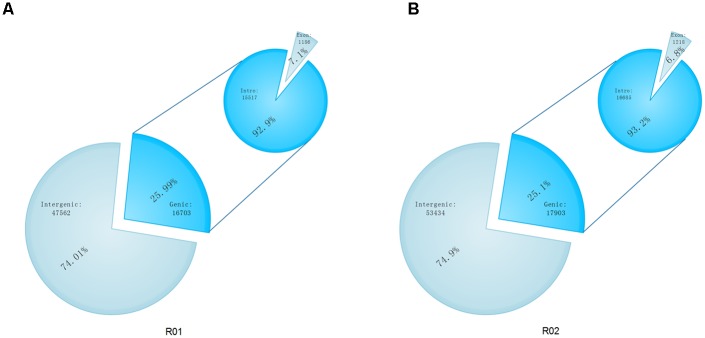
The SAMtools software [26] was used to search for SNPs in the genomes of the two parental lines. There were 1,278,396 SNPs between Shouxing and DHL92, and 1,268,988 SNPs between Xinguowei and DHL92 (Fig 1). According to the differences in the nucleotide substitutions, the SNPs were either transitions (C/T or G/A, shown in red) or transversions (C/G, T/A, A/C or G/T, shown in black) (Fig 1). For both parental lines, the proportion of transitions (Ts) was higher than that of transversions (Tv). The Ts/Tv ratios for Shouxing and Xinguowei, with reference to the DHL92 genome, were 2.44 and 2.42, respectively. There were 171,072 and 176,345 genic SNPs, respectively. Of the genic SNPs in Shouxing and Xinguowei, 48,642 and 49,070 were located in exons, respectively, and included 26,670 and 26,773 non-synonymous SNPs, respectively (Fig 2A and 2B). Of the 1,152,860 differential SNPs between Shouxing and Xinguowei, 22,322 were non-synonymous. We also used the Pindel [27] and BreakDancer [28] software to detect indels and SVs in the genomes of the two parental lines (Fig 1). We identified 26,802 indels and 10,109 SVs in Shouxing melon, and 28,546 indels and 12,968 SVs in Xinguowei melon. There were 16,703 and 17,903 genic SVs (including indels), and 1,186 and 1,218 exonic SVs (including indels), in Shouxing and Xinguowei, respectively (Fig 3A and 3B). Of the 64,265 and 71,337 SVs (including indels) detected in these two parental lines, INS and DEL accounted for 94.98% and 95.54%, respectively. In Shouxing and Xinguowei, other types of SV and CTX accounted for 4.58% and 4.04%, respectively; In DELs and INS for 0.23% and 0.22%, respectively; CTX for 0.15% and 0.13%, respectively; and INV for 0.06% and 0.07%, respectively. To verify the accuracy of the detection of SNPs and SVs, we randomly selected variations in 400 SNPs and 100 SVs (INS and DEL) of 100 to 300 bp in length for validation in the two inbred lines by PCR and sequencing (S1, S2, S3 and S4 Tables). Among these, 394 SNPs and 92 SV loci could be amplified and sequenced. These data verified 98.75% of the SNPs and 92.0% of the SVs, indicating that our re-sequencing data were reliable.
Fig 1. Genome sequence variations identified in Shouxing and Xinguowei using Circus programs.
The first ring is the scaffold in the reference genome. The second ring is the SNP distribution in Shouxing. The third ring is the SNP distribution in Xinguowei. The fourth ring is the SV distribution in Shouxing. The fifth ring is the SV distribution in Xinguowei. The SNPs and SVs of the two parental lines are greatest on scaffold 4, i.e. 44,625 and 1,534 for Shouxing, and 42,395 and 1,560 for Xinguowei, respectively. The SNPs (8,554 and 9,612) and SVs (946 and 956) for the two respective parental lines are lowest on scaffold 21.
Fig 2. SNP annotations in Shouxing and Xinguowei.
According to the annotation of the reference genome DHL92, the locations of the SNPs in the genes were classified as genic or intergenic. Genic SNPs were further classified as intronic or exonic, and SNPs in the exon region were subclassified as either synonymous or non-synonymous variations. The number and proportion of SNP polymorphisms in each class are shown. A: Shouxing; B: Xinguowei.
Fig 3. Annotation of SVs in Shouxing and Xinguowei.
According to the annotation of the reference genome DHL92, the locations of the SVs in the genes were classified as genic or intergenic. Genic SNPs were further classified as intronic or exonic. The number and proportion of SV polymorphisms in each class are shown. A: Shouxing; B: Xinguowei.
Identification of pathways associated with fruit flavor traits
Previous studies have speculated that genetic variations in melon fruit may contribute to phenotypic differences in traits [8,9,15,16]. Therefore, we focused our analysis on non-synonymous SNPs, indels, and SVs in the exons of genes in the two parental lines. We performed a preliminary examination of the genes’ functional annotations to assess the influence of genotypic variations on phenotypic variations.
Pathway enrichment analysis for the 575 Shouxing polymorphic genes in 101 KEGG pathways and the 715 Xinguowei polymorphic genes in 110 KEGG pathways enabled the identification of several pathways contributing to fruit flavor traits. The pathways identified included starch and sucrose metabolism, fructose and mannose metabolism, galactose metabolism, citrate cycle metabolism, nicotinate and nicotinamide metabolism, folate biosynthesis, and vitamin B6 metabolism (S5 Table and S6 Table). We identified four genes in Xinguowei that were annotated in the pathway for nicotinate and nicotinamide metabolism: nudix hydrolase-19, nicotinamide mononucleotide adenylyltransferase-3, nicotinate phosphoribosyltransferase, and L-aspartate oxidase. We also annotated two genes as part of the folate pathway: folylpolyglutamate synthase and bifunctional dihydrofolate reductase-thymidylate synthase. Threonine synthase, whose encoding gene was identified as polymorphic, participates in vitamin B6 metabolism, which is associated with fruit acid. The higher content of nicotinate, folate, and vitamin B6 in Xinguowei (data not shown) may be associated with variations in the genes of these pathways. In Xinguowei, three polymorphic genes were identified and annotated in the valine, leucine, and isoleucine pathways. These included: pyruvate dehydrogenase E1 component subunit beta-3, branched-chain-amino-acid aminotransferase-like protein-3, and 2-isopropylmalate synthase-2.
The three main soluble sugars in melons are sucrose, glucose and fructose. Sugar metabolism and accumulation determines the sweetness of the melon. We found polymorphisms between the two parents in the starch and sucrose pathway, fructose and mannose pathway, and galactose pathway. Organic acids in fruits are essential components that reflect fruit flavor characteristics. The citrate cycle pathway and its key steps are necessary for the accumulation of organic acids in fruits. Therefore, DNA polymorphisms in these genes could explain the differences in sweet and sour traits between the two inbred lines.
The polymorphic genes in Xinguowei annotated in the citrate cycle pathway encode pyruvate dehydrogenase, aconitate hydratase, isocitrate dehydrogenase, succinate dehydrogenase, phosphoenolpyruvate carboxykinase, succinyl-CoA ligase and 2-oxoglutarate dehydrogenase.
In both Xinguowei and Shouxing, we also identified genes encoding members of the lipoxygenase family, alcohol dehydrogenase family, and cadinene synthase, as well as genes involved in the synthesis of linalool derivatives or the nerolidol synthase of the linalool monomer.
Super-BSA, SLAF markers and polymorphism analysis
Super-BSA analysis was carried out to genotype the bulk pools of the two parental lines and three F2 population: 50 individual plants with TSS ≥8 and pH >5.3, 50 with TSS <8 and pH ≤5.3, and 50 with TSS <8 and pH >5.3. The data from the above pools corroborated with each other to some extent, eliminating the need for biological replicates.
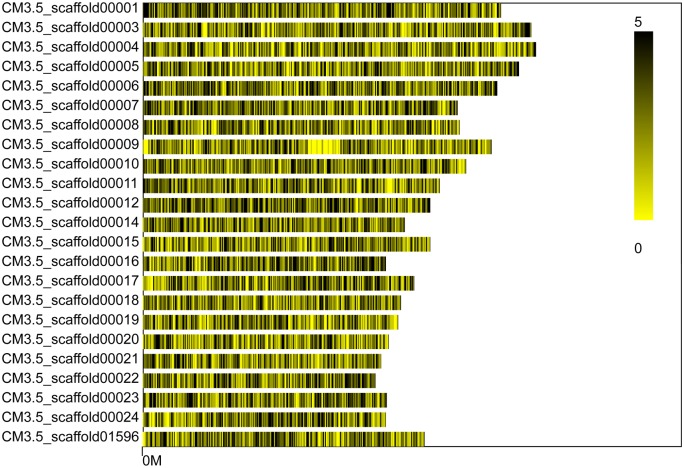
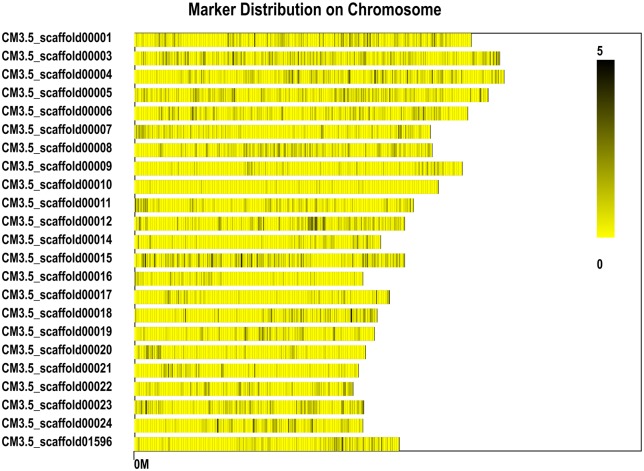
We obtained 12,438,270 reads (Table 3), and used the BLAT matching software to cluster these reads (http://www.blat.net) and map them to the reference DHL92 genome after correction. SLAFs were selected with depths larger than 10×, resulting in a total of 46,087 SLAF tags being obtained with an average depth of 161.81×. Fig 4 shows the even distribution of SLAF tags on the scaffolds (>5 Mb).
Table 3. Summary of SLAF-seq coverage.
| Sample | Read length (bp) | Read number | GC percentage |
|---|---|---|---|
| Shouxing | 80 | 845,612 | 86.67% |
| Xinguowei | 80 | 1,703,803 | 83.65% |
| Sweet | 80 | 3,113,710 | 85.33% |
| Sour | 80 | 3,671,547 | 82.70% |
| Non-sweet, non-sour | 80 | 3,103,598 | 84.47% |
The analyses were conducted using fq_stat_sample software (Biomarker, Beijing, China).
Fig 4. SLAF distribution on the >5 Mb scaffolds obtained using the SLAF.distribution.pl software.
The reference genome used in the analysis was the scaffold that had not been spliced into chromosomes. The SLAF distributions on the scaffolds >5 Mb were selected and counted. The black vertical line on the x axis represents the position of the SLAF in the scaffold, while the y axis represents the number of scaffolds >5 Mb. Dark and light colors denote the SLAF marker numbers at these loci.
We identified the polymorphic loci of 4,480 SLAF markers (Fig 5) and classified these as SNPs, enzyme locus variations, or indels (Table 4). The number of markers was greatest on CM3.5_scaffold00003 (117), and lowest on CM3.5_scaffold00010 (11) (Fig 5).
Fig 5. Diff_Marker distribution on the >5 Mb scaffolds assessed using the SLAF.distribution.pl software.
The black vertical lines on the x axis represent the location of the marker in the scaffold. The y axis represents the scaffold number. Dark and light colors denote the quantity of SLAF markers at these loci.
Table 4. Summary of the SLAF tag and polymorphic markers.
| Type | SNP | EPSNP | INDEL | No polymorphism | Unknown | Repeat | Total |
|---|---|---|---|---|---|---|---|
| Number | 4,326 | 99 | 55 | 39538 | 888 | 1181 | 46087 |
| Percent | 9.38% | 0.21% | 0.11% | 85.78% | 1.92% | 2.56% | 100% |
SNP, EPSNP, and indel analyses of SLAF markers were conducted using the Group_class_ref.pl software.
Association mapping of genes related to sweet and sour traits
We compared the 4,480 SLAF markers with the allelic frequencies of the parental lines and found 2,800 sweet trait-related SLAF markers and 2,711 sour trait-related SLAF markers from the parents.
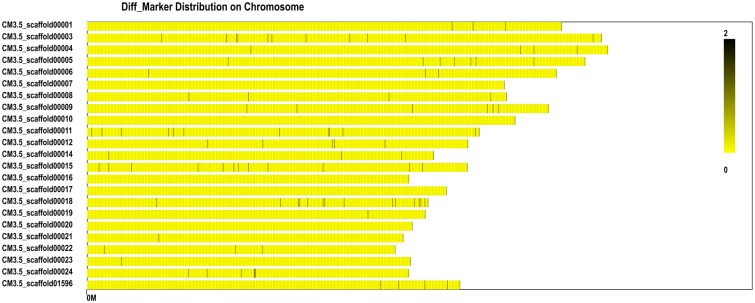
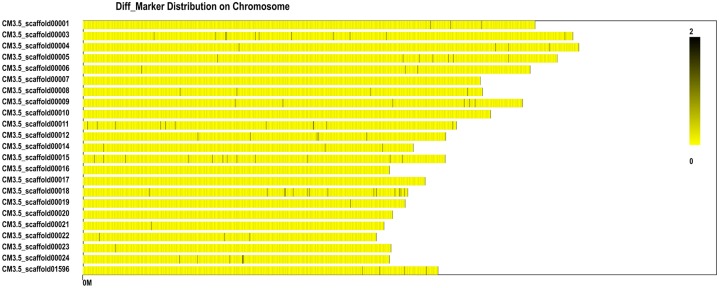
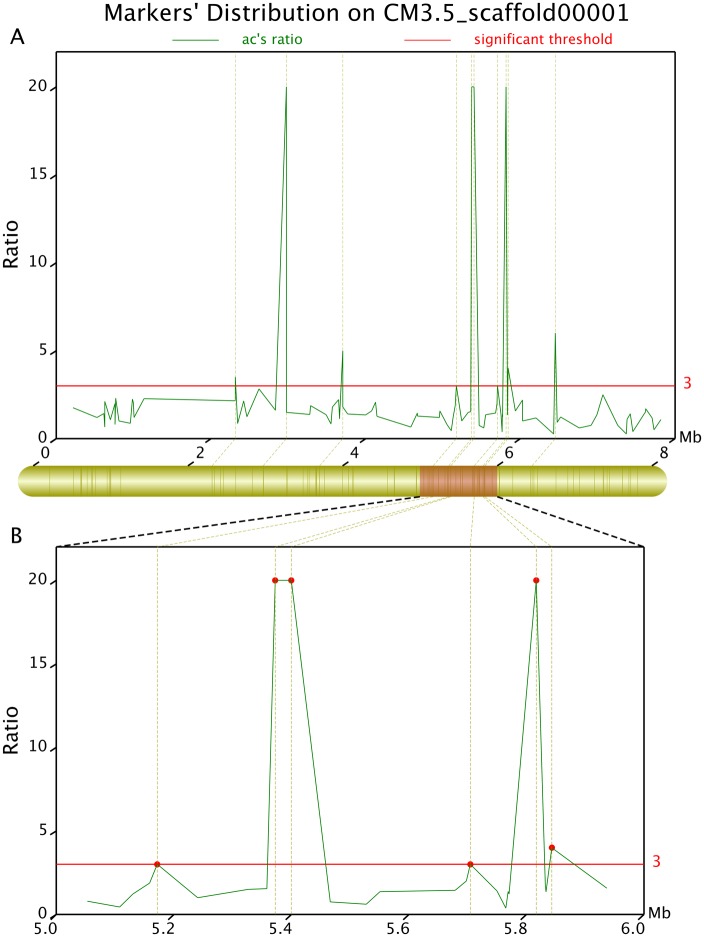
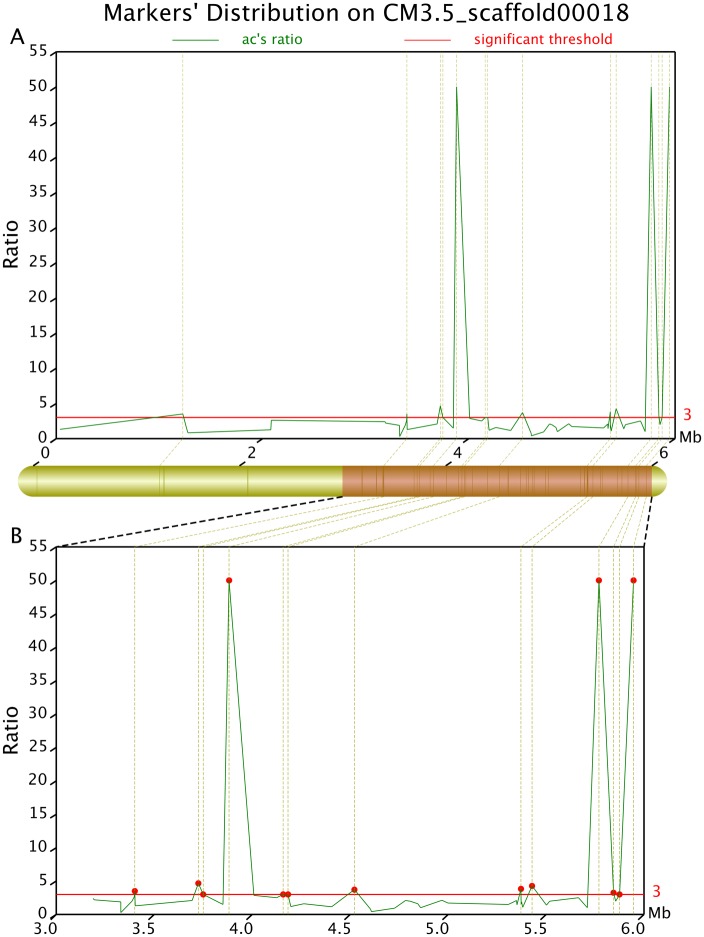
We identified 114 differential SLAF markers related to the sweet trait (Ratio_sweet ≥3; Fig 6) and 215 related to the sour trait (Ratio_sour ≥3; Fig 7). Examination of the distribution of the differential SLAF markers on the CM3.5_scaffold00001 suggested that they correlated most intensively with the sweet trait, showing a coverage area of 0.9 Mb containing 10 markers (marking density of 0.09 Mb/marker) (Fig 8). The markers in the CM3.5_scaffold00018 were most intensively correlated with the sour trait, presenting a coverage area of 2.75 Mb containing 14 markers (marking density of 0.2 Mb/marker) (Fig 9).
Fig 6. Distribution of sweet trait-related Diff_Marker on the scaffolds determined using the SLAF.distribution.pl software.
The x axis refers to the location of the scaffold. The y axis represents the number of the scaffold. The black line represents the position of Diff_Marker on the scaffold.
Fig 7. Distribution of sour trait-related Diff_Marker on the scaffolds determined using the SLAF.distribution.pl software.
The x axis refers to the location of the scaffold. The y axis represents the number of the scaffold, and the black line represents the position of Diff_Marker on the scaffold.
Fig 8. Differential ratio distribution of the sweet trait-related differential markers on CM3.5_scaffold00001 determined using the Geno_ratio.pl software.
The x axis represents chromosomal position. The y axis shows the difference ratio. The upper part of the figure presents the global distribution of the differential markers, while the lower part shows the local distribution. The y axis values at the red lines suggest that the corresponding markers are intensively correlated with target traits. Higher values indicate a more intensive correlation. When Ratio_R°>20, the correlation intensity is 20.
Fig 9. Differential ratio distribution of the sour trait-related differential markers on CM3.5_scaffold00018 determined using the Geno_ratio.pl software.
The x axis represents chromosomal position. The y axis shows the difference ratio. The upper part of this figure presents the global distribution of the differential markers, while the lower part shows the local distribution. The y axis values at the red lines suggest that the corresponding markers are intensively correlated with the target traits. Higher values indicate a more intensive correlation. When Ratio_R°>20, the correlation intensity is 20.
The presence of three or more differential SLAF markers (Ratio_sweet ≥3) in succession helped identifying the regions associated with the sweet and sour traits. There were six sweet trait-related regions containing 13 differential SLAF markers and 62 genes (Table 5), and 23 sour trait-related regions containing 48 differential SLAF markers and 185 genes (Table 6).
Table 5. Association regions, SLAF markers, and number of genes related to the sweet trait.
| Scaffold ID | Start | End | Size (bp) | SLAF marker | Gene number |
|---|---|---|---|---|---|
| CM3,5_scaffold0001 | 5.372,000 | 5,401,000 | 29,000 | SLAF3367 | 2 |
| SLAF3370 | |||||
| CM3,5_scaffold0004 | 5,312,000 | 5,319,000 | 7,000 | SLAF6320 | 0 |
| SLAF6321 | |||||
| CM3,5_scaffold0006 | 861,000 | 875,000 | 14,000 | SLAF8215 | 2 |
| SLAF8216 | |||||
| CM3,5_scaffold0016 | 1,793,000 | 2,126,000 | 333,000 | SLAF18729 | 54 |
| SLAF18745 | |||||
| SLAF18775 | |||||
| CM3,5_scaffold0023 | 2,740,000 | 2,845,000 | 105,000 | SLAF24883 | 4 |
| SLAF24901 | |||||
| CM3,5_scaffold0045 | 1,181,000 | 1,195,000 | 14,000 | SLAF38671 | 0 |
| SLAF38677 |
Scaffold ID: scaffold number; Start: the starting position of the candidate region; End: the end position of the candidate region; Size: the size of the region, in units of bp; SLAF marker: the differential SLAF markers in the region; Gene number: the number of genes in the region. The data were obtained using the Geno_ratio.pl software.
Table 6. Association regions, SLAF markers, and number of genes related to the sour trait.
| Scaffold ID | Start | End | Size (bp) | SLAF marker | Gene number |
|---|---|---|---|---|---|
| CM3,5_scaffold00003 | 2,631,000 | 2,653,000 | 22,000 | SLAF4675 | 0 |
| SLAF4679 | |||||
| CM3,5_scaffold00003 | 3,188,000 | 3,256,000 | 68,000 | SLAF4736 | 4 |
| SLAF4745 | |||||
| CM3,5_scaffold00004 | 7,621,000 | 7,864,000 | 243,000 | SLAF6659 | 15 |
| SLAF6693 | |||||
| CM3,5_scaffold00009 | 7,143,000 | 7,243,000 | 100,000 | SLAF12456 | 2 |
| SLAF12467 | |||||
| CM3,5_scaffold00011 | 4,255,000 | 4,504,000 | 249,000 | SLAF14408 | 33 |
| SLAF14409 | |||||
| SLAF14440 | |||||
| CM3,5_scaffold00018 | 3,724,000 | 3,750,000 | 26,000 | SLAF20908 | 2 |
| SLAF20910 | |||||
| CM3,5_scaffold00018 | 4,157,000 | 4,183,000 | 26,000 | SLAF20972 | 1 |
| SLAF20979 | |||||
| CM3,5_scaffold00018 | 5,769,000 | 5,845,000 | 76,000 | SLAF21206 | 8 |
| SLAF21215 | |||||
| CM3,5_scaffold00018 | 5,874,000 | 5,947,000 | 73,000 | SLAF21222 | 4 |
| SLAF21231 | |||||
| CM3,5_scaffold00024 | 2,947,000 | 2,955,000 | 8,000 | SLAF25822 | 1 |
| SLAF25825 | |||||
| CM3,5_scaffold00032 | 4,022,000 | 4,025,000 | 3,000 | SLAF31553 | 0 |
| SLAF31554 | |||||
| CM3,5_scaffold00040 | 2,861,000 | 2,988,000 | 127,000 | SLAF36320 | 6 |
| SLAF36334 | |||||
| CM3,5_scaffold00054 | 362,000 | 438,000 | 76,000 | SLAF42241 | 2 |
| SLAF42254 | |||||
| CM3,5_scaffold00054 | 833,000 | 987,000 | 154,000 | SLAF42301 | 7 |
| SLAF42321 | |||||
| CM3,5_scaffold00054 | 1,441,000 | 1,480,000 | 39,000 | SLAF42384 | 0 |
| SLAF42394 | |||||
| CM3,5_scaffold00054 | 1,920,000 | 2,240,000 | 320,000 | SLAF42476 | 29 |
| SLAF42498 | |||||
| SLAF42509 | |||||
| CM3,5_scaffold00054 | 2,287,000 | 2,313,000 | 26,000 | SLAF42523 | 0 |
| SLAF42526 | |||||
| CM3,5_scaffold00055 | 2,323,000 | 2,397,000 | 74,000 | SLAF42926 | 5 |
| SLAF42936 | |||||
| CM3,5_scaffold00083 | 196,000 | 261,000 | 65,000 | SLAF50072 | 7 |
| SLAF50085 | |||||
| CM3,5_scaffold00088 | 141,000 | 253,000 | 112,000 | SLAF50944 | 5 |
| SLAF50974 | |||||
| CM3,5_scaffold00089 | 595,000 | 867,000 | 272,000 | SLAF51212 | 42 |
| SLAF51247 | |||||
| CM3,5_scaffold00095 | 491,000 | 496,000 | 5,000 | SLAF52032 | 0 |
| SLAF52035 | |||||
| CM3,5_scaffold00114 | 53,000 | 120,000 | 67,000 | SLAF53315 | 12 |
| SLAF53325 |
Scaffold ID: scaffold number; Start: the starting position of the candidate region; End: the end position of the candidate region; Size: the size of the region, in units of bp; SLAF marker: the differential SLAF markers in the region; Gene number: the number of genes in the region. The data were obtained using the Geno_ratio.pl software.
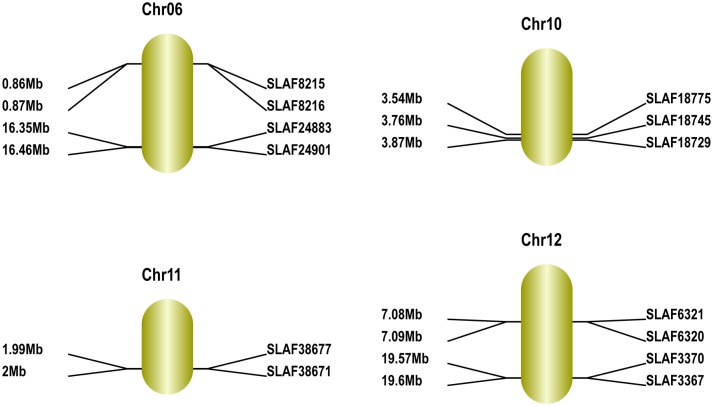
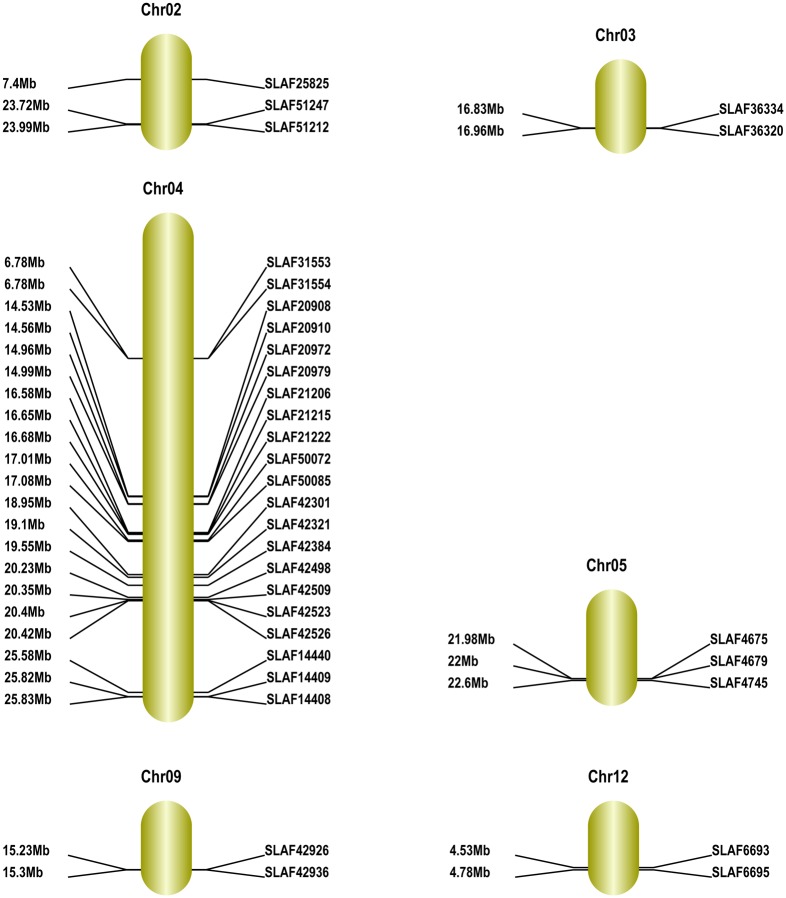
To anchor the above 13 sweet trait-related and 48 sour trait-related SLAF markers in the scaffolds to the genetic map, we performed BLAT analysis of every SLAF marker in the scaffolds against the genetic map (https://melonomics.net/genetic_map/map_set_info). We mapped the 13 sweet trait-related SLAF markers to between 0.86 and 26.46 kb on chromosome 6; 3.54 and 3.87 kb on chromosome 10; 1.99 and 2.01 kb on chromosome 11; and 7.09 and 19.60 kb on chromosome 12 (Fig 10 and Table 7). We also mapped 38 of the 48 sour trait-related SLAF markers to between 7.4 and 23.73 kb on chromosome 2; 16.84 and 16.96 kb on chromosome 3; 6.79 and 25.84 kb on chromosome 4; 21.98 and 22.6 on chromosome 5; 15.23 and 15.3 kb on chromosome 9; and 4.54 and 4.78 kb on chromosome 12 (Fig 11 and Table 8). We discarded 10 sour trait-related SLAF markers, each of which mapped to more than two different locations in the genome. We used the method described by Harel-Beja et al. [15] to measure the glucose and sucrose content (i.e. sweetness) of the melons, and the method of Cohen et al. [8] to measure the pH, citrate content and malic acid content (i.e. acidity). Based on the genetic mapping positions, we mapped sucrose QTLs, TSS QTLs and glucose QTLs to linkage groups LG2, LG3, LG4, LG5 and LG8 [14], while pH, citrate and malate QTLs were mapped to LG4, LG8, LG11 and LG12 [7,9,14,15].
Fig 10. Maps of sweet trait-related genomic regions in melon obtained using the GenticMapDrawer.pl l software.
Chromosome numbers are according to Garcia-Mas et al. [18]. Distances from the top of each chromosome are marked on the left side, and marker names are on the right side of each linkage group.
Table 7. Fine maps of sweet trait-related genomic regions in melon.
| Chr ID | SLAF_Marker | Start | End |
|---|---|---|---|
| chr06 | SLAF8215 | 861471 | 861868 |
| SLAF8216 | 874069 | 874414 | |
| SLAF24883 | 16359185 | 16359588 | |
| SLAF24901 | 16462572 | 16462949 | |
| chr10 | SLAF18729 | 3871880 | 3872260 |
| SLAF18745 | 3766227 | 3766593 | |
| SLAF18775 | 3540166 | 3540533 | |
| chr11 | SLAF38671 | 2006296 | 2006657 |
| SLAF38677 | 1993550 | 1993930 | |
| chr12 | SLAF3367 | 19603319 | 19603727 |
| SLAF3370 | 19575933 | 19576314 | |
| SLAF6320 | 7090425 | 7090799 | |
| SLAF6321 | 7085133 | 7085501 |
Fine maps obtained using Geno_ratio.pl software.
Fig 11. Maps of sour trait-related genomic regions in melon obtained using the GenticMapDrawer.pl l software.
Chromosome numbers are according to Garcia-Mas et al. [18]. Distances from the top of each chromosome are marked on the left side, and marker names are on the right side of each linkage group.
Table 8. Fine maps of sour trait-related genomic regions in melon.
| Chr ID | SLAF_Marker | Start (bp) | End (bp) |
|---|---|---|---|
| chr02 | SLAF25825 | 7403095 | 7403459 |
| SLAF51212 | 23995375 | 23995750 | |
| SLAF51247 | 23724902 | 23725285 | |
| chr03 | SLAF36320 | 16960230 | 16960636 |
| SLAF36334 | 16835196 | 16835556 | |
| chr04 | SLAF14408 | 25831909 | 25832303 |
| SLAF14409 | 25820933 | 25821305 | |
| SLAF14440 | 25583901 | 25584279 | |
| SLAF20908 | 14536504 | 14536903 | |
| SLAF20910 | 14561186 | 14561575 | |
| SLAF20972 | 14969782 | 14970159 | |
| SLAF20979 | 14994484 | 14994835 | |
| SLAF21206 | 16581184 | 16581579 | |
| SLAF21215 | 16655883 | 16656291 | |
| SLAF21222 | 16686457 | 16686842 | |
| SLAF31553 | 6787495 | 6787875 | |
| SLAF31554 | 6785956 | 6786336 | |
| SLAF42301 | 18951021 | 18951406 | |
| SLAF42321 | 19102836 | 19103188 | |
| SLAF42384 | 19558988 | 19559337 | |
| SLAF42498 | 20239883 | 20240269 | |
| SLAF42509 | 20356232 | 20356621 | |
| SLAF42523 | 20404231 | 20404628 | |
| SLAF42526 | 20428858 | 20429223 | |
| SLAF50072 | 17017737 | 17018086 | |
| SLAF50085 | 17081442 | 17081835 | |
| chr05 | SLAF4675 | 21980847 | 21981223 |
| SLAF4679 | 22001441 | 22001854 | |
| SLAF4745 | 22604484 | 22604854 | |
| chr09 | SLAF42926 | 15231134 | 15231547 |
| SLAF42936 | 15304483 | 15304845 | |
| chr12 | SLAF6659 | 4781508 | 4781871 |
| SLAF6693 | 4539737 | 4540115 |
Fine maps obtained using Geno_ratio.pl software.
Combined analysis of regions associated with sweet and sour traits and parental resequencing data
We studied the genes from the regions associated with sweet and sour traits, and found that some of the SLAF differential markers (13 sweet trait-related and 48 sour trait-related) matched the genome-wide genetic variation in the parental resequencing data. Some sweet (62) and sour (185) trait-related variations within the associated regions showed polymorphisms between the two parents, including SNPs (70, 247) and SVs (38, 106) (Table 9). Comparative analysis of SLAF markers and parental resequencing data showed that only one marker (SLAF18745), located in one gene, N-acetylglucosaminyl transferase III (MELO3C011944T1), was correlated with the sweet trait. However, seven SLAF markers located in eight genes were associated with the sour trait; these were: four uncharacterized genes (MELO3C009704T1, MELO3C009705T1, MELO3C022688T1, MELO3C026894T2); Mus musculus squamous cell carcinoma antigen 2 (Scca2) (MELO3C020002T1); cadmium-induced protein AS8-like, transcript variant 2 (MELO3C022756T1); receptor-like protein kinase-like (MELO3C025794T1); and NAC transcription factor 29-like (MELO3C026251T1). These SLAF markers for sweet and sour traits mapped to the parental resequencing data (Table 10 and S7 Table). Therefore, there was rich variation in sweet and sour trait-related genes within the two parental lines compared with DHL92.
Table 9. The polymorphic types of sweet and sour trait-related genes mapped to the parental genome.
| Sample | Sweet | Sour | ||||
|---|---|---|---|---|---|---|
| Total genes | SNP | SV | Total genes | SNP | SV | |
| Shouxing | 62 | 20 | 16 | 185 | 130 | 58 |
| Xinguowei | 62 | 50 | 22 | 185 | 117 | 48 |
Polymorphic type mapping to the parental genome was performed using stat_table.pl software.
Table 10. Sweet and sour trait-related genes mapped to the parental genome using Gene_Func_Anno_Pipline.pl software.
| SLAF marker | Gene ID | Functional genes | Associated traits |
|---|---|---|---|
| SLAF18745 | MELO3C011944T1 | N-acetylglucosaminyltransferase III | Sweet |
| SLAF14409 | MELO3C009704T1 MELO3C009705T1 | Uncharacterized | Sour |
| SLAF36334 | MELO3C020002T1 | Mus musculus squamous cell carcinoma antigen 2 (Scca2) | Sour |
| SLAF42321 | MELO3C022688T1 | Uncharacterized | Sour |
| SLAF42509 | MELO3C022756T1 | Cadmium-induced protein AS8-like, transcript variant 2 | Sour |
| SLAF50072 | MELO3C025794T1 | Receptor-like protein kinase-like | Sour |
| SLAF51212 | MELO3C026251T1 | NAC transcription factor 29-like | Sour |
| SLAF53325 | MELO3C026894T2 | Uncharacterized | Sour |
Discussion
The rapid development of sequencing technologies and bioinformatics tools has provided a starting point for unraveling the tremendous genetic diversity that occurs in the genome. Genetic variations on a genome-wide scale has been reported in several model organisms [17,29,35–37]. Techniques such as parental genome resequencing and BSA have helped identifying markers linked to genes or QTLs. These markers can be further used in the construction of genetic maps and in high-throughput genotyping polymorphisms (SSRs, SVs, or indels). We resequenced the two parental lines (Shouxing and Xinguowei) of the Fengwei melon to uncover nearly two million SNPs, indels, and SVs, and identified 1290 polymorphic genes associated with sweet and sour traits. Some of these genes are involved in metabolic pathways for sucrose, organic acids, aromas, and vitamins. Our study provides the first report on genome-wide patterns of genetic variation in melon, and will be valuable to future genotype-phenotype studies and molecular breeding.
Melon fruits accumulate various levels of soluble sugars, organic acids, vitamins, and aromatic volatiles [5], and these compounds affect fruit quality through complex networks of metabolic pathways that are active during fruit ripening. Transcriptome and gene cloning have identified the metabolic pathways for sugars that are related to sucrose accumulation in melon fruit [5]. Our results demonstrated that the two parents of Fengwei melon (Xinguowei and Shuoxing) showed polymorphisms of genes in several pathways involved in the biosynthesis of sucrose, fructose, mannose, and galactose. DNA polymorphisms in genes coding for components of these pathways may account for the differences in sweet taste between the two parents. Moreover, a transcriptome study that we have carried out has identified differential expressions of these pathways and genes in melon fruit (unpublished data).
Studies of organic acids in other fruit species have shown that the acid content of a fruit is determined by the balance between acid synthesis and degradation. The genes associated with the citrate cycle pathways have been documented to play a critical role in the accumulation of organic acids in fruits [38–44]. Our current findings reveal that the two parents showed polymorphisms of genes related to the citrate cycle pathways. DNA polymorphisms in genes involved in these pathways may contribute to the differences in sour taste between the two parents. Indeed, our transcriptome study showed differing expressions of the genes involved in the citrate cycle pathways in melon fruit (unpublished data). Recently, a pH-trait gene (CmPH) that has a major effect on fruit acidity has been cloned by map-based techniques and characterized in melon [45]. In future studies, the mechanisms of organic acid accumulation in melon fruit could be further explored by the continuous development of sour traits in melon fruit, and research into comparative genomics and transcription in fruits of other species.
The lipoxygenase family of genes governs fruit aroma, which is an important trait contributing to fruit quality [46]. The release of aromatic substances signifies the maturity of the melon fruit. Aromatic substances are closely associated with the health and nutrition of humans and are indices for evaluating melon fruit quality. We identified genes annotated as encoding members of the lipoxygenase family in the two parental lines, including genes that play roles in the ripening and aging processes in melon fruit such as ethylene synthesis, after-ripening, softening, and aroma formation [47,48]. We also identified genes encoding the alcohol dehydrogenase family that participates in ethylene signal transduction and the biosynthesis of aromatic substances [49–51], cadinene synthase that catalyzes farnesyl pyrophosphate cyclization to form (+)-δ-cadinene [52], and genes involved in the synthesis of linalool derivatives or the nerolidol synthase of the linalool monomer [53]. We also identified polymorphic genes in Xinguowei that were annotated in the metabolic pathways for valine, leucine, isoleucine, nicotinate, and nicotinamide. Valine, leucine, and isoleucine are precursors involved in the synthesis of most branched ester aromatic substances [54,55]. DNA polymorphisms in genes associated with the above pathways may also contribute to differences in taste between the two parents. Our transcriptome study also demonstrated differing expressions of these pathways in melon fruit (unpublished data).
Sherman et al. [56] combined BSA and microarrays to map the pH trait to chromosome 8 in melon. Although Harel-Beja et al. [15] measured the sweetness in melons with respect to glucose and sucrose content, none of their experiments overlapped with ours. We mapped pH and acidity (i.e. sourness) traits to chromosome 12 (LG12), as also reported in a previous study by Cohen et al. [8]. We attribute the differences in the mapping data between our work and previous studies to the different accessions used. Compared with ‘Dulce’ and ‘PI414723’, the Hami melon inbred lines Shouxing and Guowei (sour-taste Hami melon lines bred from high-dose Co60 γ-ray irradiation) may have different genes related to sweet and sour traits. Some of the crucial fruit quality traits such as flavor, aroma, and vitamin content, have not received enough attention. The polymorphic genes annotated in our study provide abundant resources for research concerning the molecular mechanisms associated with melon fruit traits.
Takagi et al. [57] used BSA in combination with high-throughput sequencing technologies, including QTL-seq and BSR-seq, to fine-map partial resistance to fungal rice blast disease and seedling vigor trait in rice. Trick et al. [58] used BSA and high-throughput sequencing to map Gpc-B1, a wheat quantitative trait locus associated with an increased grain content of protein, zinc, iron, and gl3, while Liu et al. [59] mapped the phenotypic mutants of maize using these techniques. We combined SLAF-seq and super-BSA to identify rapidly the genomic regions associated with sweet and sour traits, using members of the F2 population with extreme phenotypes.
The success of fine mapping the sweet and sour traits using the super-BSA technology provides strong technical support for its future application. In this method, high-density scanning of 10,000+ SNPs on large-scale bulk pools generated a massive amount of sequencing information that covered the whole genome. We compared the difference in the frequency of occurrence of different genes marked by a SNP in the two bulk pools and determined the molecular markers and fine mapping regions closely correlated with the traits. Thus, we directly used the sequencing results for molecular marker development. Moreover, our research provides a convenient way to develop trait-related functional molecular markers for molecular marker-assisted breeding.
Methods combining the efficiency of genome-wide variation mining and genomic mapping, including resequencing, super-BSA, QTL-seq [57], and BSR-seq [58,59], will dramatically accelerate crop improvement in a cost-effective manner. The technologies that take full advantage of the rapidly declining cost of genome sequencing are expected to contribute to the on-going efforts aimed at addressing the world food security problem by reducing breeding time.
Supporting Information
(XLSX)
(XLSX)
(XLSX)
(XLSX)
(XLS)
(XLS)
(XLS)
Data Availability
All relevant data are within the paper and its Supporting Information files.
Funding Statement
This research was supported by the National Natural Science Foundation of China (31160395, http://www.nsfc.gov.cn), the postdoctoral program (131620, http://res.chinapostdoctor.org.cn/BshWeb/index.shtml) and the Key Laboratory of Crop Biotechnology, Xinjiang Uighur Autonomous Region, China (XJYS03022011-01) to HZ. The funders had no role in study design, data collection and analysis, decision to publish, or preparation of the manuscript.
References
- 1.Pitrat M, Hanelt P, Hammer K. Some comments on intraspecific classification of cultivars of melon. Acta Hortic. 2000; 510: 29–36. [Google Scholar]
- 2.Yamaguchi M, Hughes DL, Yabumoto K, Jennings WG. Quality of cantaloupe muskmelons: variability and attributes. Sci Hortic. 1977; 6: 59–64. [Google Scholar]
- 3.Burger Y, Schaffer AA. The contribution of sucrose metabolism enzymes to sucrose accumulation in Cucumis melo. J Am Soc Hortic Sci. 2007; 132: 704–712. [Google Scholar]
- 4.Schaffer AA, Madore M, Pharr DM. Cucurbits In: Zamski E, Schaffer AA, editors. Photoassimilate distribution in plants and crops. edn. New York: Marcel Dekker; 1996. [Google Scholar]
- 5.Dai N, Cohen S, Portnoy V, Tzuri G, Harel-Beja R, Pompan-Lotan M, et al. Metabolism of soluble sugars in developing melon fruit: a global transcriptional view of the metabolic transition to sucrose accumulation. Plant Mol Biol. 2011; 76: 1–18. 10.1007/s11103-011-9757-1 [DOI] [PubMed] [Google Scholar]
- 6.Wang YM, Wyllie SG, Leach DN. Chemical changes during the development and ripening of the fruit of Cucumis melo (Cv. Mak-dimon). J Agric Food Chem. 1996; 44: 210–216. [Google Scholar]
- 7.Zhu HQ, Fu QS, Zhang XY, Lv LH, Wi HP, Wang HS. Genetic analysis of sourness-associated traits in melon (Cucumis melo L.). China Vegetables. 2013; 18: 29–34. [Google Scholar]
- 8.Cohen S, Tzuri G, Harel-Beja R, Itkin M, Portnoy V, Sa'ar U. Co-mapping studies of QTLs for fruit acidity and candidate genes of organic acid metabolism and proton transport in sweet melon (Cucumis melo L.). Theor Appl Genet. 2012; 126: 349–358. [DOI] [PubMed] [Google Scholar]
- 9.Burger Y, Paris HS, Cohen R, Katzir N, Tadmor Y, Lewinsohn E. Genetic diversity of Cucumis melo. Hortic Rev. 2009; 36: 165–198. [Google Scholar]
- 10.Danin-Poleg Y, Tadmor Y, Tzuri G, Reis N, Hirschberg J, Katzir N. Construction of a genetic map of melon with molecular markers and horticultural traits, and localization of genes associated with ZYMV resistance. Euphytica. 2002; 125: 373–384. [Google Scholar]
- 11.Kubicki B. Inheritance of some characters in muskmelons (Cucumis melo). Genet Pol. 1962; 3: 265–274. [Google Scholar]
- 12.Burger Y, Sa'ar U, Distelfeld A, Katzir N, Yeselson Y, Shen S. Development of sweet melon (Cucumis melo) genotypes combining high sucrose and organic acid content. J Am Soc Hortic Sci. 2003; 128: 537–540. [Google Scholar]
- 13.Wu MZ, Yi HP, Feng JX, Wang DM. The effect investigation of Xinjiang muskmelon irradiation breeding. China Watermelon Muskmelon. 2005; 1: 1–3. [Google Scholar]
- 14.Yi HP, Wu MZ, Feng JX, Zhang YB. Advances in genetic improvement of Hami melon in Xinjiang, China. Acta Hortic Sin. 2013; 40: 1779–1782. [Google Scholar]
- 15.Harel-Beja R, Tzuri G, Portnoy V, Lotan-Pompan M, Lev S, Cohen S, et al. A genetic map of melon highly enriched with fruit quality QTLs and EST markers, including sugar and carotenoid metabolism genes. Theor Appl Genet. 2010; 121: 511–533. 10.1007/s00122-010-1327-4 [DOI] [PubMed] [Google Scholar]
- 16.Diaz A, Fergany M, Formisano G, Ziarsolo P, Blanca J, Fei Z, et al. A consensus linkage map for molecular markers and quantitative trait loci associated with economically important traits in melon (Cucumis melo L.). BMC Plant Biol. 2011; 11: 111 10.1186/1471-2229-11-111 [DOI] [PMC free article] [PubMed] [Google Scholar]
- 17.Zheng LY, Guo XS, He B, Sun LJ, Peng Y, Dong SS. Genome-wide patterns of genetic variation in sweet and grain sorghum (Sorghum bicolor). Genome Biol. 2011; 12: 1–14. [DOI] [PMC free article] [PubMed] [Google Scholar]
- 18.Garcia-Mas J, Benjak A, Sanseverino W, Bourgeois M, Mir G, Gonzalez VM, et al. The genome of melon (Cucumis melo L.). Proc Natl Acad Sci U S A. 2012; 109: 11872–11877. 10.1073/pnas.1205415109 [DOI] [PMC free article] [PubMed] [Google Scholar]
- 19.Blanca J, Canizares J, Ziarsolo P, Esteras C, Mir G, Nuez F. Melon transcriptome characterization. SSRs and SNPs discovery for high throughput genotyping across the species. Plant Genome. 2011; 4: 118–131. [Google Scholar]
- 20.Michelmore RW, Paran I, Kesseli RV. Identification of markers linked to disease-resistance genes by bulked segregant analysis: a rapid method to detect markers in specific genomic regions by using segregating populations. Proc Natl Acad Sci U S A. 1991; 88: 9828–9832. [DOI] [PMC free article] [PubMed] [Google Scholar]
- 21.Wenger JW, Schwartz K, Sherlock G. Bulk segregant analysis by high-throughput sequencing reveals a novel xylose utilization gene from Saccharomyces cerevisiae. PLoS Genet. 2010; 6: e1000942 10.1371/journal.pgen.1000942 [DOI] [PMC free article] [PubMed] [Google Scholar]
- 22.Baird NA, Etter PD, Atwood TS, Currey MC, Shiver AL, Lewis ZA, et al. Rapid SNP discovery and genetic mapping using sequenced RAD markers. PLoS One. 2008; 3: e3376 10.1371/journal.pone.0003376 [DOI] [PMC free article] [PubMed] [Google Scholar]
- 23.Sun X, Liu D, Zhang X, Li W, Liu H, Hong W, et al. SLAF-seq: an efficient method of large-scale de novo SNP discovery and genotyping using high-throughput sequencing. PLoS One. 2013; 8: e58700 10.1371/journal.pone.0058700 [DOI] [PMC free article] [PubMed] [Google Scholar]
- 24.Murray MG. Rapid isolation of high molecular weight plant DNA. Nucleic Acids Res. 1980; 8: 668–673. [DOI] [PMC free article] [PubMed] [Google Scholar]
- 25.Li H, Durbin R. Fast and accurate short read alignment with Burrows-Wheeler transform. Bioinformatics. 2009; 25: 1754–1760. 10.1093/bioinformatics/btp324 [DOI] [PMC free article] [PubMed] [Google Scholar]
- 26.Li H, Handsaker B, Wysoker A, Fennell T, Ruan J, Homer N, et al. The Sequence Alignment/Map format and SAMtools. Bioinformatics. 2009; 25: 2078–2079. 10.1093/bioinformatics/btp352 [DOI] [PMC free article] [PubMed] [Google Scholar]
- 27.Ye K, Schulz MH, Long Q, Apweiler R, Ning Z. Pindel: a pattern growth approach to detect break points of large deletions and medium sized insertions from paired-end short reads. Bioinformatics. 2009; 25: 2865–2871. 10.1093/bioinformatics/btp394 [DOI] [PMC free article] [PubMed] [Google Scholar]
- 28.Chen K, Wallis JW, McLellan MD, Larson DE, Kalicki JM, Pohl CS, et al. BreakDancer: an algorithm for high-resolution mapping of genomic structural variation. Nat Methods. 2009; 6: 677–681. 10.1038/nmeth.1363 [DOI] [PMC free article] [PubMed] [Google Scholar]
- 29.Bai H, Cao Y, Quan J, Dong L, Li Z, Zhu Y, et al. Identifying the genome-wide sequence variations and developing new molecular markers for genetics research by re-sequencing a Landrace cultivar of foxtail millet. PLoS One. 2013; 8: e73514 10.1371/journal.pone.0073514 [DOI] [PMC free article] [PubMed] [Google Scholar]
- 30.Birney E, Clamp M, Durbin R. GeneWise and Genomewise. Genome Res. 2004; 14: 988–995. [DOI] [PMC free article] [PubMed] [Google Scholar]
- 31.Kent WJ. BLAT—the BLAST-like alignment tool. Genome Res. 2002; 12: 656–664. [DOI] [PMC free article] [PubMed] [Google Scholar]
- 32.Xia CB, Chen LJ, Rong T, Li R. Identification of a new maize inflorescence meristem mutant and association analysis using SLAF-seq method. Euphytica. 2015; 202: 35–44. [Google Scholar]
- 33.Xu X, Lu L, Zhu B, Xu Q, Qi X, Chen X. QTL mapping of cucumber fruit flesh thickness by SLAF-seq. Sci Rep. 2015; 5: 15829 10.1038/srep15829 [DOI] [PMC free article] [PubMed] [Google Scholar]
- 34.Zhang Y, Wang L, Xin H, Li D, Ma C, Ding X, et al. Construction of a high-density genetic map for sesame based on large scale marker development by specific length amplified fragment (SLAF) sequencing. BMC Plant Biol. 2013; 13: 141 10.1186/1471-2229-13-141 [DOI] [PMC free article] [PubMed] [Google Scholar]
- 35.Feltus FA, Wan J, Schulze SR, Estill JC, Jiang N, Paterson AH. An SNP resource for rice genetics and breeding based on subspecies indica and japonica genome alignments. Genome Res. 2004; 14: 1812–1819. [DOI] [PMC free article] [PubMed] [Google Scholar]
- 36.McNally KL, Childs KL, Bohnert R, Davidson RM, Zhao K, Ulat VJ, et al. Genomewide SNP variation reveals relationships among landraces and modern varieties of rice. Proc Natl Acad Sci U S A. 2009; 106: 12273–12278. 10.1073/pnas.0900992106 [DOI] [PMC free article] [PubMed] [Google Scholar]
- 37.Frazer KA, Eskin E, Kang HM, Bogue MA, Hinds DA, Beilharz EJ, et al. A sequence-based variation map of 8.27 million SNPs in inbred mouse strains. Nature. 2007; 448: 1050–1053. [DOI] [PubMed] [Google Scholar]
- 38.Moing A, Rothan C, Svanella L, Just D, Diakou P, Raymond P. Role of phosphoenolpyruvate carboxylase in organic acid accumulation during peach fruit development. Physiol Plant. 2000; 108: 1–10. [Google Scholar]
- 39.Saradhuldhat P, Paull RE. Pineapple organic acid metabolism and accumulation during fruit development. Scientia Horticulturae. 2007; 112: 297–303. [Google Scholar]
- 40.Sadka A, Dahan E, Cohen L, Marsh KB. Aconitase activity and expression during the development of lemon fruit. Physiol Plant. 2000; 2000: 3. [Google Scholar]
- 41.Sadka A, Dahan E, Or E, Cohen L. NADP+-isocitrate dehydrogenase gene expression and isozyme activity during citrus fruit development. Plant Science. 2000; 158: 173–181. [DOI] [PubMed] [Google Scholar]
- 42.Sadka A, Dahan E, Or E, Roose ML, Marsh KB, Cohen L. Comparative analysis of mitochondrial citrate synthase gene structure, transcript level and enzymatic activity in acidless and acid-containing Citrus varieties. Funct Plant Biol. 2001; 28: 383–390. [Google Scholar]
- 43.Taureilles-Saurel C, Romieu CG, Robin JP, Flanzy C. Grape (Vitis vinifera L.) malate dehydrogenase. II. Characterization of the major mitochondrial and cytosolic isoforms and their role in ripening. Am J Enol Vitic. 1995; 46: 29–36. [Google Scholar]
- 44.Iannetta PP, Escobar NM, Ross HA, Souleyre EJ, Hancock RD, Witte CP. Identification, cloning and expression analysis of strawberry (Fragaria× ananassa) mitochondrial citrate synthase and mitochondrial malate dehydrogenase. Physiol Plant. 2004; 121: 15–26. [DOI] [PubMed] [Google Scholar]
- 45.Cohen S, Itkin M, Yeselson Y, Tzuri G, Portnoy V, Harel-Baja R, et al. The PH gene determines fruit acidity and contributes to the evolution of sweet melons. Nat Commun. 2014; 5: 4026 10.1038/ncomms5026 [DOI] [PubMed] [Google Scholar]
- 46.Li M, Li L, Dunwell JM, Qiao X, Liu X, Zhang S. Characterization of the lipoxygenase (LOX) gene family in the Chinese white pear (Pyrus bretschneideri) and comparison with other members of the Rosaceae. BMC Genomics. 2014; 15: 444 10.1186/1471-2164-15-444 [DOI] [PMC free article] [PubMed] [Google Scholar]
- 47.Zhang B, Li X, Chen KS. Physiological and molecular features of lipoxygenase gene family members in ripening fruit. Acta Hortic Sin. 2007; 34: 245–250. [Google Scholar]
- 48.Leone A, Bleve-Zacheo T, Gerardi C, Melillo MT, Leo L, Zacheo G. Lipoxygenase involvement in ripening strawberry. J Agric Food Chem. 2006; 54: 6835–6844. [DOI] [PubMed] [Google Scholar]
- 49.Lucchetta L, Manriquez D, El-Sharkawy I, Flores FB, Sanchez-Bel P, Zouine M, et al. Biochemical and catalytic properties of three recombinant alcohol acyltransferases of melon. sulfur-containing ester formation, regulatory role of CoA-SH in activity, and sequence elements conferring substrate preference. J Agric Food Chem. 2007; 55: 5213–5220. [DOI] [PubMed] [Google Scholar]
- 50.Manriquez D, El-Sharkawy I, Flores FB, El-Yahyaoui F, Regad F, Bouzayen M, et al. Two highly divergent alcohol dehydrogenases of melon exhibit fruit ripening-specific expression and distinct biochemical characteristics. Plant Mol Biol. 2006; 61: 675–685. [DOI] [PubMed] [Google Scholar]
- 51.Tang GM. Studies on volatile components and metabolism of Muskmelon (Cucumis melo L) during fruit development. In, Shandong Agricultural University; 2008. [Google Scholar]
- 52.Zhou T. Cloning and expression analysis of cotton GhCdn gene. In, Chinese Academy of Agricultural Sciences Dissertation; 2011. [Google Scholar]
- 53.Liu RR. Advances in genetic modification of plant secondary metabolism. Biotechnology Bulletin. 2008; 6: 10–13. [Google Scholar]
- 54.Rowan DD, Lane HP, Allen JM, Fielder S, Hunt MB. Biosynthesis of 2-methylbutyl, 2-methyl-2-butenyl, and 2-methylbutanoate esters in Red Delicious and Granny Smith apples using deuterium-labeled substrates. J Agric Food Chem. 1996; 44: 3276–3285. [Google Scholar]
- 55.Wyllie SG, Fellman JK. Formation of volatile branched chain esters in bananas (Musa sapientum L.). J Agric Food Chem. 2000; 48: 3493–3496. [DOI] [PubMed] [Google Scholar]
- 56.Sherman A, Eshed R, Harel-Beja R, Tzuri G, Portnoy V, Cohen S, et al. Combining bulk segregation analysis and microarrays for mapping of the pH trait in melon. Theor Appl Genet. 2013; 126: 349–358. 10.1007/s00122-012-1983-7 [DOI] [PubMed] [Google Scholar]
- 57.Takagi H, Abe A, Yoshida K, Kosugi S, Natsume S, Mitsuoka C, et al. QTL-seq: rapid mapping of quantitative trait loci in rice by whole genome resequencing of DNA from two bulked populations. Plant J. 2013; 74: 174–183. 10.1111/tpj.12105 [DOI] [PubMed] [Google Scholar]
- 58.Trick M, Adamski NM, Mugford SG, Jiang CC, Febrer M, Uauy C. Combining SNP discovery from next-generation sequencing data with bulked segregant analysis (BSA) to fine-map genes in polyploid wheat. BMC Plant Biol. 2012; 12: 14 10.1186/1471-2229-12-14 [DOI] [PMC free article] [PubMed] [Google Scholar]
- 59.Liu S, Yeh CT, Tang HM, Nettleton D, Schnable PS. Gene mapping via bulked segregant RNA-Seq (BSR-Seq). PLoS One. 2012; 7: e36406 10.1371/journal.pone.0036406 [DOI] [PMC free article] [PubMed] [Google Scholar]
Associated Data
This section collects any data citations, data availability statements, or supplementary materials included in this article.
Supplementary Materials
(XLSX)
(XLSX)
(XLSX)
(XLSX)
(XLS)
(XLS)
(XLS)
Data Availability Statement
All relevant data are within the paper and its Supporting Information files.


