. 2016 Jan 25;5:e11050. doi: 10.7554/eLife.11050

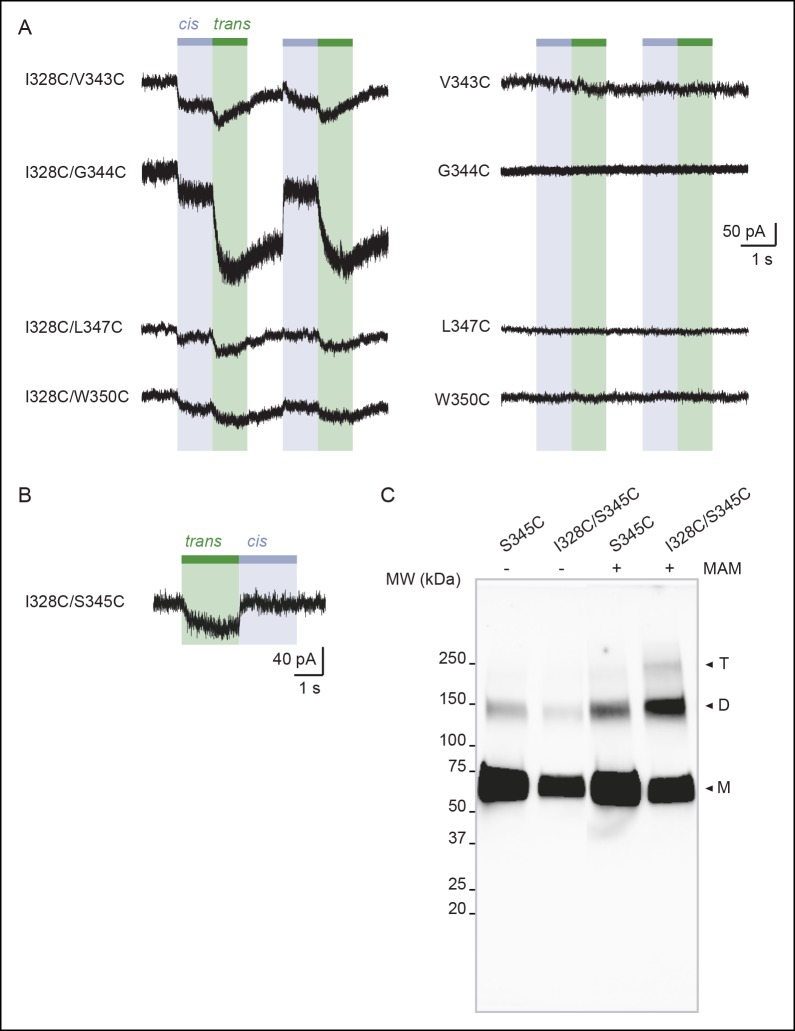
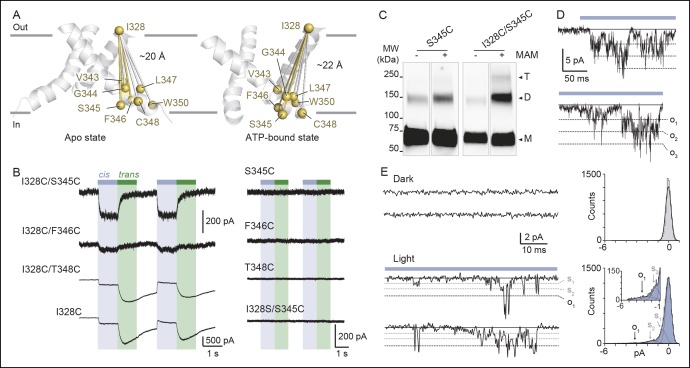
Figure 3. Shortening of the vertical distance separating adjacent TM2 ends drives channel openings.

(A) Side views of TM2 helices of a P2X2 homology model in the apo state (left) and ATP-bound state (right). The β-atoms of residues selected for cysteine substitutions are shown as yellow spheres. Indicated values are the average distances separating pairwise β-atoms from two adjacent TM2 helices (grey bridges). Highlighted bridges between residues indicate actual MAM cross-linking. For clarity, TM1 helices are omitted. (B) Whole-cell currents evoked by light at 365 nm (cis) or 525 nm (trans) in HEK cells expressing the indicated cysteine-substituted mutants treated with MAM. (C) Western blot analysis of cell-surface cross-linking of the indicated mutated subunits expressed in TSA-201 cells after treatment (+) or without treatment (-) with MAM. Monomer (M), dimer (D), and trimer (T) are indicated. Uncut gel image is shown in Figure 3—figure supplement 1C. MW, Molecular weight. (D) Single-channel currents recorded from an outside-out patch expressing the I328C/S345C mutant at -120 mV in response to 365 nm illumination. Three simultaneous openings (O) indicated by dashed black lines were detected. Black lines indicate closed channels. (E) Unitary currents (left) and corresponding all-points histograms (right) recorded before (upper) and during 365 nm illumination (lower) from the same patch expressing the I328C/S345C mutant. Sublevel openings (S1 and S2) are indicated by dotted gray lines. Inset shows expanded scale. All-points histograms were fitted to one Gaussian (upper) or to the sum of four Gaussians (lower).

DOI: http://dx.doi.org/10.7554/eLife.11050.020

Figure 3.

Figure 3—figure supplement 1. Vertical screening identifies a shortening of the distance separating adjacent TM2 ends during activation.

Figure 3—figure supplement 1.

(A) Whole-cell currents evoked by light at 365 nm (cis) or 525 nm (trans) in cells expressing the indicated cysteine-substituted mutants treated with MAM. (B) Whole-cell current evoked by light at 525 nm (trans) in a cell expressing the indicated cysteine-substituted mutant treated with MAS. (C) Uncut gel image of cross-linked P2X2-3T subunits from Figure 3B. MAM: 4,4´-bis(maleimido-glycine)azobenzene. MAS: 4-(maleimido-glycine)-4'-(succimido-glycine)azobenzene.
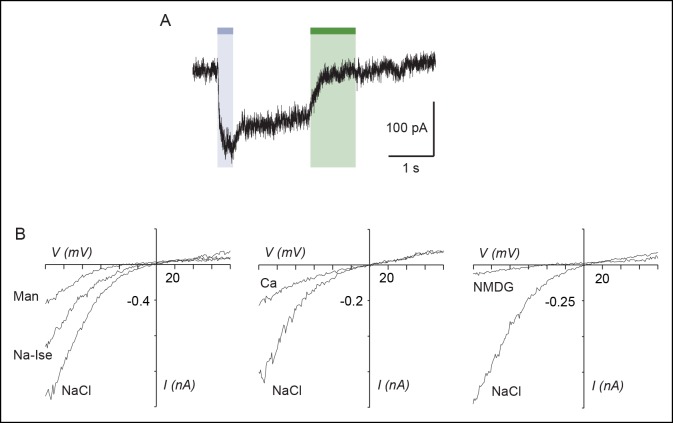
Figure 3—figure supplement 2. Biophysical properties of the I328C/S345C mutant.

Figure 3—figure supplement 2.

(A) Whole-cell current recorded in the dark after illumination at 365 nm and 525 nm in a cell expressing the I328C/S345C mutant. (B) Current-voltage curves recorded in different extracellular solutions (Man, mannitol; Na-Ise, sodium isethionate; Ca, calcium; NaCl symmetrical NaCl external solution; NMDG, N-methyl-D-glucamine). Light-gated currents were obtained after subtracting photocurrents recorded at 365 nm light to those obtained in the dark after switching to 525 nm light.
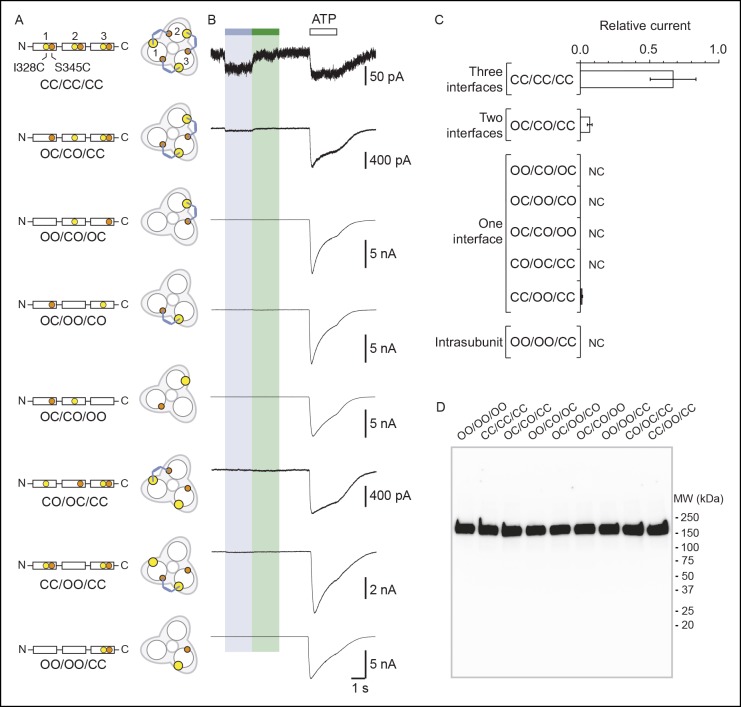
Figure 3—figure supplement 3. Concatenated P2X2-3T receptors are gated by UV light with only two cross-linked MAM.

Figure 3—figure supplement 3.

(A) Schematic representation of the trimeric P2X2-3T concatemers containing a wild-type subunit and/or a mutated subunit at I328 (yellow spheres) and/or at S345 (orange spheres). C and O indicate cysteine mutation and wild-type residue, respectively. The expected locations of cis-MAM cross-linking (colored stick) within the concatenated trimeric receptor are also indicated. (B) Whole-cell currents recorded from TSA-201 cells expressing the concatenated trimeric P2X2-3T receptors (indicated in panel A) following light switching and ATP application (100 μM, saturating as determined from controls in which current amplitudes evoked by 300 μM ATP were similar to those evoked by 100 μM ATP). Actual light-gated current amplitudes were 3.0 ± 1.5 for CC/CC/CC and 3.8 ± 1.5 pA/pF for OC/CO/CC (n = 4–6 cells). (C) Bar plot summarizing the ratio between light (365 nm)-gated currents and ATP-gated currents (n = 4–6 cells; mean ± s.e.m.) for the indicated concatemers. NC stands for no current. (D) Western blot analysis from SDS/PAGE of concatenated P2X2-T receptors shows the presence of a predominant protein expressed at the surface of TSA-201 cells that had a molecular weight corresponding to that of a trimer. Concatemer that contained wild-type residues in the first, second and third subunits is depicted OO/OO/OO. MW, Molecular weight; MAM: 4,4´-bis(maleimido-glycine)azobenzene.