. 2016 Jan 26;5:e11473. doi: 10.7554/eLife.11473

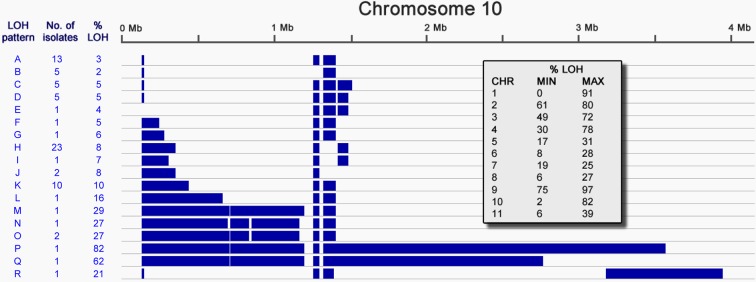
Figure 2. Loss of heterozygosity on chromosome 10.

Loss of heterozygosity regions (blue) spanning Chromosome 10 show 18 different patterns (A-R). The number of isolates possessing each pattern and the percentage of the chromosome affected are indicated. The table (inset) shows the extent of LOH (min and max) for each chromosome as a percentage of chromosome length.

DOI: http://dx.doi.org/10.7554/eLife.11473.011

Figure 2.

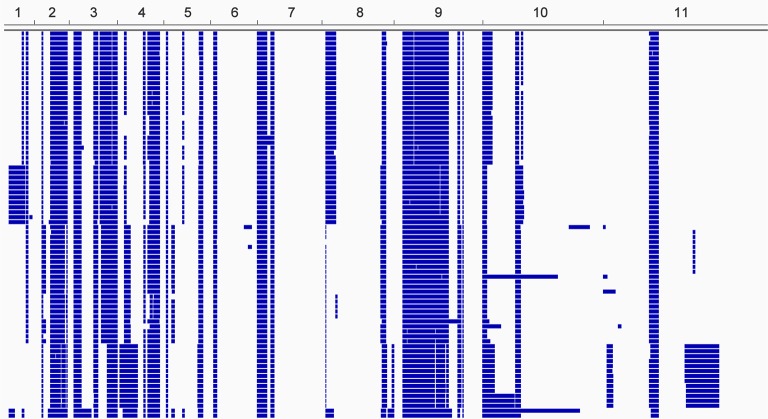
Figure 2—figure supplement 1. Loss of heterozygosity across the T.b. gambiense Group 1 genome.

Figure 2—figure supplement 1.

Every T.b. gambiense Group 1 isolate (first column) was analysed for loss of heterozygosity (LOH-see Materials and methods). Blocks of LOH are shown in blue across each of the eleven chromosomes, as indicated.

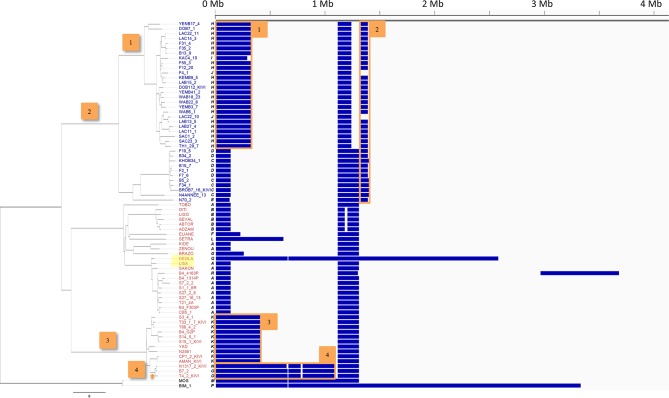
Figure 2—figure supplement 2. Loss of heterozygosity across chromosome 10.

Figure 2—figure supplement 2.

Every T.b. gambiense Group 1 isolate was analysed for loss of heterozygosity (LOH). Blocks of LOH across chromosome 10 (horizontal scale) are shown in blue. Eighteen different patterns (A-R) are evident and the phylogenetic tree is shown on the left. Patterns of LOH can be seen to cluster in agreement with the tree, clearly showing that a stable LOH profile may be inherited. A selection of inherited blocks of LOH together with the branch on which they emerge are marked 1–4. In addition, very recent LOH events can be observed, for example the large LOH region in ‘DEOLA’, which is not observed in its close relative ‘LISA’, highlighted in yellow.