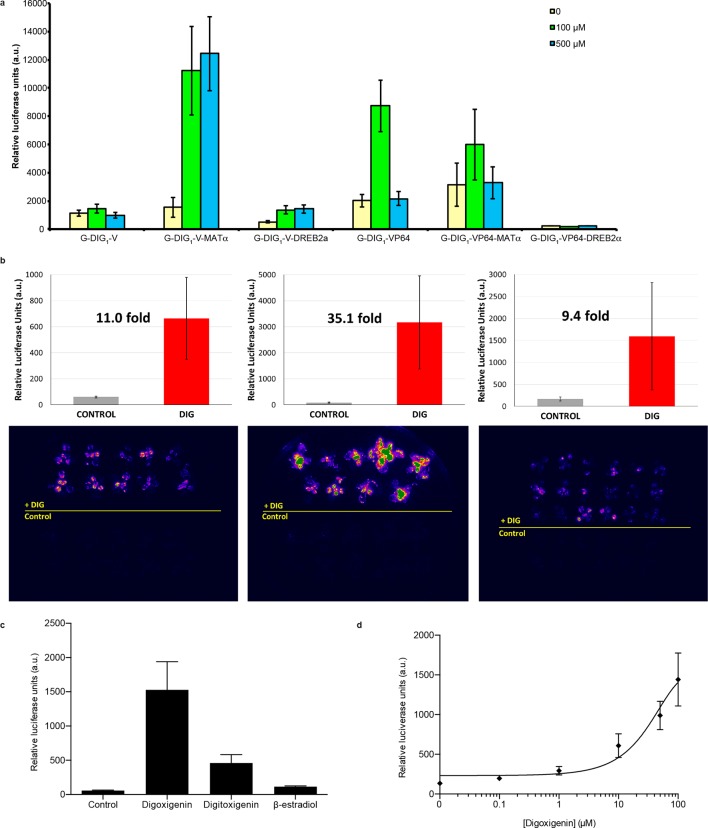
(a) Test of DIG1 variants engineered for plant function in Arabidopsis protoplasts. Two transcriptional activation domains, VP16 (V) and VP64 (VP64), as well as two degrons, yeast MATα2 and Arabidopsis DREB2a, were added to DTF-1 (G-DIG1), and the proteins were constitutively expressed from the CaMV35S promoter. The Gal4-activated pUAS promoter controls expression of a luciferase reporter. Transformed protoplasts were incubated with digoxigenin at 0, 100, and 500 μM for 16 hr. (b) Digoxigenin-dependent activation of luciferase expression in three independent transgenic Arabidopsis lines. Plants were incubated in the absence (Control) or presence (DIG) of 100 μM digoxigenin for 42 hr and imaged. Quantification of luciferase expression is presented as mean relative luciferase units ± s.d. of ten plants. (c) Specificity of luciferase activation in transgenic Arabidopsis plants. All inducers were tested at 100 μM concentration. DIG, digoxigenin; DIGT, digitoxigenin; β-EST, β-Estradiol. Data are presented as mean fold activation relative to the control ± s.e.m. of ten technical replicates. (d) Digoxigenin dose response curve in transgenic Arabidopsis plants. Concentrations are expressed in micromolar. The data are presented as mean fold induction relative to the control ± s.e.m. of ten biological replicates.


