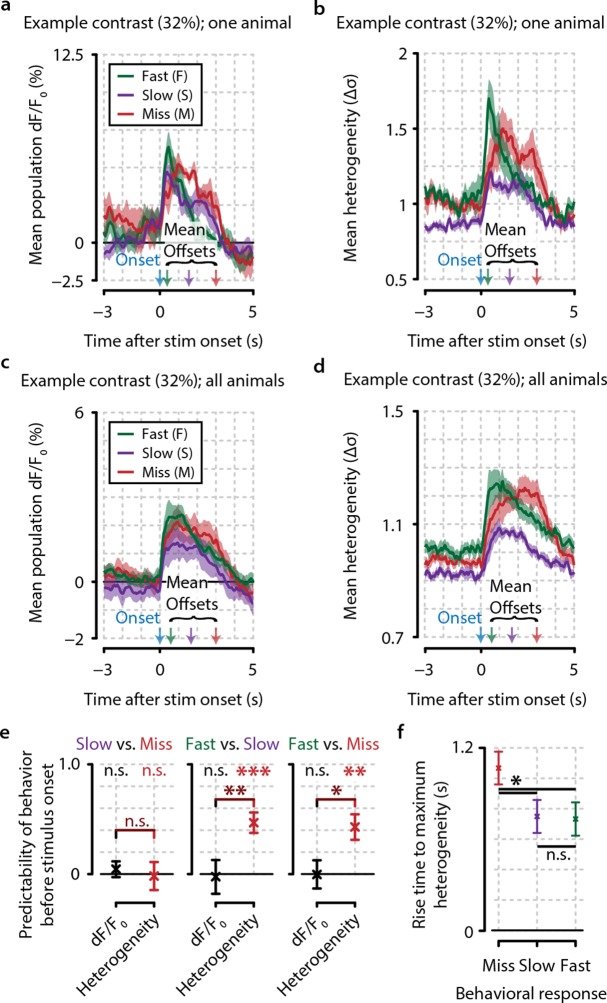
Figure 5. Heterogeneity preceding stimulus onset predicts behavioral reaction time.
(a, b) Example traces from one example animal for population dF/F0 (a) and heterogeneity (b) of fast (F, green), slow (S, purple), and miss (M, red) responses (mean ± standard error over trials) also showing mean stimulus offsets. (c, d) As (a, b) but showing mean ± standard error over animals. (e) Fast behavioral responses are predictable before stimulus onset using heterogeneity [FDR-corrected one-sample t-tests vs. chance level (0); S–M, p=0.799; F–S, p<0.001; F–M, p<0.01] but not using dF/F0 (FDR-corrected one-sample t-tests vs. chance level; S–M, p=0.157; F–S, p=0.811; F–M, p=0.924; FDR-corrected paired t-test for heterogeneity vs. dF/F0; S–M, p=0.477; S–F, p<0.01; F–M, p<0.05). (f) The population heterogeneity during stimulus presentation does not merely reflect a continuation of pre-stimulus neural state; detected stimuli (slow and fast responses) elicit a faster rise to the maximum heterogeneity level than undetected stimuli (miss trials) (paired t-tests, n=8 animals, p<0.05). Slow and fast responses do not differ significantly (p>0.05). All panels: error bars/shaded areas indicate standard error of the mean. Statistical significance: *p<0.05; **p<0.01; ***p<0.001.


