Summary
Single particle cryo-EM typically discards close-packed particle images as unusable data. Here, we report an image processing strategy and case study of obtaining near-atomic resolution 3-D reconstructions from close-packed particles. Multiple independent de novo initial models were constructed to determine and cross-validate the particle parameters. The particles with consistent views were further refined including not only Euler angles and center positions but also defocus, astigmatism, beam tilt, overall and anisotropic magnification. We demonstrated this strategy with a 2.9 Å resolution reconstruction of a 1.67 MDa virus-like particle of a circovirus, PCV2, recorded on 86 photographic films. The map resolution was further validated with phase randomization test, local resolution assessment, and the atomic model was validated with MolProbility and EMRinger. Close-packed virus particles were thus shown here not only useful for high-resolution 3-D reconstructions but also allow data collection at significantly improved throughput for near-atomic resolution reconstructions.
Keywords: single particle cryo-EM, de novo initial model, consensus criterion, gold-standard FSC, true FSC, cross-validation
Graphical abstract
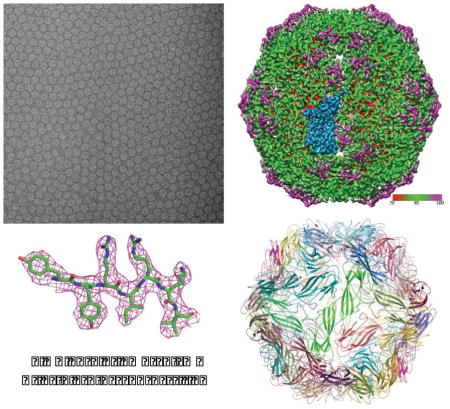
Liu et al. develop an image processing strategy for single particle cryo-EM images of close-packed virus particles. This strategy was used to achieve a 2.9 Å resolution reconstruction of a 1.67 MDa virus-like particle of a circovirus, PCV2, recorded on 86 photographic films in 8 hours.
Introduction
Single-particle electron cryomicroscopy (cryo-EM) has become a powerful method to determine structure of large macromolecular complexes and viruses, which are often not readily accessible to X-ray crystallography and nuclear magnetic resonance spectroscopy. Tremendous progresses have been made in recent years on improving the reconstructions to near-atomic resolutions (2–4 Å) at which atomic models can be reliably built (Amunts et al., 2014; Bartesaghi et al., 2015; Campbell et al., 2015; Grant and Grigorieff, 2015b; Grigorieff and Harrison, 2011; Jiang et al., 2008; Li et al., 2013; Liao et al., 2013; Ludtke et al., 2008; Zhang et al., 2010; Zhang et al., 2008; Zhou, 2011). To overcome the high level of noise in cryo-EM images, a large amount of data (104–105 particles) is a prerequisite. Current blotting method for sample grid preparation is known for its poor control of particle density and distribution. For example, particles are often seen clustered around the edge of grid holes. Close-packed particles, though often encountered, are generally considered unusable for 3-D reconstructions especially for high-resolution targets due to the interferences in determination of particle views and the fringes of contrast transfer function (CTF) from neighboring particles (Frank, 2006). Some image processing methods also implicitly assume that the particles are disperse with sufficient background area for estimation of CTF parameters (Tang et al., 2007). There are also concerns on the view distribution constrained by interactions among neighboring particles.
Porcine circovirus 2 (PCV2) is a non-enveloped single-stranded DNA virus of the Cicroviridae family. With a 1.7 kb genome and ~19 nm in diameter, PCV2 is one of the smallest spherical viruses (Crowther et al., 2003; Finsterbusch and Mankertz, 2009; Khayat et al., 2011). Its sole capsid protein (233 a.a.), encoded by the open reading frame 2, could self-assemble into virus-like particles (VLP) of T=1 icosahedral morphology similar to that of native PCV2 virions (Liu et al., 2008). Since its mass (~1.67 MDa) and size (~19 nm) is much smaller than virus structures previously determined at near-atomic resolutions by cryo-EM (Grigorieff and Harrison, 2011; Guo et al., 2014; Jiang et al., 2008; Yu et al., 2015; Zhang et al., 2010; Zhang et al., 2008; Zhou, 2011), the PCV2 VLP would be a good test target for high-resolution cryo-EM reconstructions of small viruses.
We describe here an image processing strategy that successfully overcame difficulties in processing close-packed particles and solved the structure of PCV2 particles recorded on photographic films to 2.9 Å, the highest resolution obtained without direct electron detectors. Competitive multi-model refinements allowed robust construction of de novo initial models. Consensus solutions from refinements of independent initial models allowed robust cross-validation and identification of particles with correctly determined views for further high resolution refinements. Refinements of higher-order microscopy parameters, including defocus, astigmatism, beam tilt, overall and anisotropic magnifications, further improved the resolution achievable by standard refinements including only Euler angles and center positions. Thus, in contrast to the common view as unusable data, we have shown here that close-packed particles are not only useful but also allow near-atomic resolution 3-D reconstructions. The large number of particles in a single image can also significantly improve throughput of data collection.
Results
Electron cryo-microscopy and data quality evaluation
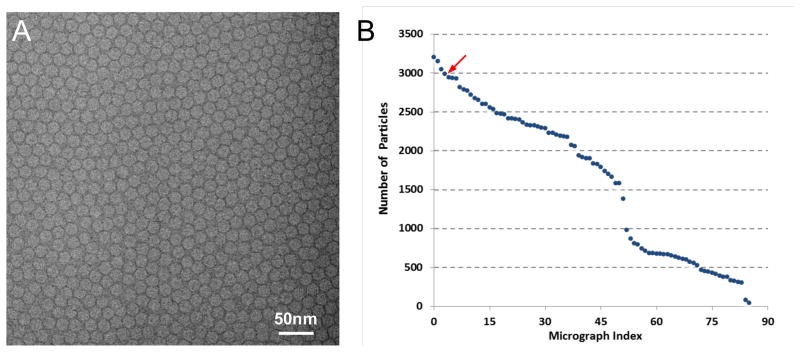
We over-expressed the full-length capsid protein in insect cells and purified the VLPs for structural studies using single particle cryo-EM. Close-packed particles were encountered (Figure 1A) when the sample grids were examined on the Titan Krios microscope. Instead of preparing new sample grids to further optimize particle density/distribution and using additional imaging sessions to obtain images of more dispersed particles as in typical cryo-EM projects, we chose to continue data collection to make best use of the microscope time but with intention to overcome the crowding problem by improving image processing methods. Out of the 168 photographic films, which were manually imaged in eight hours, 141 were selected for digitalization. 55 of the scanned micrographs were discarded after power spectra screening due to significant sample drift. The close-packing made it remarkably efficient to obtain large number of particles. From the remaining 86 micrographs, we selected 139,871 particles with more than 1,600 particles per micrograph on average (Figure 1B). However, almost all the particles are packed and in close contact with multiple neighbor particles (Figure 1A). Assessments of the image quality (Figure S1) found that the average B-factor of these micrographs is in the range of 300–400 Å2 (Figure S1C) with the highest resolution Thon rings visible to 6–7 Å resolutions (Figure S1A,B). Following conventional wisdoms (Grassucci et al., 2008; Liu et al., 2010), these close-packed virus particles would not be suitable for near-atomic resolution 3-D reconstructions.
Figure 1. Cryo-EM images.
(A) Representative micrograph of close-packed PCV2 particles. There are 2991 particles in this micrograph. (B) Number of particles in the 86 micrographs. The arrow points to the micrograph shown in (A). See also Figure S1.
Image processing and 3-D reconstruction: de novo initial models
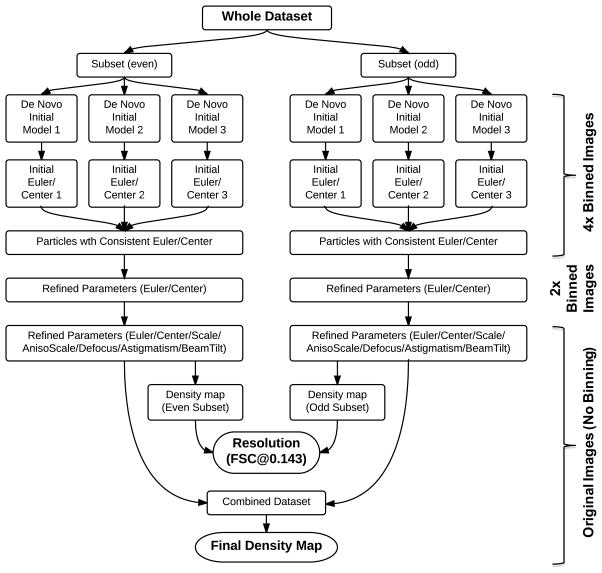
Unsurprisingly, the close-packing initially posed serious challenges to image processing and 3-D reconstructions, especially in building initial models and reliable determination of initial particle orientations. Nevertheless, a new image processing strategy (Figure 2) as described below demonstrated the feasibility of overcoming the challenges and reaching 2.9 Å resolution from these sub-optimal images with close-packed particles.
Figure 2. Flowchart of the image processing strategy.
The De Novo Initial Model boxes are further expanded in Figure S2. See also Figures S2, S3, and S4.
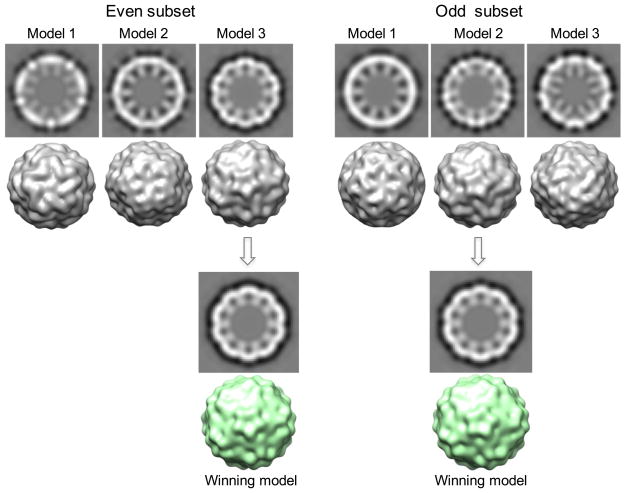
We first randomly selected small datasets (1,000 particles in each set) and assigned them random orientations (i.e. Euler angles) followed by iterative refinements to construct de novo initial models using 4× binned particle images (Guo and Jiang, 2014; Liu et al., 2007; Yan et al., 2007). Three independent models were constructed using this random model approach for cross validation (Figure 2). However, in contrast to consistent models typically obtained for many less-challenging virus datasets (Guo and Jiang, 2014; Liu et al., 2007; Yan et al., 2007), close-packing led to large discrepancies among these PCV2 de novo models (Figure 3). To reach correct initial models, these discrepant models were then used as starting references to compete in iterative multi-model refinements against the combined 3000-particle set and assign the particles to the best matching model (i.e. highest correlation) (Figure S2). The winning model typically attracted majority of the particles (~60–80%) and was chosen as the final model (Figure 3). Though the multi-model competitive refinement was often used to separate particles of heterogeneous conformations (Chen et al., 2006; Leschziner and Nogales, 2007; Scheres et al., 2007; Spahn and Penczek, 2009), its application here had effectively led to consistent initial models from independently processed datasets (Figure 3) and thus helped solve the challenges in obtaining reliable de novo initial 3-D models from close-packed particles. The losing models were discarded and only the winning model was used as good initial model for subsequent refinement against entire dataset. As shown in Figures 3, this process generated a single winning model that was represented as one of the box labeled with “De Novo Initial Model” in Figure 2. This process was repeated to generate multiple winning models with each represented by a different “De Novo Initial Model” box numbered differently (1, 2, or 3) (Figure 2).
Figure 3. Competitive multi-model refinement for reliable de novo initial models.
Only one out of three initial models obtained for even and odd subset of particles is shown as example in this figure. The central section views and the surface views of the three independent random models (each built from a unique subset containing 1000 randomly selected particles) were significantly different suggesting that some or all of the three models converged to wrong solutions. These three models were then used as starting models in a competitive multi-model refinement process against the combined 3000 particle set (i.e. pooling the 3 subsets of particles with each containing 1000 particles). Each particle was assigned to the model with best matching score (i.e. highest correlation). This competitive multi-model refinement helped identify the correct model and further evolve the model towards correct solution. The model winning the most particles (~60–80% of particles) was selected as the “correct” initial model. As shown by the two independent examples for even and odd datasets, the additional competitive multi-model refinements could effectively identify and evolve significantly divergent models to nearly identical models (ignoring the difference in handedness). The consistent winning models among independent datasets and refinements were considered as the correct PCV2 model for further refinements. See also Figure S2.
To minimize the impact of close-packing in 2-D alignments, a polar Fourier transform (PFT) method (Baker and Cheng, 1996) with radial range limited to particle edge was used in conjunction with center search. The PFT method essentially uses a mask of optimal size that moves with trial particle centers during center search. This is in contrast to the self correlation function based 2-D alignment method (Ludtke et al., 1999; Tang et al., 2007) in which the mask is centered at image center instead of particle center and the mask sizes need to be significantly larger than the particle to accommodate potential offset of particles due to imperfect centering during particle selection. To minimize the signals of neighbor particles due to CTF-induced signal spread, the particles were CTF-corrected by phase flipping before 2-D alignment by PFT.
Image processing and 3-D reconstruction: low resolution refinements
To further improve the reliability of particle views and to remove particles with unreliable views, three sets of particle parameters were obtained by refining each particle with three independent de novo models with each model being a winning model from a separate competitive multiple-model refinement using its own subset of particles (3×1000 particles) (Figure 2). Only ~40% of the particles had consistent views (<2°) among all three sets of parameters and were kept for further refinements (Figure S3). This consensus approach is analogous to popular vote and jury verdict in which the consensus is adopted as the final solution when ground truth is not available. Using the particle parameters obtained from 4× binned images but applied to images without binning, the 3-D reconstruction reached 3.66 Å, a resolution more than 2× better than the Nyquist resolution (8.64 Å) of the 4× binned images used for the refinements (Figure S4). This result suggests that the accuracy of 2-D alignment using only low-resolution information can often be sufficient to reach significantly higher resolution 3-D reconstructions (Chen et al., 2013; Liu et al., 2007).
Image processing and 3-D reconstruction: high-resolution refinements
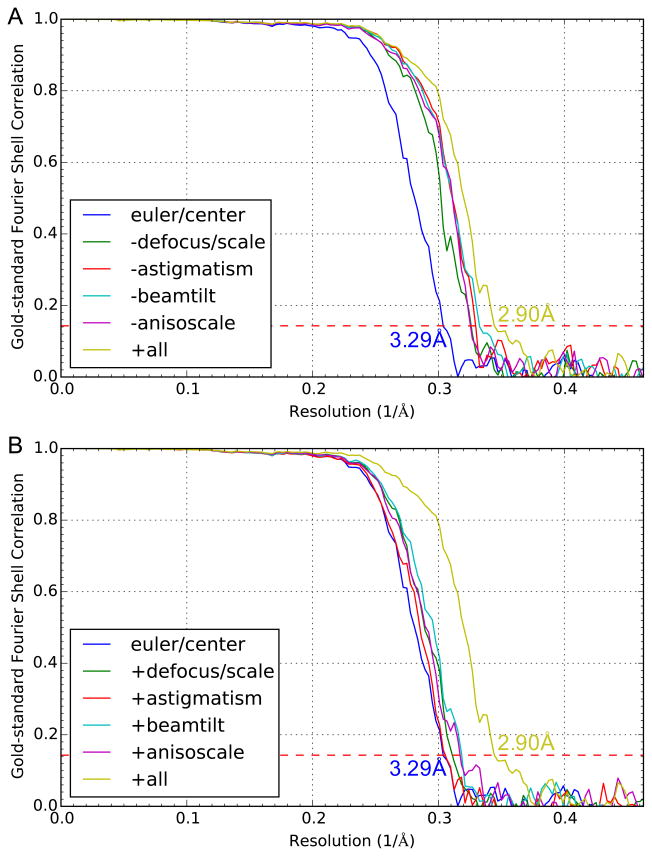
The particle parameters from refinements using 4× binned particles were then transferred to 2× binned particles and original particles without binning for further refinements (Figure 2). Refinement using 2× binned particles improved the resolution to 3.43 Å resolution (Figure S4). Extensive high-resolution refinements were performed using original particle images without binning, which started with refinements of only orientation and center parameters, and then further extended to also include higher-order parameters (Baker et al., 2013; Guo and Jiang, 2014; Guo et al., 2014) including defocus, astigmatism, beam tilt, overall scale (i.e. magnification), and anisotropic scale (i.e. different magnifications along different directions). These further refinements improved the 3-D reconstruction to 2.9 Å resolution (Figure 4, 5B, S4). Reconstructions with only orientation and center parameters without these high-order parameters were limited at lower (3.29 Å) resolution (Figure 4). Each of these high-order refinement parameters alone only slightly improved the resolution (Figure 4B) but collectively these parameters significantly improved the resolution to 2.9 Å (Figure 4A).
Figure 4. Gold-standard Fourier shell correlation curves for reconstructions using various combinations of refinement parameters.
(A) Reconstructions using all (+all) refinement parameters: euler, center, defocus, scale, astigmatism, beam tilt, and anisotropic scaling; all except one of the parameter sets: without refined defocus and scale (−defocus/scale), without refined astigmatism (−astigmatism), without refined beam tilt (−beamtilt), without refined anisotropic scaling (−anisoscale); and reconstruction with only euler and center parameters, defocus pre-fitted using power spectra (euler/center). (B) is similar to (A) except that four of the reconstructions (+defocus/scale, +astigmatism, +beamtilt, +anisoscale) used only the single indicated parameter set in addition to euler and center parameters.
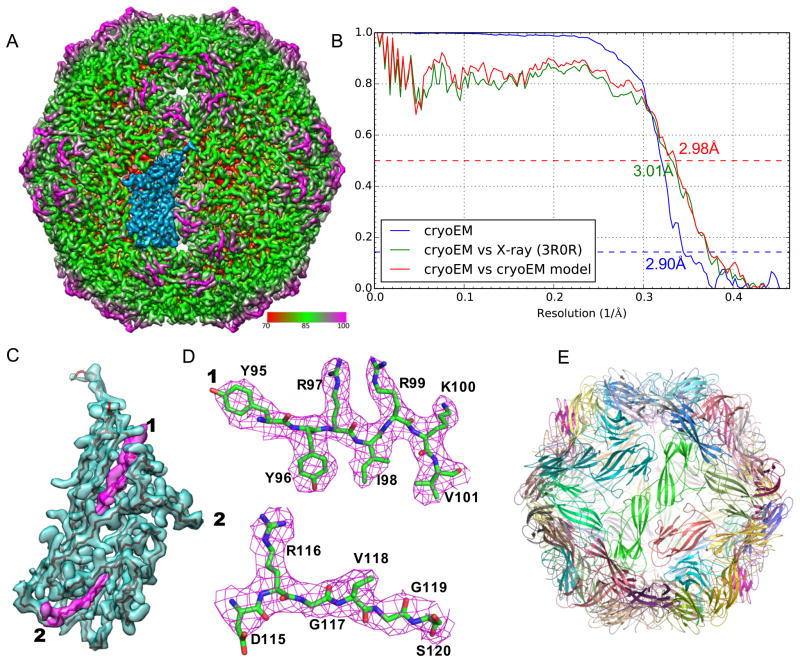
Figure 5. 3-D reconstruction and atomic model of PCV2.
(A) Radially colored surface view of PCV2 density map at 2.9 Å resolution. An asymmetric unit is highlighted in marine color. (B) Fourier shell correlation curves. The blue curve is the FSC between two completely independent cryo-EM reconstructions indicating 2.9 Å resolution using 0.143 criterion. The green curve is the FSC between our cryo-EM reconstruction of the whole dataset and the electron density map generated from X-ray crystallographic model (PDB ID: 3R0R) indicating 3.01 Å resolution using 0.5 criterion. The red curve is the FSC between our cryo-EM reconstruction and the atomic model derived from this map indicating 2.98 Å resolution using 0.5 criterion. (C) Cryo-EM density (marine color) of a monomer highlighted in (A) superimposed with its atomic model (only backbone showed for clear display). (D) Cryo-EM density (magenta mesh) of two highlighted regions in (C) superimposed with our atomic model (green, blue, and red sticks). (E) Atomic model of the entire PCV2 VLP. See also Figures S6 and S7.
The refined particle views allowed us to analyze the relative view angles among neighboring particles (Figure S5B). We found that the histogram for neighbor particles is very similar to that for control pairs of particles from different micrographs and control pairs of particles with randomized views. The lack of a peak around 0-degree suggests that there is little synchrony of views among neighboring particles despite the close-packing. The close-packing thus only constrains the particle position but little for the rotational freedom. The slightly higher number of particles pairs (both neighboring particles and particles in different micrographs) at around 10 degrees compared to the particles with randomized views reflects the more clustered views around icosahedral 3-fold axes (Figure S5A).
Resolution evaluation and validation: gold standard FSC, FSCtrue and local resolutions
In this work, the stated resolutions were evaluated using the “gold standard” FSC=0.143 criterion (Figure 4, 5B, S4) (Rosenthal and Henderson, 2003; Scheres and Chen, 2012). However, we adopted an even more stringent, truly independent strategy in which not only the dataset was split into even and odd halves before iterative refinements (Figure 2) as recommended by the EM Validation Task Force (Henderson et al., 2012), but also the initial models were independently built de novo for each subsets instead of using a common low resolution starting model (Scheres and Chen, 2012). As shown in the overall image processing workflow (Figure 2), initial models were separately constructed de novo for each of the two half datasets and the subsequent refinements were all limited to the corresponding half datasets without mixing.
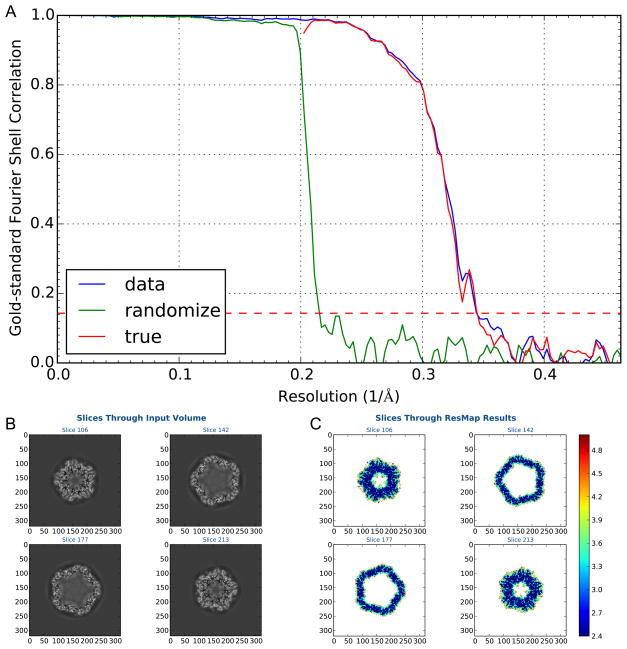
To monitor potential resolution inflation that might have been caused by over-fitting inadvertently included in the refinements of multiple higher-order parameters, we also performed the noise substitution test (Chen et al., 2013) in parallel with the refinements of original particles. Each of the half datasets was phase-randomized in the resolution range of 5 Å and higher. As shown in Figure 6A, the FSC curve between the two phase-randomized datasets (FSCnoise) showed ignorable correlation beyond 5 Å resolution, suggesting that the refinement of higher-order parameters did not cause over-fitting. The FSCtrue curve was then calculated by subtracting FSCnoise from the FSC between original particles using Eq. 4 in (Chen et al., 2013). The FSCtrue curve was suggested as a more reliable measurement of authentic resolution of cryo-EM 3-D reconstructions. It is apparent that our FSCtrue curve essentially superimposes on the FSC curve of original particles (Figure 6A). Using the FSCtrue=0.143 criterion, our PCV2 structure overall is at 2.9 Å resolution.
Figure 6. Validation with phase randomized images and local resolution assessment.
(A) The particles were phase randomized in resolution range from 5 Å to Nyquist and independently refined in parallel with original images using identical parameters. Shown are the Gold-standard FSC curves for original images (data), phase randomized images (randomize), and the True FSC curve computed from these two FSC curves (true). (B,C) Local resolution evaluation using resmap. Shown are outputs of resmap software: (B) density sections; (C) resolution distributions in the same set of sections shown in (B). See also Figure S8.
The above two FSC curves report the map resolution based on the overall correlation of entire capsid. To assess the local resolution distribution and further validate our map with another independent resolution measurement, we used the resmap method (Kucukelbir et al., 2014) to calculate the local resolution of our PCV2 map (Figure 6B,C). It can be seen that a significant portion of the capsid are colored in the resolution range of 2.4 to 2.7 Å, slightly better than the overall resolution at 2.9 Å. The outer surface region of the capsid is colored in the resolution range of 3.3 to 3.6 Å, suggesting the surface region of the capsid protein structure has more flexible conformations (Figure 7).
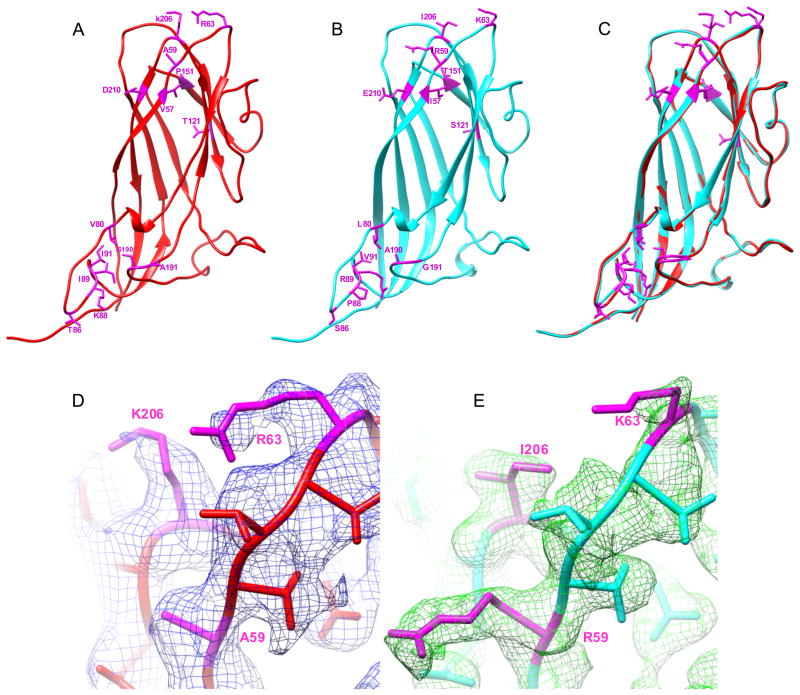
Figure 7. Comparison of PCV2 atomic models.
The atomic model of a single subunit of the PCV2 capsid protein is shown in ribbon diagram for (A) our atomic model, (B) the crystal structure (3R0R), and (C) the two models superimposed. The residues different in the two virus strains are labeled in magenta which are clustered in the loops. The overall Cα RMSD between these two atomic models is 0.31 Å as measured using Chimera program. (D,E) Comparison of densities of cryo-EM map (D) and crystal map (3R0R) (E) in the flexible loop region. The cryo-EM density map (blue mesh in D) and the 2fo-fc density map of 3R0R (green mesh in E, downloaded form the Electron Density Server at http://eds.bmc.uu.se/eds) were superimposed with corresponding atomic models (colored sticks). Though the electron densities in these two loops are the least resolved regions in both density maps, distinct shapes of the side chain densities could be seen for some of the residues different in the two virus strains. Shown are three pairs of different residues, A59, R61, and K206 in (D) and R59, K61, and I206 in (E), labeled in magenta. See also Figure S8.
Resolution evaluation and validation: correlation with atomic models
Structural analysis suggested that the level of details resolved in the density map were consistent with the resolvable features expected at this resolution (2.9 Å) by comparing to several X-ray crystal structures of viruses (Figure S6). With the main-chain densities easily traceable by visual examination and the clearly visible side-chain densities (Figure 5C, D and Figure S7), an atomic model (a.a. 42–231) of the capsid protein (Figure 5E, 7A) was manually built using Coot (Emsley et al., 2010) and then refined using the real-space refinement method in Phenix (Adams et al., 2010). The N-terminal 41 residues were not modelled as they were disordered probably due to lack of interactions with genome in the VLP. FSC analysis indicates that this atomic model agrees with the cryo-EM reconstruction to 3.0 Å resolution at 0.5 cut-off (Rosenthal and Henderson, 2003) (Figure 5B). Extensive model geometry statistics and density fitting scores, including Ramachandran statistics, side chain rotamers, clash score, MolProbility score (Chen et al., 2010), model/map correlation coefficient, and EMRinger score (Barad et al., 2015), were assessed (Table 1). The excellent statistics suggest that our model is physicochemically accurate and agrees well with the densities. The EMRinger score was recently developed to specifically probe high-resolution (4.5 Å and better) structural features by measuring the agreement of side-chain rotamers in the model with the densities (Barad et al., 2015). Our EMRinger score 6.5 is exceptionally high when compared to the expected average score 2.2 at this resolution (2.9 Å) and the best score, 3.26, for the large number of near-atomic resolution cryo-EM map/model pairs (Barad et al., 2015).
Table 1.
Validation statistics for PCV2 model
| Parameter | Values |
|---|---|
| Phenix Real-space Refinement | |
| Map CC (around atoms) | 0.828 |
| MolProbility | |
| Ramachandran favored | 97.34% |
| Ramachandran allowed | 2.13% |
| Ramachandran outliers | 0.53% |
| Rotamer outliers | 0.00 % |
| C-beta deviations | 0 |
| Clashscore | 8.15 (81%) |
| RMS(bonds) | 0.0103 |
| RMS(angles) | 1.15 |
| MolProbity score | 1.57 (93%) |
| EMRinger Score | 6.5 |
The PCV2 structure consists of predominantly β-sheets with a jelly-roll fold that is prevalent in virus capsid protein structures (Rossmann and Johnson, 1989). For ~96% (183/190) of the residues the side chain densities (Figure 5D and Figure S7) were resolved. Characteristic shape of the side chains of some residues, for example, the benzene ring of Tyr96, branched side chain of Ile98, bend in Arg116, etc., were resolved (Figure 5D, S7). FSC analysis indicates that our cryo-EM reconstruction agrees with the X-ray structure (PDB ID: 3R0R) (Khayat et al., 2011) of the N-terminally truncated VLP of a different PCV2 strain to 3.0 Å resolution at 0.5 cut-off (Rosenthal and Henderson, 2003) (Figure 5B), despite additional 41 N-terminal residues and 14 internal different residues in the 233 a.a. capsid protein forming the particles studied in this work (Figure S8). Our atomic model built independently from the EM map was found consistent with this PCV2 crystal structure with an overall Cα RMSD of 0.31 Å. The largest discrepancies were localized mainly in the exposed loops in which most of the different residues between these two PCV2 strains were also localized (Figure S8). The densities in these loops are weaker in both our EM map and the crystal structure (Figure 7D,E) suggesting increased conformational flexibilities in these exposed loops, which was independently revealed by the local resolution assessment (Figure 6C).
Discussion
In summary, we demonstrated that single particle cryo-EM could obtain 2.9 Å resolution reconstructions for close-packed particles of PCV2, the smallest virus with a relatively smooth capsid surface. This represents the highest resolution and the only sub-3 Å single particle cryo-EM structure without using direct electron detector. This accomplishment was enabled by an image processing strategy with several merits. The particle distributions are significantly relaxed to allow grids with close-packed virus particles, which would significantly improve rate of usable sample grid preparation and throughput of data collection. The random model approach enhanced with competitive multi-model refinements could reliably construct de novo initial 3-D models for challenging datasets. The consensus solution of multiple truly independent refinements presents a practical method for identification of reliable particle parameters for large datasets, which would complement the tilt pair method more suited to small datasets (Henderson et al., 2011; Rosenthal and Henderson, 2003). The refinement of high-order parameters beyond Euler/center can further determine/correct residual image imperfections to improve the resolution. The resolution obtained from early split of dataset and truly independently refined reconstructions conforms to the “gold standard” that can reliably gauge the quality of single particle cryo-EM 3-D reconstructions (Henderson et al., 2012; Scheres and Chen, 2012). This strategy should be generally applicable to other single particle cryo-EM projects of viruses although applicability to non-virus macromolecular complexes needs to be further studied. The observation of minimal view synchronization among neighbor particles suggests that close-packing constrains particle positions but not orientations. However, more systems need to be analyzed to know how general this observation is.
We would like to note that this ~2.9 Å resolution cryo-EM 3-D reconstruction used data with sub-optimal particle distribution (i.e. close-packed particles) and detector (i.e. photographic films with consumer grade scanner). This suggests that higher resolution (2–2.5 Å) structures might be feasible when dispersed particles are imaged on a direct electron detector with dose fractionation and correction of sample movements during imaging (Abrishami et al., 2015; Li et al., 2013; McMullan et al., 2014; Ruskin et al., 2013). The level of structural details in cryo-EM structures at these resolutions (Bartesaghi et al., 2015) would be sufficient to localize the binding site and reveal the detailed interactions of small drug ligands with virus particles to allow structure-based rational design of antivirals.
Experimental Procedures
Sample preparation
The virus-like particles (VLP) of PCV2 Yamagata strain (GenBank ID: AB426905.1) were prepared using the previously reported method (Liu et al., 2008). Briefly, viral DNA was extracted from the PCV2 virion, and the full-length ORF2 was ligated into the transfer vector pVL1393 (Pharmingen, San Diego, CA). A recombinant baculovirus (AcPCV2-ORF2) was then constructed to express the capsid protein encoded by ORF2. Insect Tn5 cells were infected with AcPCV2-ORF2. The culture medium of the infected Tn5 cells was harvested at 7 days post infection and the PCV2 VLPs were purified by CsCl gradient centrifugation.
Electron cryo-microscopy
A 3 μl aliquot of the PCV2 sample at 3 mg/ml concentration was applied to 400-mesh holey carbon grids (1.2/1.3 C-flat, Protochips). After blotting excessive sample solution, the grid was plunge frozen in liquid ethane cooled by liquid nitrogen using the Cp3 plunge-freezing device (Gatan). Cryo-EM images were taken using a FEI Titan Krios electron cryo-microscope with field emission gun (FEG) operated at 300 kV and parallel illumination. The images were recorded on Kodak SO163 negative films at low dose (25–27 e/Å2) and at a nominal magnification of 59k with intended defocus range of 1.5–2.5 μm. The films without obvious ice contamination (141 out of 168) were selected for digitization using a Nikon Super CoolScan 9000ED scanner with step size of 6.35 μm/pixel. The final calibrated sampling of the scanned images is 1.08 Å/pixel.
Image processing and 3-D reconstruction
Among the 141 scanned micrographs, 55 were discarded due to significant drift/charging after power spectra screening. From the remaining 86 micrographs, 139,871 particles (320×320 pixels) were selected using e2boxer.py program of the EMAN2 software package (Tang et al., 2007). No masking was performed on the particles at this stage. Masking would be performed later on the fly using the best known particle center at the 2-D alignment and 3-D reconstruction steps of each refinement iteration. The contrast transfer function (CTF) parameters were first automatically fitted using the fitctf2.py program (Jiang et al., 2012) and then verified using EMAN ctfit program (Ludtke et al., 1999). These fitted CTF parameters were used only as initial parameters that would be further refined in later high-resolution refinements. CTF correction was thus not performed at this stage but on the fly using the most recently refined parameters during each iteration of 2-D alignment and 3-D reconstruction. The entire dataset was then divided into two halves (69936 for even subset and 69935 for odd subset) and all subsequent image processing, including construction of de novo initial models and iterative refinements, was performed on each of the two subsets independently (Figure 2) using our jspr software (Guo and Jiang, 2014) built on EMAN (Ludtke et al., 1999) and EMAN2 (Tang et al., 2007).
Initial models and refinements
Construction of initial icosahedral models and initial refinements were performed using 4× binned images. Three independent de novo initial icosahedral models were constructed using random model approach (Guo and Jiang, 2014; Yan et al., 2007) enhanced with multi-model refinements for each of the subsets (Figure 2, 3, S2). The particle orientation and center parameters were first determined using a PFT alignment method (Baker and Cheng, 1996) with center search implemented in jspr software (Guo and Jiang, 2014). The radial range for PFT was limited to 25 pixels which is just slightly larger than the particle size. 2-D alignment was initially performed using exhaustive projection matching (within icosahedral asymmetric unit) with projections sampled at 3° angular step size and then refined using a grid-less projection matching method employing Simplex optimization (Nelder and Mead, 1965). The initial models (3 for even subset and 3 for odd subset) were used to independently determine the particle orientation and center parameters to obtain three sets of parameters for each particle. Only particles (27131 for even subset and 28047 for odd subset) with consistent orientation (σ≤2°) and center (σ≤1pixel) parameters among the three sets (Figure S3) were kept for further high-resolution refinements.
High-resolution refinements and resolution evaluation
The particle parameters obtained from initial refinements using 4× binned particles were transferred (i.e. adjusting center positions by 2× while reusing Euler angles) to 2× binned particles for further refinements (Figure 2). Similarly, the parameters refined using 2× binned particles were then transferred to original particles without binning for high resolution refinements. During the iterative high-resolution refinements, the 2-D alignments were extended beyond particle orientation and center to also include high-order parameters, magnification, defocus, and astigmatism, in jspr as described in (Baker et al., 2013; Guo and Jiang, 2014; Guo et al., 2014), and beam tilt (Glaeser et al., 2011; Henderson et al., 1986; Zhang and Zhou, 2011) and anisotropic magnification (Grant and Grigorieff, 2015a; Zhao et al., 2015) implemented in jspr more recently. The CTF phase correction (phase flipping and beam tilt phase correction) was performed using the most recently refined values during 2-D alignments and 3-D reconstructions. After final iteration of refinement, the two completely independently refined 3-D reconstructions, one from even subset and one from odd subset, were used to compute “gold-standard” Fourier shell correlation (FSC) to evaluate the resolution at FSC=0.143 (Henderson et al., 2012; Rosenthal and Henderson, 2003; Scheres and Chen, 2012). The final 3-D reconstruction of the whole dataset (50352 particles) was built by pooling the two subsets of particles without further refinement. The final reconstruction was sharpened by first setting the map structural factor curve to a reference structural factor curve and then low pass filtered using FSC-derived curve (Cref) as in the Henderson approach (Rosenthal and Henderson, 2003). The density values in the final density map were normalized by setting the background mean to zero and background sigma to one, which results in the density values equivalent to signal to noise ratios (Guo and Jiang, 2014). The local resolution of final reconstruction was assessed using resmap (Kucukelbir et al., 2014).
Each subset of the particles was also subjected to noise substitution by randomizing phases beyond 5 Å using e2proc2d.py with processor filter.lowpass.randomphase in EMAN2 (Tang et al., 2007). The phase-randomized particles were refined in parallel with the original particle sets (i.e. a total of 4 “datasets”, original even subset, original odd subset, phase-randomized even subset, and phase-randomized odd subset, were refined simultaneously using identical parameters). The FSC between the phase-randomized subsets and the FSC between the original subsets were then combined to derive the FSCtrue that would be free of resolution inflation caused by over-fitting (Chen et al., 2013). To compute FSC with X-ray crystal structure (PDB ID: 3R0R) and our atomic model of PCV2 built from EM density map, electron densities of the atomic models were computed using the e2pdb2mrc.py program in EMAN2 (Tang et al., 2007) from the PDB file with the icosahedral center of 3R0R adjusted to compensate for the center offset. The Python script written for inter-particle angle analysis is included as Supplementary Script 1.
All these iterative processing tasks were performed using our jspr software (Guo and Jiang, 2014) that is available on the authors’ Web site (http://jiang.bio.purdue.edu/jspr). The graphics for densities were generated using Chimera (Goddard et al., 2007). The FSC curves were plotted using matplotlib software (http://matplotlib.org). The final density map has been deposited to Electron Microscopy Databank (EMDB) with accession code EMD-6555.
Model building and validation
A density block slightly larger than an asymmetric unit was extracted from the entire map to build initial atomic model of the capsid protein. The density map was well resolved and the clearly visible side-chain densities made interactive modelling straightforward using Coot (Emsley et al., 2010). By visually tracing the main chain, a Baton model was first constructed and then converted to a main chain model. The ‘jelly-roll’ topology and side-chain densities along the chain were used as landmarks to compare with the predicted secondary structure elements (mostly β-strands) and the long side chain residues in the protein sequence to assign residues to the model. The N-terminal 41 residues were disordered and thus not modelled. The Coot model (a.a. 42–231, 190 residues) was further refined using Phoenix real space refinement (program phenix.real_space_refine) (Adams et al., 2010). The final model was validated with good bond length, angles, Ramachandran statistics, clash score, MolProbility score (Chen et al., 2010) (from program phenix.molprobity), and the new EMRinger score (from program phenix.emringer). The validation statistics were compiled in Table 1. The graphics for atomic models were generated using Chimera (Pettersen et al., 2004) and Pymol (http://www.pymol.org). The atomic model has been deposited to Protein Databank (PDB) with accession code 3JCI.
Supplementary Material
Highlights.
A strategy for processing close-packed particles often regarded as unusable data
2.9 Å resolution 3-D reconstruction based on “gold standard” FSC
Cross-validation by FSCtrue and local resolution assessment
Cross-validation by FSC with atomic model, MolProbility and EMRinger
Acknowledgments
This work was supported by NIH. The cryo-EM images were taken in the Purdue Cryo-EM Facility and the Purdue Rosen Center for Advanced Computing provided the computational resource for the 3-D reconstructions. We thank Dr. Agustin J. Avila-Sakar and Frank S. Vago for help in preparation of the manuscript.
Footnotes
Author Contributions: Z.L. and W.J. conceived and performed experiments, wrote the manuscript. T.L. provided reagents. F.G. and F.W. provided expertise.
Publisher's Disclaimer: This is a PDF file of an unedited manuscript that has been accepted for publication. As a service to our customers we are providing this early version of the manuscript. The manuscript will undergo copyediting, typesetting, and review of the resulting proof before it is published in its final citable form. Please note that during the production process errors may be discovered which could affect the content, and all legal disclaimers that apply to the journal pertain.
References
- Abrishami V, Vargas J, Li X, Cheng Y, Marabini R, Sorzano CO, Carazo JM. Alignment of direct detection device micrographs using a robust Optical Flow approach. J Struct Biol. 2015;189:163–176. doi: 10.1016/j.jsb.2015.02.001. [DOI] [PubMed] [Google Scholar]
- Adams PD, Afonine PV, Bunkoczi G, Chen VB, Davis IW, Echols N, Headd JJ, Hung LW, Kapral GJ, Grosse-Kunstleve RW, et al. PHENIX: a comprehensive Python-based system for macromolecular structure solution. Acta crystallographica Section D, Biological crystallography. 2010;66:213–221. doi: 10.1107/S0907444909052925. [DOI] [PMC free article] [PubMed] [Google Scholar]
- Amunts A, Brown A, Bai XC, Llacer JL, Hussain T, Emsley P, Long F, Murshudov G, Scheres SH, Ramakrishnan V. Structure of the yeast mitochondrial large ribosomal subunit. Science. 2014;343:1485–1489. doi: 10.1126/science.1249410. [DOI] [PMC free article] [PubMed] [Google Scholar]
- Baker ML, Hryc CF, Zhang Q, Wu W, Jakana J, Haase-Pettingell C, Afonine PV, Adams PD, King JA, Jiang W, Chiu W. Validated near-atomic resolution structure of bacteriophage epsilon15 derived from cryo-EM and modeling. Proc Natl Acad Sci U S A. 2013;110:12301–12306. doi: 10.1073/pnas.1309947110. [DOI] [PMC free article] [PubMed] [Google Scholar]
- Baker TS, Cheng RH. A model-based approach for determining orientations of biological macromolecules imaged by cryoelectron microscopy. J Struct Biol. 1996;116:120–130. doi: 10.1006/jsbi.1996.0020. [DOI] [PubMed] [Google Scholar]
- Barad BA, Echols N, Wang RY, Cheng Y, DiMaio F, Adams PD, Fraser JS. EMRinger: side chain-directed model and map validation for 3D cryo-electron microscopy. Nature methods. 2015;12:943–946. doi: 10.1038/nmeth.3541. [DOI] [PMC free article] [PubMed] [Google Scholar]
- Bartesaghi A, Merk A, Banerjee S, Matthies D, Wu X, Milne JL, Subramaniam S. 2.2 A resolution cryo-EM structure of beta-galactosidase in complex with a cell-permeant inhibitor. Science. 2015;348:1147–1151. doi: 10.1126/science.aab1576. [DOI] [PMC free article] [PubMed] [Google Scholar]
- Campbell MG, Veesler D, Cheng A, Potter CS, Carragher B. 2.8 A resolution reconstruction of the Thermoplasma acidophilum 20S proteasome using cryo-electron microscopy. eLife. 2015;4:e06380. doi: 10.7554/eLife.06380. [DOI] [PMC free article] [PubMed] [Google Scholar]
- Chen DH, Song JL, Chuang DT, Chiu W, Ludtke SJ. An expanded conformation of single-ring GroEL-GroES complex encapsulates an 86 kDa substrate. Structure. 2006;14:1711–1722. doi: 10.1016/j.str.2006.09.010. [DOI] [PubMed] [Google Scholar]
- Chen S, McMullan G, Faruqi AR, Murshudov GN, Short JM, Scheres SH, Henderson R. High-resolution noise substitution to measure overfitting and validate resolution in 3D structure determination by single particle electron cryomicroscopy. Ultramicroscopy. 2013;135:24–35. doi: 10.1016/j.ultramic.2013.06.004. [DOI] [PMC free article] [PubMed] [Google Scholar]
- Chen VB, Arendall WB, 3rd, Headd JJ, Keedy DA, Immormino RM, Kapral GJ, Murray LW, Richardson JS, Richardson DC. MolProbity: all-atom structure validation for macromolecular crystallography. Acta crystallographica Section D, Biological crystallography. 2010;66:12–21. doi: 10.1107/S0907444909042073. [DOI] [PMC free article] [PubMed] [Google Scholar]
- Crowther RA, Berriman JA, Curran WL, Allan GM, Todd D. Comparison of the structures of three circoviruses: chicken anemia virus, porcine circovirus type 2, and beak and feather disease virus. J Virol. 2003;77:13036–13041. doi: 10.1128/JVI.77.24.13036-13041.2003. [DOI] [PMC free article] [PubMed] [Google Scholar]
- Emsley P, Lohkamp B, Scott WG, Cowtan K. Features and development of Coot. Acta crystallographica Section D, Biological crystallography. 2010;66:486–501. doi: 10.1107/S0907444910007493. [DOI] [PMC free article] [PubMed] [Google Scholar]
- Finsterbusch T, Mankertz A. Porcine circoviruses--small but powerful. Virus Res. 2009;143:177–183. doi: 10.1016/j.virusres.2009.02.009. [DOI] [PubMed] [Google Scholar]
- Frank J. Three-dimensional electron microscopy of macromolecular assemblies: visualization of biological molecules in their native state. 2. Oxford ; New York: Oxford University Press; 2006. [Google Scholar]
- Glaeser RM, Typke D, Tiemeijer PC, Pulokas J, Cheng A. Precise beam-tilt alignment and collimation are required to minimize the phase error associated with coma in high-resolution cryo-EM. J Struct Biol. 2011;174:1–10. doi: 10.1016/j.jsb.2010.12.005. [DOI] [PMC free article] [PubMed] [Google Scholar]
- Goddard TD, Huang CC, Ferrin TE. Visualizing density maps with UCSF Chimera. J Struct Biol. 2007;157:281–287. doi: 10.1016/j.jsb.2006.06.010. [DOI] [PubMed] [Google Scholar]
- Grant T, Grigorieff N. Automatic estimation and correction of anisotropic magnification distortion in electron microscopes. J Struct Biol. 2015a;192:204–208. doi: 10.1016/j.jsb.2015.08.006. [DOI] [PMC free article] [PubMed] [Google Scholar]
- Grant T, Grigorieff N. Measuring the optimal exposure for single particle cryo-EM using a 2.6 A reconstruction of rotavirus VP6. eLife. 2015b;4:e06980. doi: 10.7554/eLife.06980. [DOI] [PMC free article] [PubMed] [Google Scholar]
- Grassucci RA, Taylor D, Frank J. Visualization of macromolecular complexes using cryo-electron microscopy with FEI Tecnai transmission electron microscopes. Nature protocols. 2008;3:330–339. doi: 10.1038/nprot.2007.474. [DOI] [PMC free article] [PubMed] [Google Scholar]
- Grigorieff N, Harrison SC. Near-atomic resolution reconstructions of icosahedral viruses from electron cryo-microscopy. Current opinion in structural biology. 2011;21:265–273. doi: 10.1016/j.sbi.2011.01.008. [DOI] [PMC free article] [PubMed] [Google Scholar]
- Guo F, Jiang W. Single particle cryo-electron microscopy and 3-D reconstruction of viruses. Methods in molecular biology. 2014;1117:401–443. doi: 10.1007/978-1-62703-776-1_19. [DOI] [PMC free article] [PubMed] [Google Scholar]
- Guo F, Liu Z, Fang PA, Zhang Q, Wright ET, Wu W, Zhang C, Vago F, Ren Y, Jakana J, et al. Capsid expansion mechanism of bacteriophage T7 revealed by multistate atomic models derived from cryo-EM reconstructions. Proc Natl Acad Sci U S A. 2014;111:E4606–4614. doi: 10.1073/pnas.1407020111. [DOI] [PMC free article] [PubMed] [Google Scholar]
- Henderson R, Baldwin JM, Downing KH, Lepault J, Zemlin F. Structure of Purple Membrane from Halobacterium-Halobium - Recording, Measurement and Evaluation of Electron-Micrographs at 3.5 Å Resolution. Ultramicroscopy. 1986;19:147–178. [Google Scholar]
- Henderson R, Chen S, Chen JZ, Grigorieff N, Passmore LA, Ciccarelli L, Rubinstein JL, Crowther RA, Stewart PL, Rosenthal PB. Tilt-pair analysis of images from a range of different specimens in single-particle electron cryomicroscopy. J Mol Biol. 2011;413:1028–1046. doi: 10.1016/j.jmb.2011.09.008. [DOI] [PMC free article] [PubMed] [Google Scholar]
- Henderson R, Sali A, Baker ML, Carragher B, Devkota B, Downing KH, Egelman EH, Feng Z, Frank J, Grigorieff N, et al. Outcome of the first electron microscopy validation task force meeting. Structure. 2012;20:205–214. doi: 10.1016/j.str.2011.12.014. [DOI] [PMC free article] [PubMed] [Google Scholar]
- Jiang W, Baker ML, Jakana J, Weigele PR, King J, Chiu W. Backbone structure of the infectious epsilon15 virus capsid revealed by electron cryomicroscopy. Nature. 2008;451:1130–1134. doi: 10.1038/nature06665. [DOI] [PubMed] [Google Scholar]
- Jiang W, Guo F, Liu Z. A graph theory method for determination of cryo-EM image focuses. J Struct Biol. 2012;180:343–351. doi: 10.1016/j.jsb.2012.07.005. [DOI] [PMC free article] [PubMed] [Google Scholar]
- Khayat R, Brunn N, Speir JA, Hardham JM, Ankenbauer RG, Schneemann A, Johnson JE. The 2.3-angstrom structure of porcine circovirus 2. J Virol. 2011;85:7856–7862. doi: 10.1128/JVI.00737-11. [DOI] [PMC free article] [PubMed] [Google Scholar]
- Kucukelbir A, Sigworth FJ, Tagare HD. Quantifying the local resolution of cryo-EM density maps. Nature methods. 2014;11:63–65. doi: 10.1038/nmeth.2727. [DOI] [PMC free article] [PubMed] [Google Scholar]
- Leschziner AE, Nogales E. Visualizing flexibility at molecular resolution: analysis of heterogeneity in single-particle electron microscopy reconstructions. Annu Rev Biophys Biomol Struct. 2007;36:43–62. doi: 10.1146/annurev.biophys.36.040306.132742. [DOI] [PubMed] [Google Scholar]
- Li X, Mooney P, Zheng S, Booth CR, Braunfeld MB, Gubbens S, Agard DA, Cheng Y. Electron counting and beam-induced motion correction enable near-atomic-resolution single-particle cryo-EM. Nature methods. 2013;10:584–590. doi: 10.1038/nmeth.2472. [DOI] [PMC free article] [PubMed] [Google Scholar]
- Liao M, Cao E, Julius D, Cheng Y. Structure of the TRPV1 ion channel determined by electron cryo-microscopy. Nature. 2013;504:107–112. doi: 10.1038/nature12822. [DOI] [PMC free article] [PubMed] [Google Scholar]
- Liu H, Jin L, Koh SB, Atanasov I, Schein S, Wu L, Zhou ZH. Atomic structure of human adenovirus by cryo-EM reveals interactions among protein networks. Science. 2010;329:1038–1043. doi: 10.1126/science.1187433. [DOI] [PMC free article] [PubMed] [Google Scholar]
- Liu LJ, Suzuki T, Tsunemitsu H, Kataoka M, Ngata N, Takeda N, Wakita T, Miyamura T, Li TC. Efficient production of type 2 porcine circovirus-like particles by a recombinant baculovirus. Archives of virology. 2008;153:2291–2295. doi: 10.1007/s00705-008-0248-x. [DOI] [PubMed] [Google Scholar]
- Liu X, Jiang W, Jakana J, Chiu W. Averaging tens to hundreds of icosahedral particle images to resolve protein secondary structure elements using a Multi-Path Simulated Annealing optimization algorithm. J Struct Biol. 2007;160:11–27. doi: 10.1016/j.jsb.2007.06.009. [DOI] [PMC free article] [PubMed] [Google Scholar]
- Ludtke SJ, Baker ML, Chen DH, Song JL, Chuang DT, Chiu W. De novo backbone trace of GroEL from single particle electron cryomicroscopy. Structure. 2008;16:441–448. doi: 10.1016/j.str.2008.02.007. [DOI] [PubMed] [Google Scholar]
- Ludtke SJ, Baldwin PR, Chiu W. EMAN: semiautomated software for high-resolution single-particle reconstructions. J Struct Biol. 1999;128:82–97. doi: 10.1006/jsbi.1999.4174. [DOI] [PubMed] [Google Scholar]
- McMullan G, Faruqi AR, Clare D, Henderson R. Comparison of optimal performance at 300keV of three direct electron detectors for use in low dose electron microscopy. Ultramicroscopy. 2014;147:156–163. doi: 10.1016/j.ultramic.2014.08.002. [DOI] [PMC free article] [PubMed] [Google Scholar]
- Nelder JA, Mead R. A Simplex-Method for Function Minimization. Computer Journal. 1965;7:308–313. [Google Scholar]
- Pettersen EF, Goddard TD, Huang CC, Couch GS, Greenblatt DM, Meng EC, Ferrin TE. UCSF Chimera--a visualization system for exploratory research and analysis. J Comput Chem. 2004;25:1605–1612. doi: 10.1002/jcc.20084. [DOI] [PubMed] [Google Scholar]
- Rosenthal PB, Henderson R. Optimal determination of particle orientation, absolute hand, and contrast loss in single-particle electron cryomicroscopy. J Mol Biol. 2003;333:721–745. doi: 10.1016/j.jmb.2003.07.013. [DOI] [PubMed] [Google Scholar]
- Rossmann MG, Johnson JE. Icosahedral RNA virus structure. Annual review of biochemistry. 1989;58:533–573. doi: 10.1146/annurev.bi.58.070189.002533. [DOI] [PubMed] [Google Scholar]
- Ruskin RS, Yu Z, Grigorieff N. Quantitative characterization of electron detectors for transmission electron microscopy. J Struct Biol. 2013;184:385–393. doi: 10.1016/j.jsb.2013.10.016. [DOI] [PMC free article] [PubMed] [Google Scholar]
- Scheres SH, Chen S. Prevention of overfitting in cryo-EM structure determination. Nature methods. 2012;9:853–854. doi: 10.1038/nmeth.2115. [DOI] [PMC free article] [PubMed] [Google Scholar]
- Scheres SH, Gao H, Valle M, Herman GT, Eggermont PP, Frank J, Carazo JM. Disentangling conformational states of macromolecules in 3D-EM through likelihood optimization. Nature methods. 2007;4:27–29. doi: 10.1038/nmeth992. [DOI] [PubMed] [Google Scholar]
- Spahn CM, Penczek PA. Exploring conformational modes of macromolecular assemblies by multiparticle cryo-EM. Current opinion in structural biology. 2009;19:623–631. doi: 10.1016/j.sbi.2009.08.001. [DOI] [PMC free article] [PubMed] [Google Scholar]
- Tang G, Peng L, Baldwin PR, Mann DS, Jiang W, Rees I, Ludtke SJ. EMAN2: an extensible image processing suite for electron microscopy. J Struct Biol. 2007;157:38–46. doi: 10.1016/j.jsb.2006.05.009. [DOI] [PubMed] [Google Scholar]
- Yan X, Dryden KA, Tang J, Baker TS. Ab initio random model method facilitates 3D reconstruction of icosahedral particles. J Struct Biol. 2007;157:211–225. doi: 10.1016/j.jsb.2006.07.013. [DOI] [PMC free article] [PubMed] [Google Scholar]
- Yu X, Jiang J, Sun J, Zhou ZH. A putative ATPase mediates RNA transcription and capping in a dsRNA virus. eLife. 2015;4:e07901. doi: 10.7554/eLife.07901. [DOI] [PMC free article] [PubMed] [Google Scholar]
- Zhang X, Jin L, Fang Q, Hui WH, Zhou ZH. 3.3 A cryo-EM structure of a nonenveloped virus reveals a priming mechanism for cell entry. Cell. 2010;141:472–482. doi: 10.1016/j.cell.2010.03.041. [DOI] [PMC free article] [PubMed] [Google Scholar]
- Zhang X, Settembre E, Xu C, Dormitzer PR, Bellamy R, Harrison SC, Grigorieff N. Near-atomic resolution using electron cryomicroscopy and single-particle reconstruction. Proc Natl Acad Sci U S A. 2008;105:1867–1872. doi: 10.1073/pnas.0711623105. [DOI] [PMC free article] [PubMed] [Google Scholar]
- Zhang X, Zhou ZH. Limiting factors in atomic resolution cryo electron microscopy: no simple tricks. J Struct Biol. 2011;175:253–263. doi: 10.1016/j.jsb.2011.05.004. [DOI] [PMC free article] [PubMed] [Google Scholar]
- Zhao J, Brubaker MA, Benlekbir S, Rubinstein JL. Description and comparison of algorithms for correcting anisotropic magnification in cryo-EM images. J Struct Biol. 2015;192:209–215. doi: 10.1016/j.jsb.2015.06.014. [DOI] [PubMed] [Google Scholar]
- Zhou ZH. Atomic resolution cryo electron microscopy of macromolecular complexes. Adv Protein Chem Struct Biol. 2011;82:1–35. doi: 10.1016/B978-0-12-386507-6.00001-4. [DOI] [PMC free article] [PubMed] [Google Scholar]
Associated Data
This section collects any data citations, data availability statements, or supplementary materials included in this article.


