

Abstract
Using a dataset of 1217 patients with multiple myeloma enrolled in Total Therapies we have examined the impact of novel therapies on molecular and risk subgroups and the clinical value of molecular classification. Bortezomib significantly improved the progression free (PFS) and overall survival (OS) of the MS subgroup. Thalidomide and bortezomib positively impacted the PFS of low risk (LoR) cases defined by the GEP70 signature, whereas high risk (HiR) cases showed no significant changes in outcome. We show that molecular classification is important if response rates are to be used to predict outcomes. The t(11;14) containing CD-1 and CD-2 subgroups showed clear differences in time to response and cumulative response rates but similar PFS and OS. Furthermore, complete remission was not significantly associated with the outcome of the MF subgroup or HiR cases. HiR cases were enriched in the MF, MS and PR subgroups but the poor outcome of these groups was not linked to subgroup specific characteristics like MAF overexpression per se. It is especially important to define risk status if HiR cases are to be managed appropriately because of their aggressive clinical course, high rates of early relapse and the need to maintain therapeutic pressure on the clone.
Keywords: Gene expression profiling, Molecular subgroups, High risk, Outcome, Total therapy
INTRODUCTION
Multiple myeloma (MM) is characterized by the abnormal accumulation of plasma cells (PC) in the bone marrow (BM), leading to impairment of hematopoiesis and the production of monoclonal immunoglobulin (Ig)1. Important clinical features of MM are bone destruction, renal impairment, immunosuppression and hypercalcemia1. The implementation of high dose-chemotherapy and autologous stem cell rescue was an initial treatment breakthrough in improving the outcome of MM2. Thereafter, the introduction of immunomodulatory agents (IMiDs) and proteasome-inhibitors (PIs) resulted in a further significant improvements3,4. Nevertheless, MM remains a disease with an unpredictable clinical course consistent with it being composed of a variety of molecular subtypes each with a distinct pathogenesis and clinical course5,6.
Initial genetic studies of MM utilized metaphase cytogenetic analysis to investigate the characteristic molecular aberrations of MM cells and their prognostic value6. Translocations involving the immunoglobulin heavy (IgH) and light chain (IgL) gene regions and hyperdiploidy (HD) were the major recurrent structural and copy number abnormalities identified by this method7. Investigations of MM cell lines allowed the recognition of both the mechanism and genes deregulated as a consequence of the IgH translocations8 but the mechanism responsible for HD remains elusive. High-resolution genome mapping and interphase fluorescence in situ hybridization (FISH) and more recently whole exome sequencing of primary patient material have provided further insights into the prognostically relevant genetic aberrations in MM7,9. Genetic lesions important in the pathogenesis of MM include the t(4;14) (deregulating MMSET and FGFR3), t(14;16) (MAFa), and t(14;20) (MAFb) all of which activate CCND2 expression10. A second set of lesions also affect the cell cycle G1/S checkpoint including the t(11;14) (CCND1), t(6;14) (CCND3), and del(1p32) (CDKN2C/FAF1)10. This leaves a miscellaneous set of recurrent lesions including del(1p11) (FAM46C), del(17p13) (P53), +1q21, mutations inactivating negative regulators of the NFkB pathway and mutations activating the RAS pathway, as well as copy number aberrations (CNA) and translocations into cMYC10.
The introduction of gene expression profiling (GEP) in MM was an important step in elucidating the molecular heterogeneity of MM and its clinical relevance. The TC classification was essentially an extension of knowledge derived from classic genetic studies of MM11. It is based on the expression of D type cyclins and the type of IgH translocation including the groups 11q, 6p, MAF, 4p, D1, D1+D2, D2, and none. The TC provided an initial start to the molecular classification of MM but while broadly applicable lacks an ability to give a full insight into the pathogenesis and classification of HD MM, which constitutes 50% of all cases.
The UAMS group established a molecular classification of MM based on unsupervised hierarchical clustering of GEP data that recognizes seven different molecular subgroups12. These groups largely correspond to the groups of the TC classification but in addition detect clusters based on other features that have clinical meaning in terms of outcome and response to therapy. The CD-1 and CD-2 groups correspond to cases with IgH translocations activating CCND1 or CCND3 with the CD-2 group being distinguished from the CD-1 by the expression of the early B-cell markers CD20 and PAX5. The MS group is defined by the upregulation of FGFR3 and/or MMSET whereas the MF group is characterized by either spiked expression of c-MAF or MAFB. The LB group is defined by a low number of bone lesions. The largest group is the HY group that contains HD cases. The PR group is characterized by the over-expression of cancer-testis antigens, cell cycle and proliferation-related genes and it contains similar numbers of HD and non-hyperdiploid (NHD) cases.
Another step forward in the characterization of the clinical and molecular heterogeneity of MM was the development of GEP based risk predictors13–16. Using log-rank tests for GEP data our group identified 70 genes linked to early disease-related death13. The UAMS GEP70 risk score is based on the ratio of the mean expression level of up-regulated to down-regulated genes among the 70 genes. Most up-regulated genes are located on chromosome 1q, and many down-regulated genes map to chromosome 1p. The predictor enabled the reliable identification of patients with shorter durations of complete remission, event-free survival, and overall survival that constitute 10 – 15% of newly diagnosed MM patients.
We have consistently collected GEP data over a number of evolving study protocols, carried out over the last 10 years, which have used different novel therapies as they have become available. The resulting expression dataset, which is extensive, gives us the opportunity not only to describe the clinical course associated with distinct molecular and risk subgroups but also how these outcomes are affected by the different treatment modalities used. In this report we present the clinical outcome of subgroups defined by the UAMS classifiers in our Total Therapy (TT) trials and the impact of thalidomide, bortezomib and lenalidomide on them.
MATERIALS AND METHODS
Patients
We included 1217 patients with baseline gene expression profiling (GEP) data who were enrolled prior to October 29th, 2014 in TT trials 2 – 5. TT2, TT3a and TT3b included previously untreated patients, regardless of risk. For these trials patient characteristics have been described previously3,4 and are summarized in Supplemental Table 1. TT4 evaluates the total therapy approach in patients with GEP70-defined low risk and TT5 was designed for GEP70-defined high-risk patients. An overview of the trial designs is provided in Supplemental Figure 1. For 145 patients GEP data at relapse was available. Informed consent for treatment and sample procurement in accordance with the Declaration of Helsinki was obtained for all cases included in this study that had been approved by the institutional review board.
Gene expression profiling of CD138+ plasma cells
Plasma cells were CD138-purified from bone marrow aspirates as previously published12. GEP of CD138-purified plasma cells using Affymetrix U133 2.0 plus arrays was performed as described12. Raw signals were MAS5 normalized using the Affymetrix Microarray GCOS1.1 software. Analyses for the derivation of GEP70-based high-risk designation12, and molecular subgroup classification13, have been reported previously. Expression data are deposited in Gene Expression Omnibus (GSE2658, GSE38627).
Interphase fluorescence in situ hybridization
Tricolor interphase fluorescence in situ hybridization (iFISH) analysis for the determination of 1q21 and 17p12 copy number was performed as previously published17.
Statistical Methods
Progression-free survival (PFS) and overall survival (OS) durations were measured from the time of initiation of protocol therapy; events included relapse or death from any cause in the former and death from any cause in the latter. Multivariate Cox proportional hazards regression was used to identify factors significantly associated with PFS, OS, and time to CR, and to obtain hazard ratio estimates and p-values at specified contrasts. The running log-rank test was used to identify a statistically optimal cut-point for a continuous variable. Wilcoxon or Fisher’s exact tests were used to compare the median of a continuous variable or the distribution of discrete variables across groups, respectively.
RESULTS
Distribution of molecular subgroups in total therapy trials
GEP data collected at baseline were available for 1217 patients treated in TT2 to TT5. The HY group was the largest subgroup (n=380, 31%), followed by CD-2 (n=186, 15%), MS (n=170, 14%), LB (n=166, 14%), PR (n=158, 13%), CD-1 (n=85, 7%) and MF (n=72, 6%). The distribution of the molecular subgroups in each TT trial is shown in Supplemental Figure 2.
Outcomes in molecular subgroups before and after the introduction of novel drugs
In order to determine whether novel agents had different effects within molecular subgroups we compared the outcomes of patients treated without novel drugs (TT2−) to patients treated with IMiDs or bortezomib (TT2+, TT3a, TT3b). In TT2− similar values for the estimated 5-year OS ranging between 73% and 80% were seen in the CD-1, CD-2, HY, and LB subgroups (Supplemental Table 2). The corresponding estimates for 5-year PFS were 64% (CD-1), 47% (CD-2), 41% (HY), and 50% (LB). The subgroups MF (44% PFS, 56% OS), MS (12%, 40%) and PR (32%, 56%) were associated with adverse survival rates. Patients in CD-1 and PR had the highest cumulative 3-year CR incidence at 73% and 60%, respectively. Lower 3-year CR incidences were seen in CD-2 (38%), HY (35%), LB (39%), MF (44%) and MS (36%). After the introduction of novel therapies, a significantly improved PFS was observed in the HY (HR=0.49, P<0.001), LB (HR=0.44, P=0.005) and MS (HR=0.29, P<0.001) subgroups. The CD-1, CD-2, MF and PR subgroups showed no significant changes of the PFS despite the introduction of these novel therapies. Representative Kaplan-Meier plots are shown in Figure 1 for HY and MS groups (improved PFS) and the PR subgroup (no improvement). Significantly longer OS was only observed in the MS subgroup (HR=0.44, P=0.002) (Figure 1). The time to CR was significantly improved in the subgroups HY (HR=0.41, P<0.001), MS (HR=0.44, P=0.02) and PR (HR=0.54, P=0.04). The other subgroups showed trends to an improved time to CR with HRs <0.65.
Figure 1. Progression free survival before (TT2−) and after (TT2+/TT3a/TT3b) the introduction of novel drugs.

The MS (A) and the HY (B) subgroup were selected as examples for subgroups with significantly improved PFS and the PR group (C) as an example for a subgroup that showed no improvement. The corresponding plots for OS are shown in D to F.
Impact of individual novel drugs on outcomes of molecular subgroups
The IMID thalidomide was introduced in the experimental arm, TT2+, of the TT2 trial (Supplemental Figure 1). Results of the comparison of TT2− to TT2+ suggest that the addition of thalidomide positively affected the PFS of HY, LB and MS (Figure 2). There was a trend to a better OS in HY (HR=0.68, P=0.16) and MS (HR=0.62, P=0.14) (Supplemental Figure 3) The HY subgroup was the only subgroup with a significantly improved time to CR (Figure 3). The PI bortezomib was introduced in TT3a in the induction, consolidation and maintenance phases of therapy. Results of Cox modeling suggest that the PFS of the CD-1 and the MS groups were improved in comparison to TT2+ (Figure 2). There was a trend for a better OS in the MS subgroup (HR=0.50, P=0.059) (Supplemental Figure 3), that became comparable to the CD-1, CD-2, HY and LB subgroups, which were associated with an estimated 5-year OS of at least 77% (Supplemental Table 2). In contrast, the MF and PR groups showed no significant improvement and remained the subgroups with the worst outcome in MM with a 5-year PFS estimate of 46% each and OS of 46% and 55%, respectively. The time to CR was significantly shortened in the CD-1 and MS subgroups (Figure 3).
Figure 2. Impact of novel drugs on progression free survival.
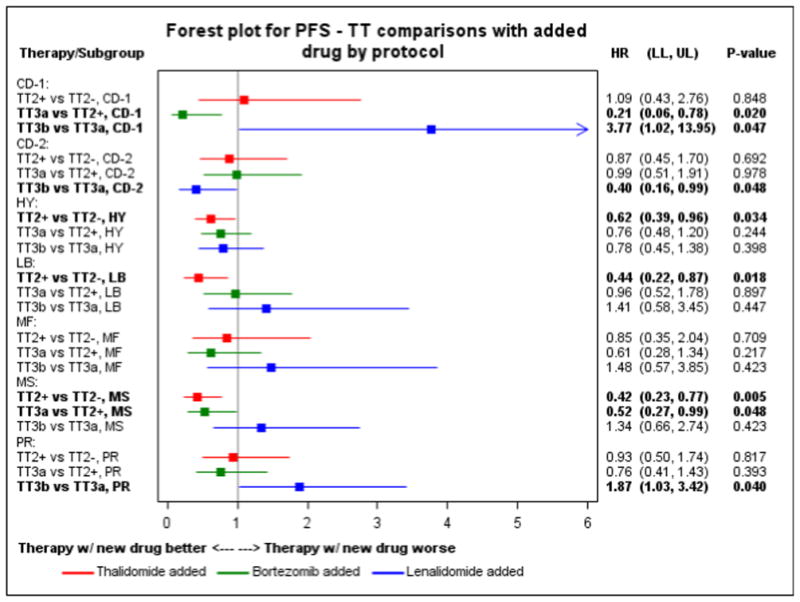
Forest plot for progression free survival comparisons between Total Therapies for each molecular subgroup.
Figure 3. Impact of novel drugs on time to complete remission.
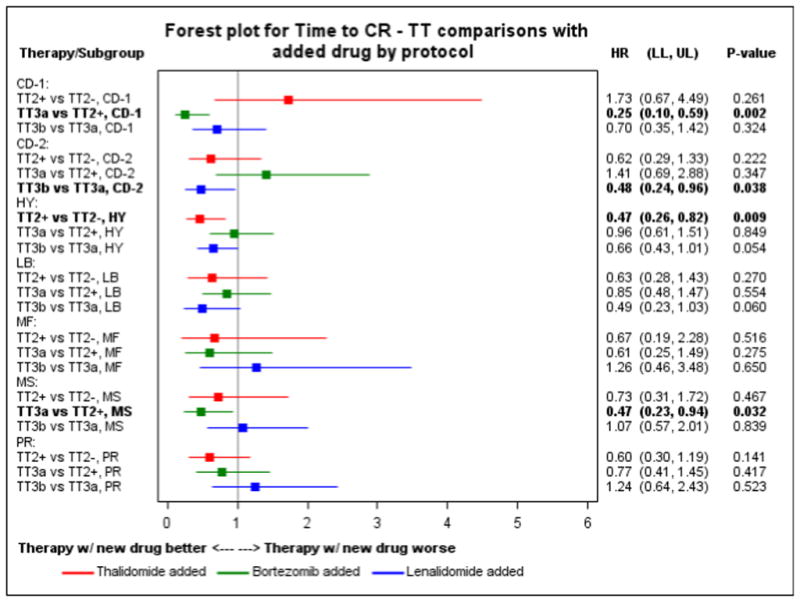
The figure shows a forest plot for comparison of time to complete remission between Total Therapies for each molecular subgroup.
In TT3b lenalidomide was used instead of thalidomide during maintenance treatment in combination with bortezomib. In comparison to TT3a, CD-1 and PR had a significantly worse PFS in TT3b whereas PFS for CD-2 was improved (Figure 2). A trend was also noted for a negative impact of the TT3b regimen on the OS of the CD-1 subgroup (Supplemental Figure 3). The time to CR was significantly shorter in the CD-2 subgroup and a trend toward a shorter time to CR was observed for HY and LB (Figure 3).
Association of subgroups with risk
GEP70-defined high risk (HiR) cases were not evenly distributed across molecular subgroups. More than 80% of them were assigned to the subgroups MS, MF, and PR. The overwhelming majority of cases in CD-2, HY and LB were classified as LoR (Supplemental Figure 4). Interestingly, even in cases classified as LoR (risk score<0.66), the molecular subgroups MS, MF and PR had elevated risk scores in comparison to the remaining groups (Supplemental Figure 5). FISH data for the 1q21 and the 17p12 locus were available for 858 and 692 cases treated in TT2 to TT5, respectively. The locus 1q21 was gained in at least 60% of MS, MF and PR cases (Supplemental Figure 6). Of note, gain(1q21) was frequently detectable in LB cases, a subgroup with only 3% HiR. Increased rates of del(17p12) were detected in CD-1, MF and PR (Supplemental Figure 7). The subgroups MF and PR also showed an enrichment of ISS III cases (Supplemental Figure 8).
These results suggest that the difference in outcome between the molecular subgroups is due to an enrichment of risk factors in MS, MF and PR and not linked to subgroup specific characteristics like MMSET or MAF overexpression per se. To account for the elevated risk score values in the LoR cases of MS, MF, and PR, we calculated a three-group risk predictor. Using the running log-rank test for the GEP70 score for PFS within the LoR TT2 population and validating the result with TT3 data, we determined an additional break point at 0.16. Splitting the data at the break points of 0.16 and 0.66 showed that PFS and OS were similar for all molecular subgroups in the respective risk group (Figure 4). This relationship indicated that an understanding of the impact of treatment on HiR and LoR MM might shed light on the basis of differences in the clinical course of molecular subgroups. As a result, we extended the survival and response analyses to risk groups.
Figure 4. Progression free survival in molecular subgroups according to risk status.

Using the running log-rank test for the GEP70 score for PFS within the low-risk TT2 population and validating the result with TT3 data, we calculated a three-group risk predictor with an additional break point at 0.16. We split the data at the additional break point and at 0.66. We combined the subgroups with a favorable outcome (CD-1, CD-2, HY, and LB) and compared their PFS to MS (significantly improved by novel drugs) and the unfavorable subgroups MF and PR in low risk (A), medium risk (B) and high risk (C) cases.
The impact of novel drugs on risk subgroups
In TT2− LoR cases had an estimated 5-year PFS and OS of 43% and 72%, whereas in HiR the values were lower with only 11% and 21% estimated 5-year PFS and OS, respectively; these differences were statistically significant (P<0.001 in both cases). In contrast, a similar cumulative 3-year CR incidence was seen in HiR (37%) and LoR (43%) MM. LoR was associated with a significantly better PFS (HR=0.65, P=0.001) in TT2+ when compared to TT2−, though no evidence of an improved OS (HR=0.82, P=0.2) was seen. For HiR cases, non-significant better PFS (HR=0.64, P=0.17) and OS (HR=0.73, P=0.34) were seen. TT3A significantly improved the PFS (HR=0.68, P=0.005) of LoR cases. The OS rates were not significantly better (HR=0.79, P=0.15). HiR cases showed no significant PFS or OS improvement. The MS molecular subgroup was an impressive exception. Treatment with a bortezomib including therapy significantly improved OS and PFS across the MS subgroup in both HiR and LoR cases. In TT3, HiR MS cases showed a similar 5-year survival estimate (31%) to LoR MS cases in TT2 (26%), and the improvement in PFS was significant for both TT3 HiR compared to TT2 HiR (P = 0.036) and for TT3 LoR compared to TT2 LoR (P < 0.001).
The impact of maintenance
We performed a landmark analysis from the start of maintenance to check whether maintenance with novel drugs improved PFS of risk groups. The number of cases included into this analysis is shown in Supplemental Table 3. The results indicate that the use of thalidomide and bortezomib during maintenance of TT2+ and TT3a respectively positively impacted the PFS of LoR cases. The use of lenalidomide instead of thalidomide during maintenance of TT3b did not further improve PFS of this risk group (Figure 5). HiR cases did not show a significant improvement of PFS or OS.
Figure 5. Progression free survival from maintenance.
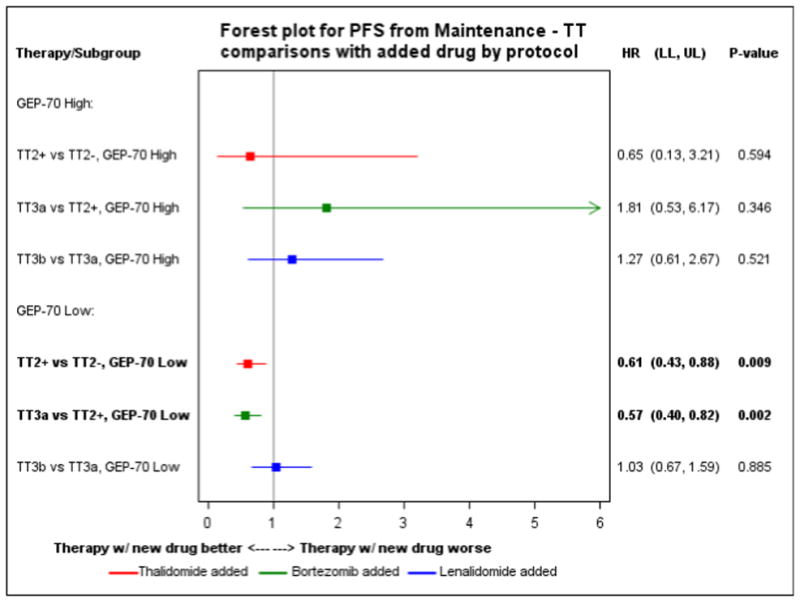
Forest plot for comparison of progression free survival from maintenance between Total Therapies for GEP70 high and low risk cases.
Assessment of risk status at relapse
We performed an analysis of 145 patients with risk status determined at presentation and relapse from TT2, TT3, TT4, and TT5, giving a total of 111 LoR and 34 HiR cases at presentation. At relapse, 33 (30%) of LoR switched to HiR, and 9 (26%) of the HiR cases presented as LoR. A Wilcoxon test showed that patients who were HiR at both baseline and relapse had significantly higher median GEP70 scores at relapse than patients who were LoR at baseline and HiR at relapse (p = 0.006). Similarly, patients who were LoR at both baseline and relapse had significantly lower GEP70 scores at relapse than patients who were HiR at baseline and LoR at relapse (Supplemental Figure 9, p = 0.02). According to the three-group GEP70 risk predictor that was introduced in this study 6 of 9 HiR/LoR (67%) but only 17 of 78 LoR/LoR (22%) cases had an intermediate risk profile (0.16 < Score < 0.66) at relapse (p=0.009).
HiR patients at relapse had a very poor outcome irrespective of risk status at baseline (Supplemental Figure 10). HiR cases that switched to LoR still showed an unfavorable survival. Only cases that were assigned to LoR at baseline and relapse had a better outcome.
Impact of a complete remission on the outcome of molecular and risk subgroups
In order to investigate the impact of a CR on the outcome of molecular and risk subgroups we performed a landmark analysis from 1 year after start of therapy for patients treated in TT2 and TT3 who achieved a CR in the 1st year compared to non-CR patients. The number of cases included into this analysis is shown in Supplemental Table 4 (molecular subgroups) and Supplemental Table 5 (risk subgroups). This analysis showed that a CR positively significantly impacted the PFS of all molecular subgroups except MF (Supplemental Figure 11) and was associated with a significantly improved OS in CD-2, LB and PR (Supplemental Figure 12). Attainment of CR in LoR cases was significantly associated with a better PFS and OS in comparison to non-CR LoR cases, whereas there was not no significant difference in PFS and OS between CR and non-CR HiR cases (Supplemental Figures 13 & 14).
DISCUSSION
Recently, we have shown that the introduction of IMiDs and PIs resulted in a significant improvement in outcome of MM patient in our TT trials3,4. In this work we show that the impact of treatment differs between molecular subtypes of MM and that GEP gives important information that can help in clinical decision-making and treatment selection.
Impact of novel drugs on molecular subgroups
HY, LB and MS were the molecular subgroups that mainly profited from the introduction of novel drugs and showed significant changes in PFS. With the exception of the MS subgroup, we could not detect improved OS rates in the molecular subgroups of MM. However, the non-uniformly application of drugs, such as carfilzomib or pomalidomide could have obscured differences in OS between TT trials.
The MS group that corresponds to cases with a t(4;14) was the molecular subgroup with the worst survival in TT2−. We show that over successive protocols the outcome of the MS group has improved substantially to the extent that it can now be considered standard risk. The change in outcome of this group seems to be related to the increasing exposure to the PI bortezomib. This improvement in outcome was seen across the MS subgroup in both HiR and LoR cases. It follows from this observation that all patients within the MS subgroup should receive treatment with proteasome inhibitor therapy irrespective of risk status. A recent study showed that higher cumulative bortezomib doses improved outcome of MM patients18. Future studies should address whether strategies maximizing exposure to PI can further improve outcome in the MS subgroup.
In contrast, the other two molecular subgroups with increased numbers of HiR cases, MF and PR, retained a poor outcome even after the introduction of novel drugs. While the MF group is only small, the deregulation of MAF in this group opens the potential to actively target it or its downstream signaling partners. The PR group has a number of important features, including markers of proliferation12. It is important to understand the mutational spectrum of this group to understand its pathogenesis. Superficially, it should be possible to target the proliferative nature of this group with cell cycle active drugs. The t(11;14) group of MM overexpresses CCND1 and is effectively split into 2 distinct groups by the UAMS clustering approach which recognizes a CD-1 and CD-2 set of cases. Both subgroups had similar outcomes before and after the introduction of novel drugs. In the analyses of individual TT protocols an improved PFS for the CD-1 group was seen in TT3a but a worse outcome in TT3b, indicating that CD-1 could have been improved by the addition of bortezomib but did not benefit further from the introduction of lenalidomide during maintenance. In contrast, CD-2 seemed to benefit from the addition of lenalidomide. Future studies should further address the question whether the impact of lenalidomide on outcome of these two subgroups differ. Importantly, the CD-2 group is characterized by the expression of CD20, which could potentially be targeted with antiCD20 antibodies.
Association of subgroups with risk status
The three groups MS, MF and PR contain 80% of HiR individuals (GEP70 > 0.66) but just 25% of LoR patients, and the distribution of the GEP70 score is in general shifted towards higher values in these three subgroups. In contrast, the CD-2, HY, and LB groups contain 68% of LoR patients but only 13% of HiR patients. Understanding the association of molecular subgroups with the GEP70 risk score would be of great value if we are to direct therapy appropriately. In this report we show that the high risk chromosomal aberrations del(17p) and gain(1q21) are not distributed evenly through the data but are enriched in the MS, MF and PR molecular subgroups. The observation that high risk CNA are seen more frequently in these more clinically aggressive subtypes suggest that these lesions are actually contributing to the GEP70 signature, an observation that is particularly relevant to gain(1q21). Recently, we have provided evidence that jumping translocations of 1q12 lead to the simultaneous gain(1q21) and del(17p) in MM with a t(4;14) indicating that the appearance of high risk aberrations in this subgroup is based on a common mechanism19. Future studies should apply molecular approaches like optical mapping and long range whole genome sequencing to investigate whether this mechanism also plays a role in development of HiR in other molecular subgroups. We have recently shown that the MF group has a tendency to acquire mutations as a consequence of APOBEC deregulation, another potential mechanism leading to HiR20. Last but not least, proliferation is linked to HiR and an independent risk factor15.
Despite the association with HiR, cases with t(4;14) or gain(1q21) frequently are classified as low risk and have a good outcome. Of note, 60% of cases of the prognostically favorable LB subgroup have a gain(1q21). In contrast to other molecular subgroups like CD-1, CD-2 and HY this group is not associated with one of the primary recurrent chromosomal aberrations but is defined by a low number of bone lesions12. These results are particularly relevant for the use of FISH for risk determination, because often cases are assigned to HiR based on the presence of only one HiR marker. We have previously shown that it is possible to improve risk prediction based on cytogenetic data by defining all HiR cytogenetic abnormalities and counting the number present in each case21. HiR cases as defined by the GEP70 in general have a very poor outcome, reflecting the way that the test was designed with >90% specificity for identification of HiR. Although GEP70 HiR associates with unfavorable advanced ISS stages and the presence of cytogenetic abnormalities, the GEP70 is an independent predictor (Supplementary Figures 15 & 16).
Usually, risk is determined at diagnosis. In this report we present an update of the risk determination at relapse22 and confirm that GEP at relapse provides important information. Whereas cases that were assigned to LoR at diagnosis but to HiR at relapse had a bad prognosis, cases with LoR at both time points showed superior survival. According to our data cases with HiR at diagnosis but LoR at relapse should be considered with caution as this observation was associated with poor outcome. In our study these cases still showed increased risk scores, explaining the poor prognosis of this group. Alternatively, spatial genomic heterogeneity could have impacted the test. Our recent comparison of GEP data of multiple paired samples showed differences in risk signatures, indicating the co-existence of HiR and LoR subclones (manuscript in preparation). Possibly, cells of a LoR subclone were collected at relapse in these patients.
Maintenance
A number of randomized studies have addressed the value of maintenance with lenalidomide and shown that it can improve OS and PFS23–25. Using a landmark approach from the time of maintenance we show that the addition of thalidomide significantly improved outcome of LoR cases from maintenance and that outcome of LoR was improved further by the addition of bortezomib. We could not detect a significant improvement for HiR cases but this may be due to a lack of statistical power.
Impact of response on outcome
The CD-1 and CD-2 groups have distinct natural histories with the CD-1 group going rapidly into remission in contrast to the CD-2 group where maximum response occurs significantly later (Figure 6). Despite this difference in achievement of CR the long-term outcome of both groups is similar. This information is therapeutically important because it can help in the interpretation of MRD data preventing over treatment of the CD-2 group, which frequently fails to enter a CR until sufficient follow up has occurred. In this study a CR does not significantly improve the outcome of the MF molecular subgroup and HiR cases, suggesting that these cases need particular clinical attention and are in need of new treatment options.
Figure 6. Time to complete remission.

The figure shows for the time to CR for CD-1, CD-2 and other molecular subgroups in TT2 and TT3 combined.
Conclusion
Molecular subgroups of MM have a distinct natural history and response to therapy which can be used to optimize treatment strategies. GEP can readily identify these molecular subgroups and risk status in a time frame that will allow treatment to be modified accordingly. In addition, GEP data can form the framework within which newer technologies such as mutational analysis with next generation sequencing technologies can be integrated. HiR MM is the major therapeutic challenge in MM and developing strategies to improve outcome in this group is critical.
Supplementary Material
Supplemental Figure 1. Overview of the trial designs.
Supplemental Figure 2. Distribution of the molecular subgroups in each Total Therapy trial.
Supplemental Figure 3. Impact of novel drugs on overall survival in molecular subgroups.
Supplemental Figure 4. Number of HiR cases as defined by the GEP70 signature in molecular subgroups in TT2, TT3, TT4 and TT5 combined.
Supplemental Figure 5. Distribution of GEP70 score in low risk cases by molecular subgroup in TT2, TT3, TT4 and TT5 combined.
Supplemental Figure 6. Percentage of cases with a gain of 1q21 in molecular subgroups.
Supplemental Figure 7. Percentage of cases with a del(17p) in molecular subgroups.
Supplemental Figure 8. Distribution of ISS stages in molecular subgroups.
Supplemental Figure 9. GEP70 scores at relapse for patients who were LoR at both baseline and relapse (blue box) and patients who were HiR at baseline and LoR at relapse (red box).
Supplemental Figure 10. Overall survival after relapse according to GEP70 risk status determined at baseline and relapse.
Supplemental Figure 11. Forest plot for progression free survival by molecular subgroup from 1 year after start of therapy for patients treated in TT2 and TT3 who achieved a CR in the 1st year compared to non-CR patients.
Supplemental Figure 12. Forest plot for overall survival by molecular subgroup from 1 year after start of therapy for patients treated in TT2 and TT3 who achieved a CR in the 1st year compared to non-CR patients.
Supplemental Figure 13. Forest plot for progression free survival by GEP70 risk status from 1 year after start of therapy for patients treated in TT2 and TT3 who achieved a CR in the 1st year compared to non-CR patients.
Supplemental Figure 14. Forest plot for overall survival by GEP70 risk status from 1 year after start of therapy for patients treated in TT2 and TT3 who achieved a CR in the 1st year compared to non-CR patients.
Supplemental Figure 15. Overall survival of MM patients treated in TT2–5 stratified by GEP70 and ISS.
Supplemental Figure 16. Relationship between GEP70 HiR MM, cytogenetic abnormalities and advanced ISS stage and overall survival of MM patients treated in TT2–5 stratified by GEP70 and presence or absence of cytogenetic abnormalities.
Supplemental Table 1. Patient characteristics.
Supplemental Table 2. Outcome of patients in TT2 and TT3 by molecular subgroup.
Supplemental Table 3. Number of GEP70 high and low risk cases included in the landmark analysis from the start of maintenance.
Supplemental Table 4. Number of cases included in the analysis of the impact of a complete remission on the outcome of molecular subgroups.
Supplemental Table 5. Number of cases included in the analysis of the impact of a complete remission on the outcome of GEP70 risk subgroups.
Acknowledgments
This manuscript was supported by a grant from the National Institutes of Health (P01CA055819).
Footnotes
AUTHOR CONTRIBUTIONS
GJM and NW conceived and planned the project; AR, CS, AH and NW conducted statistical analyses; CH, ST and NW interpreted results; ET performed FISH analyses; patients were accrued by BB, CH, FD, FvR, GJM, ST and MZ; all authors wrote and approved the manuscript.
Supplementary Information is available at Leukemia’s website (http://www.nature.com/leu).
CONFLICT OF INTEREST
BB and CJH have received research funding from Celgene and Millennium. BB is a consultant to Celgene and Millennium, and is a co-inventor on patents and patent applications related to use of GEP in cancer medicine that have been licensed to Signal Genetics Inc. GJM has participated in advisory boards for, received payment for lectures and development of educational presentations from, and has received travel support from Celgene, Novartis, Merck, and Johnson & Johnson. FED has participated in advisory boards and spoken at meetings for Celgene, Ortho Biotech, and Novartis, and has received travel support to attend meetings from Celgene and Ortho Biotech. The remaining authors declare no conflict of interest.
References
- 1.Kyle RA, Rajkumar SV. Multiple myeloma. N Engl J Med. 2004;351:1860–73. doi: 10.1056/NEJMra041875. [DOI] [PubMed] [Google Scholar]
- 2.Barlogie B, Tricot GJ, van Rhee F, Angtuaco E, Walker R, Epstein J, et al. Long-term outcome results of the first tandem autotransplant trial for multiple myeloma. Br J Haematol. 2006;135:158–64. doi: 10.1111/j.1365-2141.2006.06271.x. [DOI] [PubMed] [Google Scholar]
- 3.Barlogie B, Tricot G, Anaissie E, Shaughnessy J, Rasmussen E, van Rhee F, et al. Thalidomide and hematopoietic-cell transplantation for multiple myeloma. N Engl J Med. 2006;354:1021–30. doi: 10.1056/NEJMoa053583. [DOI] [PubMed] [Google Scholar]
- 4.Pineda-Roman M, Zangari M, Haessler J, Anaissie E, Tricot G, van Rhee F, et al. Sustained complete remissions in multiple myeloma linked to bortezomib in total therapy 3: comparison with total therapy 2. Br J Haematol. 2008;140:625–34. doi: 10.1111/j.1365-2141.2007.06921.x. [DOI] [PMC free article] [PubMed] [Google Scholar]
- 5.Chesi M, Bergsagel PL. Advances in the pathogenesis and diagnosis of multiple myeloma. Int J Lab Hematol. 2015;37(Suppl 1):108–14. doi: 10.1111/ijlh.12360. [DOI] [PubMed] [Google Scholar]
- 6.Bergsagel PL, Mateos M-V, Gutierrez NC, Rajkumar SV, San Miguel JF. Improving overall survival and overcoming adverse prognosis in the treatment of cytogenetically high-risk multiple myeloma. Blood. 2013;121:884–92. doi: 10.1182/blood-2012-05-432203. [DOI] [PMC free article] [PubMed] [Google Scholar]
- 7.Sawyer JR. The prognostic significance of cytogenetics and molecular profiling in multiple myeloma. Cancer Genet. 2011;204:3–12. doi: 10.1016/j.cancergencyto.2010.11.002. [DOI] [PubMed] [Google Scholar]
- 8.Bergsagel PL, Kuehl WM. Chromosome translocations in multiple myeloma. Oncogene. 2001;20:5611–22. doi: 10.1038/sj.onc.1204641. [DOI] [PubMed] [Google Scholar]
- 9.Walker BA, Boyle EM, Wardell CP, Murison A, BBD, Dahir NB, et al. Mutational spectrum, copy number changes and outcome: result of the sequencing study of 463 newly diagnosed myeloma trial patients. J Clin Oncol. 2015 doi: 10.1200/JCO.2014.59.1503. [DOI] [PMC free article] [PubMed] [Google Scholar]
- 10.Morgan GJ, Walker BA, Davies FE. The genetic architecture of multiple myeloma. Nat Rev Cancer. 2012;12:335–48. doi: 10.1038/nrc3257. [DOI] [PubMed] [Google Scholar]
- 11.Bergsagel PL, Kuehl WM, Zhan F, Sawyer J, Barlogie B, Shaughnessy J. Cyclin D dysregulation: An early and unifying pathogenic event in multiple myeloma. Blood. 2005;106:296–303. doi: 10.1182/blood-2005-01-0034. [DOI] [PMC free article] [PubMed] [Google Scholar]
- 12.Zhan F, Huang Y, Colla S, Stewart JP, Hanamura I, Gupta S, et al. The molecular classification of multiple myeloma. Blood. 2006;108:2020–8. doi: 10.1182/blood-2005-11-013458. [DOI] [PMC free article] [PubMed] [Google Scholar]
- 13.Shaughnessy JD, Zhan F, Burington BE, Huang Y, Colla S, Hanamura I, et al. A validated gene expression model of high-risk multiple myeloma is defined by deregulated expression of genes mapping to chromosome 1. Blood. 2007;109:2276–84. doi: 10.1182/blood-2006-07-038430. [DOI] [PubMed] [Google Scholar]
- 14.Kuiper R, Broyl A, de Knegt Y, van Vliet MH, van Beers EH, van der Holt B, et al. A gene expression signature for high-risk multiple myeloma. Leukemia. 2012;26:2406–13. doi: 10.1038/leu.2012.127. [DOI] [PubMed] [Google Scholar]
- 15.Hose D, Rème T, Hielscher T, Moreaux J, Messner T, Seckinger A, et al. Proliferation is a central independent prognostic factor and target for personalized and risk-adapted treatment in multiple myeloma. Haematologica. 2011;96:87–95. doi: 10.3324/haematol.2010.030296. [DOI] [PMC free article] [PubMed] [Google Scholar]
- 16.Decaux O, Lodé L, Magrangeas F, Charbonnel C, Gouraud W, Jézéquel P, et al. Prediction of survival in multiple myeloma based on gene expression profiles reveals cell cycle and chromosomal instability signatures in high-risk patients and hyperdiploid signatures in low-risk patients: a study of the Intergroupe Francophone du Myélom. J Clin Oncol. 2008;26:4798–805. doi: 10.1200/JCO.2007.13.8545. [DOI] [PubMed] [Google Scholar]
- 17.Shaughnessy J, Tian E, Sawyer J, Bumm K, Landes R, Badros A, et al. High incidence of chromosome 13 deletion in multiple myeloma detected by multiprobe interphase FISH. Blood. 2000;96:1505–11. [PubMed] [Google Scholar]
- 18.Mateos MV, Richardson PG, Dimopoulos MA, Palumbo A, Anderson KC, Shi H, et al. Effect of cumulative bortezomib dose on survival in multiple myeloma patients receiving bortezomib-melphalan-prednisone in the phase III VISTA study. Am J Hematol. 2015;90:314–9. doi: 10.1002/ajh.23933. [DOI] [PubMed] [Google Scholar]
- 19.Sawyer JR, Tian E, Heuck CJ, Epstein J, Johann DJ, Swanson CM, et al. Jumping translocations of 1q12 in multiple myeloma: a novel mechanism for deletion of 17p in cytogenetically defined high-risk disease. Blood. 2014;123:2504–12. doi: 10.1182/blood-2013-12-546077. [DOI] [PMC free article] [PubMed] [Google Scholar]
- 20.Walker BA, Wardell CP, Murison A, Boyle EM, Begum DB, Dahir NM, et al. APOBEC family mutational signatures are associated with poor prognosis translocations in multiple myeloma. Nat Commun. 2015;6:6997. doi: 10.1038/ncomms7997. [DOI] [PMC free article] [PubMed] [Google Scholar]
- 21.Boyd KD, Ross FM, Chiecchio L, Dagrada GP, Konn ZJ, Tapper WJ, et al. A novel prognostic model in myeloma based on co-segregating adverse FISH lesions and the ISS: analysis of patients treated in the MRC Myeloma IX trial. Leukemia. 2012;26:349–55. doi: 10.1038/leu.2011.204. [DOI] [PMC free article] [PubMed] [Google Scholar]
- 22.Nair B, Shaughnessy JD, Zhou Y, Astrid-Cartron M, Qu P, van Rhee F, et al. Gene expression profiling of plasma cells at myeloma relapse from tandem transplantation trial Total Therapy 2 predicts subsequent survival. Blood. 2009;113:6572–5. doi: 10.1182/blood-2009-02-207803. [DOI] [PMC free article] [PubMed] [Google Scholar]
- 23.McCarthy PL, Owzar K, Hofmeister CC, Hurd DD, Hassoun H, Richardson PG, et al. Lenalidomide after stem-cell transplantation for multiple myeloma. N Engl J Med. 2012;366:1770–81. doi: 10.1056/NEJMoa1114083. [DOI] [PMC free article] [PubMed] [Google Scholar]
- 24.Attal M, Lauwers-Cances V, Marit G, Caillot D, Moreau P, Facon T, et al. Lenalidomide maintenance after stem-cell transplantation for multiple myeloma. N Engl J Med. 2012;366:1782–91. doi: 10.1056/NEJMoa1114138. [DOI] [PubMed] [Google Scholar]
- 25.Palumbo A, Cavallo F, Gay F, Di Raimondo F, Ben Yehuda D, Petrucci MT, et al. Autologous transplantation and maintenance therapy in multiple myeloma. N Engl J Med. 2014;371:895–905. doi: 10.1056/NEJMoa1402888. [DOI] [PubMed] [Google Scholar]
Associated Data
This section collects any data citations, data availability statements, or supplementary materials included in this article.
Supplementary Materials
Supplemental Figure 1. Overview of the trial designs.
Supplemental Figure 2. Distribution of the molecular subgroups in each Total Therapy trial.
Supplemental Figure 3. Impact of novel drugs on overall survival in molecular subgroups.
Supplemental Figure 4. Number of HiR cases as defined by the GEP70 signature in molecular subgroups in TT2, TT3, TT4 and TT5 combined.
Supplemental Figure 5. Distribution of GEP70 score in low risk cases by molecular subgroup in TT2, TT3, TT4 and TT5 combined.
Supplemental Figure 6. Percentage of cases with a gain of 1q21 in molecular subgroups.
Supplemental Figure 7. Percentage of cases with a del(17p) in molecular subgroups.
Supplemental Figure 8. Distribution of ISS stages in molecular subgroups.
Supplemental Figure 9. GEP70 scores at relapse for patients who were LoR at both baseline and relapse (blue box) and patients who were HiR at baseline and LoR at relapse (red box).
Supplemental Figure 10. Overall survival after relapse according to GEP70 risk status determined at baseline and relapse.
Supplemental Figure 11. Forest plot for progression free survival by molecular subgroup from 1 year after start of therapy for patients treated in TT2 and TT3 who achieved a CR in the 1st year compared to non-CR patients.
Supplemental Figure 12. Forest plot for overall survival by molecular subgroup from 1 year after start of therapy for patients treated in TT2 and TT3 who achieved a CR in the 1st year compared to non-CR patients.
Supplemental Figure 13. Forest plot for progression free survival by GEP70 risk status from 1 year after start of therapy for patients treated in TT2 and TT3 who achieved a CR in the 1st year compared to non-CR patients.
Supplemental Figure 14. Forest plot for overall survival by GEP70 risk status from 1 year after start of therapy for patients treated in TT2 and TT3 who achieved a CR in the 1st year compared to non-CR patients.
Supplemental Figure 15. Overall survival of MM patients treated in TT2–5 stratified by GEP70 and ISS.
Supplemental Figure 16. Relationship between GEP70 HiR MM, cytogenetic abnormalities and advanced ISS stage and overall survival of MM patients treated in TT2–5 stratified by GEP70 and presence or absence of cytogenetic abnormalities.
Supplemental Table 1. Patient characteristics.
Supplemental Table 2. Outcome of patients in TT2 and TT3 by molecular subgroup.
Supplemental Table 3. Number of GEP70 high and low risk cases included in the landmark analysis from the start of maintenance.
Supplemental Table 4. Number of cases included in the analysis of the impact of a complete remission on the outcome of molecular subgroups.
Supplemental Table 5. Number of cases included in the analysis of the impact of a complete remission on the outcome of GEP70 risk subgroups.