

Abstract
Based on its marked overexpression in multiple malignancies and its roles in promoting cell survival and proliferation, survivin is an attractive candidate for targeted therapy. Towards this end, a detailed understanding of the mechanisms regulating survivin expression in different cancer cells will be critical. We have previously shown that the RNA-binding protein (RBP) CUG-BP1 is overexpressed in esophageal cancer cells and post-transcriptionally regulates survivin in these cells. The objective of this study was to investigate the role of microRNAs (miRs) in regulating survivin expression in esophageal cancer cells. Using miR expression profiling analysis, we found that miR-214-3p is one of the most markedly downregulated miRs in two esophageal squamous cancer cell lines compared to esophageal epithelial cells. Interestingly, using miR target prediction programs, both survivin and CUG-BP1 mRNA were found to contain potential binding sites for miR-214-3p. Forced expression of miR-214-3p in esophageal cancer cells leads to a decrease in the mRNA and protein levels of both survivin and CUG-BP1. This effect is due to decreased mRNA stability of both targets. By contrast, silencing miR-214-3p in esophageal epithelial cells leads to an increase in both survivin and CUG-BP1 mRNA and protein. To determine whether the observed effect of miR-214-3p on survivin expression was direct, mediated through CUG-BP1, or both, binding studies utilizing biotin pull-down assays and heterologous luciferase reporter constructs were performed. These demonstrated that the mRNA of survivin and CUG-BP1 each contain two functional miR-214-3p binding sites as confirmed by mutational analysis. Finally, forced expression of miR-214-3p enhances the sensitivity of esophageal cancer cells to Cisplatin-induced apoptosis. This effect is abrogated with rescue expression of survivin or CUG-BP1. These findings suggest that miR-214-3p acts as a tumor suppressor and that its downregulation contributes to chemoresistance in esophageal cancer cells by targeting both survivin and CUG-BP1.
Keywords: miR-214-3p, Survivin, CUG-BP1, Esophageal Cancer, Cisplatin, mRNA stability
Introduction
Resistance to chemotherapy-induced apoptosis is a crucial mechanism for tumor cell survival [1]. Survivin, a member of the Inhibitor of Apoptosis Protein (IAP) family, has been shown to be overexpressed in multiple malignancies, including esophageal cancer [2, 3]. In esophageal cancer cell lines, downregulation of survivin significantly enhances the sensitivity of these cells to chemotherapy-induced apoptosis [4]. Furthermore, failure to downregulate survivin following neo-adjuvant chemoradiotherapy has been correlated with decreased survival in esophageal cancer patients [5]. Coupled with the fact that it is not expressed in most normal tissues, survivin is an enticing candidate for targeted therapy in esophageal cancer.
A thorough understanding of the mechanisms regulating survivin overexpression in esophageal cancer cells will be essential for optimizing therapeutic strategies. Post-transcriptional regulatory processes mediated by trans-acting factors such as RBPs, miRs, and long non-coding RNAs, play important roles in the control of gene expression in cancer cells [6-8]. These factors interact with multiple gene products, some of which may be involved in coordinated networks [9]. Identifying important regulators of survivin may reveal crucial nodal agents that modulate the expression of multiple targets involved in esophageal carcinogenesis.
We have previously shown that the RBP CUG-BP1 plays an important role in regulating the overexpression of survivin in esophageal cancer cells by stabilizing its mRNA [10]. Although additional data on the relationship between other RBPs and survivin is scarce, several reports exist regarding the regulation of survivin by various miRs, although none exist in esophageal cancer cells. miR-34a has been shown to be downregulated in both gastric cancer and laryngeal squamous cell cancer [11-12]. Overexpression of miR-34a in these cell lines resulted in decreased survivin expression, which led to decreased proliferation and increased apoptosis. Expression of miR-203 has been shown to be markedly attenuated in prostate, pancreas, and hepatocellular cancer (HCC) cell lines [13-15]. Ectopic expression of miR-203 in these cells leads to decreased survivin expression with an associated reduction in cellular proliferation and enhancement in sensitivity to chemotherapy-induced apoptosis. Given the cell type-specific nature of the interaction between survivin and miRs, the goal of this study was to assess global miR expression in two esophageal squamous cancer cell lines compared to esophageal epithelial cells. miR target prediction models were employed to determine whether any of the most markedly downregulated miRs could interact with survivin mRNA. Functional, binding, and phenotypic assays were performed to characterize this interaction.
Results
miR-214-3p expression is markedly decreased in esophageal cancer cell lines
Global miR expression in human esophageal epithelial (hESO) cells and the human esophageal squamous cell cancer lines TE7 and TE10 was determined by array analysis using the 7th generation miR Array (Exiqon, Denmark). Expression levels of approximately 2,000 distinct human miRs were examined. Four hundred twenty-four miRs were found to be differentially expressed above the threshold level and formed the basis for the subsequent analysis. When the 30 miRs with the greatest magnitude of differential expression between the cancer cells and epithelial cells were analyzed, 18 were found to share similar expression patterns in both TE7 and TE10 cells. A heat map depicting the two-way hierarchical clustering analysis of these 18 miRs is depicted in Figure 1A. In Table 1, these 18 miRs are grouped into the 11 whose expression is most markedly downregulated in the cancer cells lines (a) and the 7 whose expression is most upregulated compared to the hESO cells (b).
Figure 1.
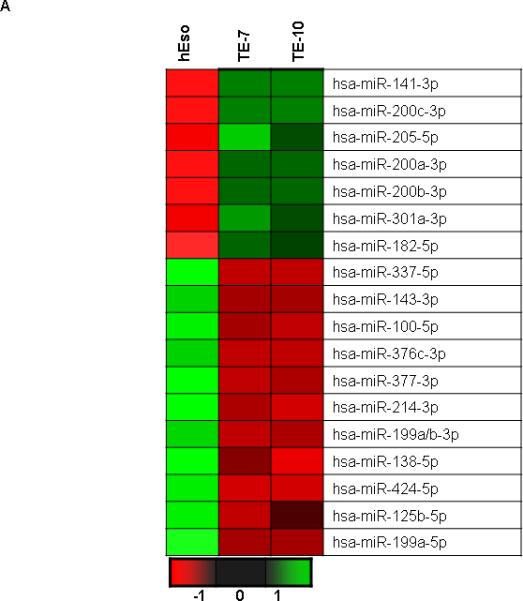
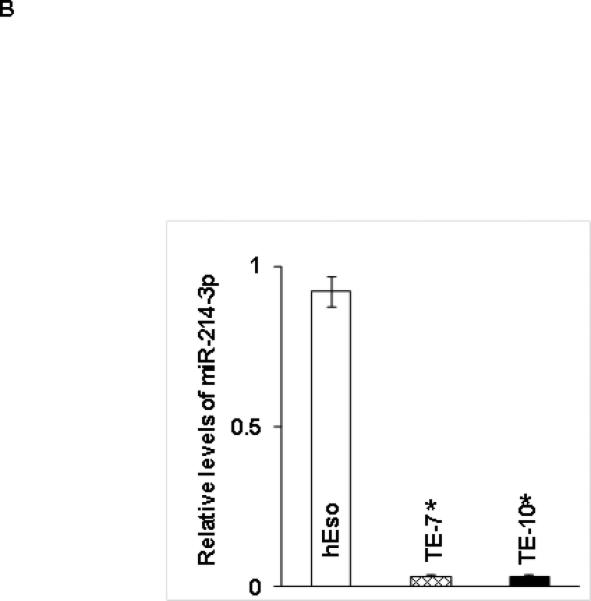
Baseline miR levels in human esophageal cell lines. A. Representative heat map depiction of miRs most differentially expressed in both TE7 and TE10 cells compared to hESO cells. Each row represents a miR and each column represents a cell line. The color scale illustrates the relative expression level of miRs. Red color represents an expression level below the reference channel, and green color represents expression higher than reference. B. Validation of miR-214-3p expression levels in hESO, TE7 and TE10 cells by q-PCR. Representative experiment of three independent experiments. Error bars represents ± S.D. and statistical significance based on a two-tailed Student's t test is indicated by * (p < 0.05).
Table 1.
Fold changes in miRs that are (a) most down-regulated and that are (b) most upregulated in both esophageal cancer cell lines TE7 and TE10 compared to hESO cells.
| a | ||
|---|---|---|
| MicroRNA | Log-Fold Change | |
| TE10 | TE7 | |
| hsa-miR-199a-5p | −4.455 (p=.003) | −4.421 (p=0.005) |
| hsa-miR-125b-5p | −3.548 (p=0.001 | −4.383 (p=0.003) |
| hsa-miR-424-5p | −3.501 (p=0.005) | −3.358 (p=0.0004) |
| hsa-miR-138-5p | −3.495 (p=0.001) | −2.952 (p=0.004) |
| hsa-miR-199a/b-3p | −3.334 (0.001) | −3.614 (p=0.005) |
| hsa-miR-214-3p | −3.273 (0.0002) | −3.235 (0.005) |
| hsa-miR-377-3p | −3.209 (p=0.001) | −3.349 (0.016) |
| hsa-miR-376c-3p | −3.167 (p=0.003) | −3.259 (0.012) |
| hsa-miR-100-5p | −3.052 (p=0.0004) | −3.493 (0.001) |
| hsa-miR-143-3p | −3.025 (p=0.005) | −3.176 (0.005) |
| hsa-miR-337-5p | −2.449 (p=0.003) | −2.542 (0.0002) |
| b | ||
|---|---|---|
| MicroRNA | Log-Fold Change | |
| TE10 | TE7 | |
| hsa-miR-141-3p | 5.589 (p=0.0001) | 5.703 (p=0.0004) |
| hsa-miR-200c-3p | 5.295 (p=0.0001) | 5.262 (p=0.001) |
| hsa-miR-205-5p | 5.063 (p=0.001) | 6.632 (p=0.002) |
| hsa-miR-200a-3p | 4.338 (p=0.0001) | 4.929 (p=0.002) |
| hsa-miR-200b-3p | 3.972 (0.001) | 4.443 (p=0.003) |
| hsa-miR-301a-3p | 2.443 (0.001) | 3.382 (p=0.003) |
| hsa-miR-182-5p | 2.989 (0.001) | 2.610 (p=0.005) |
Based on bioinformatics analysis, mir-214-3p is predicted to bind with strong affinity to both survivin and CUG-BP1 mRNA. As seen in Table 1a, miR-214-3p is dramatically downregulated in both TE7 and TE 10 cells compared to hESO cells, with a log fold change of approximately −3 in each cell line. In order to confirm these findings, total RNA was harvested from all three cell lines and real-time PCR (q-PCR) analysis was performed to measure miR-214-3p levels. As seen in Figure 1B, these results confirm that miR-214-3p levels are significantly decreased in TE7 and TE10 cells compared to hESO cells.
Modulating miR-214-3p levels leads to alterations in both survivin and CUG-BP1 protein expression
Because basal levels of miR-214-3p are low in TE7 and TE10 cells, transfection of premiR-214-3p into these cells was performed in order to assess the effects on survivin and CUGBP1 protein expression. In reciprocal experiments, anti-miR-214-3p was employed to reduce miR-214-3p levels in hESO cells. As shown in Figure 2A, transfection efficiency of pre-miR-214-3p was robust in both TE7 and TE10 cells (a). Similarly, transfection of anti-miR-214-3p was very effective in reducing miR-214-3p levels in hESO cells (b). Following successful transfection of pre-miR-214-3p, both survivin and CUG-BP1 protein levels are markedly decreased in TE7 and TE10 cells (Figure 2B a,b). Of note, there was no effect on protein levels of the RBP HuR, which has also been shown to regulate survivin expression [16]. Conversely, both survivin and CUG-BP1 protein levels were increased in hESO cells following transfection of anti-miR-214-3p (Figure 2B c). There was no change in HuR expression following silencing of miR-214-3p in hESO cells.
Figure 2.
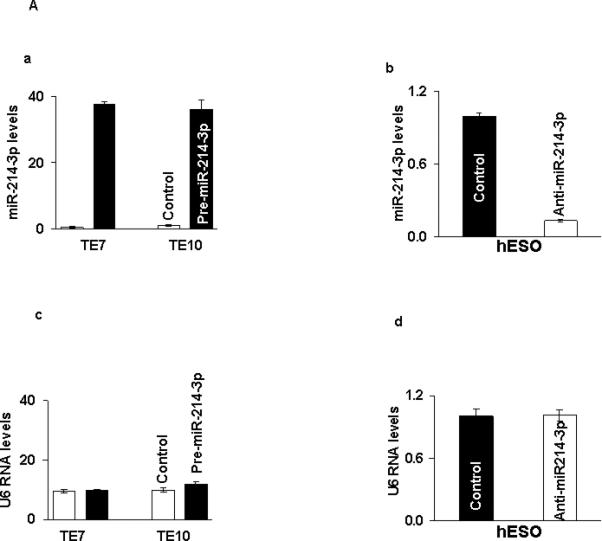
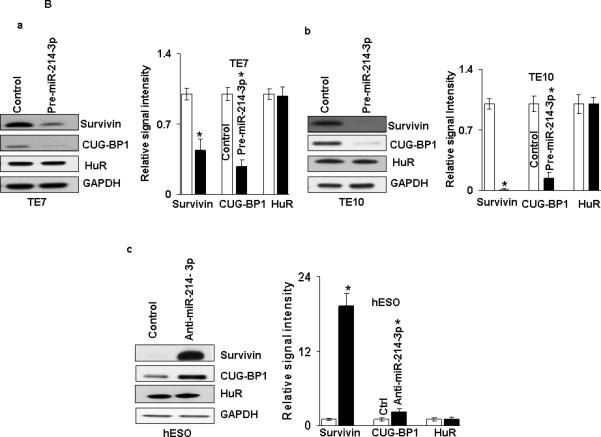
miR-214-3p negatively regulates survivin and CUG-BP1 expression in human esophageal cell lines. A. Cells were transfected with control miR or (a) with 12 nM pre-miR-214-3p (TE7 & TE10) or (b) with 25 nM anti-miR-214-3p (hESO). Forty eight hours post-transfection, levels of miR-214-3p and U6 RNA (c, d) were measured by q-PCR. Values are mean ± SD from three independent sets of experiment in triplicate. B. In similar experiments, whole cell lysates were isolated and subjected to western blot analysis with indicated antibodies. (a) Changes in survivin, CUG-BP1, and HuR protein expression after pre-miR-214-3p transfection in (a) TE7 and (b) TE10 cells. (c) Changes in above mentioned protein expression after silencing miR-214-3p in hESO cells. Representative immunoblots of three independent experiments in all the cell lines. The adjacent bar diagrams for relative protein signal intensity are the mean signal intensity of three separate immunoblots shown in a, b and c. Signal intensity of target protein is determined and is normalized by signal intensity of GAPDH. Relative signal intensity is calculated compare to control and is shown as bar diagram. Mean ± SD from three independent experiments. Asterisk, statistical significance based on two-tailed Student's t test. Signal intensity is determined using Bio-RAD image lab quantification software.
miR-214-3p reduces both survivin and CUG-BP1 mRNA stability
To further investigate the mechanism by which miR-214-3p affects survivin and CUGBP1 protein expression, levels of survivin and CUG-BP1 mRNA were assessed following overexpression of pre-miR-214-3p in TE7 and TE10 cells, as well as following transfection of anti-miR-214-3p in hESO cells. As seen in Figure 3A, transfection of pre-miR-214-3p was associated with a decrease in both survivin and CUG-BP1 mRNA levels in both TE7 and TE10 cells. In hESO cells, reduction of miR-214-3p expression led to an increase in both survivin and CUG-BP1 mRNA levels (Figure 3B).
Figure 3.
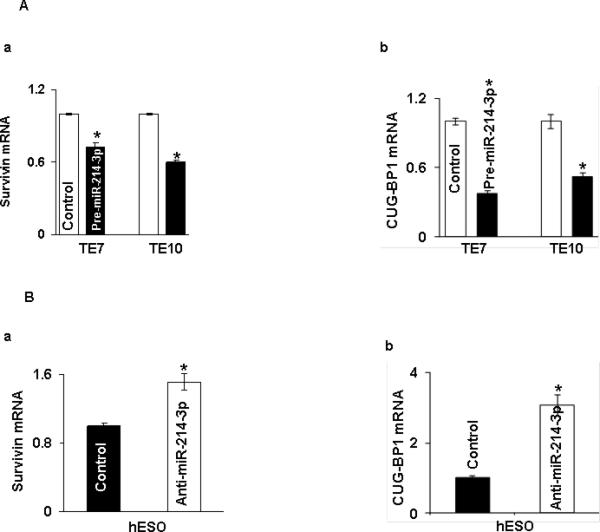

Effect of miR-214-3p modulation on survivin and CUG-BP1 mRNA levels. A. Changes in levels of (a) survivin and (b) CUG-BP1 mRNAs in TE7 and TE10 cells following transfection of pre-miR-214-3p. B. Levels of (a) survivin and (b) CUG-BP1 mRNA in hESO cells after transfection of anti-miR-214-3p. In these experiments, 48 hours post-transfection, total RNA was extracted and levels of survivin and CUG-BP1 were measured by q-PCR. Mean of three biological and technical replicates, asterisk, statistical significance (p< 0.05) based on a two-tailed Student's t test. C. Stability of (a) survivin and (b) CUG-BP1 mRNAs in TE7 cells following transfection of pre-miR-214-3p. D. Stability of (a) survivin and (b) CUG-BP1 mRNA in hESO cells after silencing miR-214-3p. Total RNA was isolated at indicated time points after administration of Actinomycin D (0.2μM) and the remaining levels of survivin and CUG-BP1 mRNAs were measured by q-PCR. Levels were normalized with GAPDH. The half-life was calculated from the first order equation t1/2 = ln2/k. Each point is the mean ± S.D. of three separate experiments.
Figure 3C depicts stability of both survivin and CUG-BP1 mRNA following transfection of pre-miR-214-3p in TE7 cells. In these experiments, 24 hours following transfection, cells are exposed to 0.2 μM of Actinomycin D to prevent further transcription. Total cellular RNA is harvested at specified time points and levels of target mRNA are measured by q-PCR. As seen in these curves, both survivin and CUG-BP1 mRNAs are destabilized following pre-miR-214-3p transfection. The stability curves in Figure 3D demonstrate enhanced stability of both survivin and CUG-BP1 mRNA following silencing of miR-214-3p in hESO cells.
miR 214-3p binds to both survivin and CUG-BP1 mRNA
As it was not clear whether the observed effect of miR-214-3p on survivin mRNA and protein expression resulted from a direct interaction with survivin mRNA, indirectly through an interaction with CUG-BP1 mRNA, or both, we next sought to determine whether miR-214-3p bound to both survivin and CUG-BP1 mRNA. As seen in Figure 4A, there are 3 predicted miR-214-3p binding sites in the 3’ untranslated region (UTR) of survivin mRNA. For CUG-BP1 mRNA, there are 5 predicted binding sites for miR-214-3p. Two are located in the coding region (CR) and 3 are found in the 3’ UTR. As a first step in the binding analysis, following transfection of biotin-labeled miR-214-3p into TE7 cells, cell lysates were exposed to avidin-coated beads. RNA was harvested from the pull-down material and amplified with survivin, CUG-BP1 and HuR probes by q-PCR. A biotin-labelled scrambled miR served as a control in these experiments. The levels of survivin mRNA and CUG-BP1 mRNA were markedly elevated in the pull-down material isolated from TE7 cells following transfection with biotin-labeled miR-214-3p compared to control (Figure 4B). There was no difference in the levels of HuR mRNA.
Figure 4.
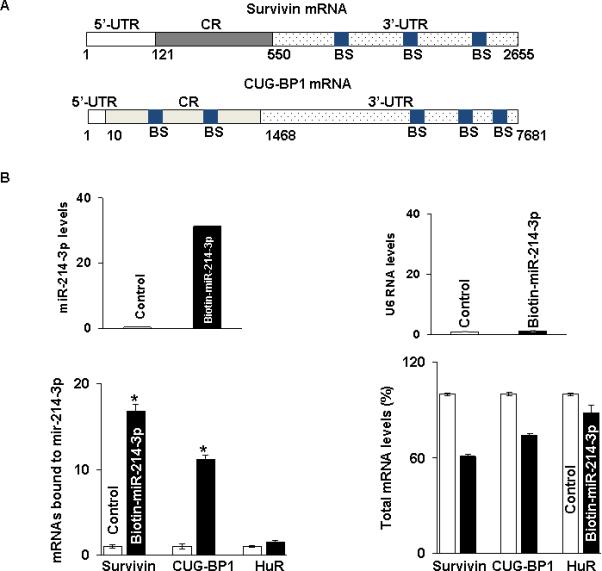
Association of miR-214-3p with survivin and CUG-BP1 mRNA. A. Schematic representation of survivin and CUG-BP1 mRNA. (BS) indicates predicted binding sites for miR-214-3p. B. Levels of miR-214-3p (Top panel, left) and U6 RNA (Top panel, right) 48 hours following transfection of 50 nM biotinylated-miR-214-3p as measured by q-PCR analysis. Levels of survivin, CUG-BP1, and HuR mRNA in the materials pulled down by biotin-miR-214-3p (Bottom panel, left) and levels of total input mRNAs (Bottom panel, right) measured by q-PCR. The enrichment of miR was calculated as follows: miR pull-down/control pull-down (X), miR input/control input (Y), Fold binding = X/Y. Representative bar diagram from three independent experiments, each set of experiment was done in triplicates. Error bars represent mean ±S.D. and * stands for statistically significant based on two-tailed Student's t test where p < 0.05.
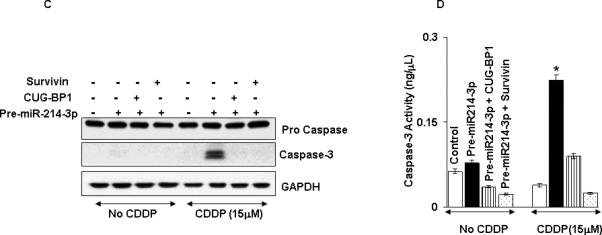
In order to determine which potential binding sites in survivin mRNA were being utilized for binding with miR-214-3p, 5 fragments were PCR amplified and separately sub-cloned into luciferase reporter vectors (Figure 5A). One fragment (FL 3’UTR) contained the entire full-length 3’UTR. Fragment 1 encompassed the CR, which does not contain a binding site, while the remaining 3 fragments of the 3’UTR each contained an individual binding site. Following co-transfection with pre-miR-214-3p or control miR, there was an approximately 50% reduction in luciferase activity with FL 3’ UTR. Co-transfection with either Fragment 2 or 4 with premiR-214-3p resulted in an approximately 25% decrease in luciferase activity. There was no decrement in luciferase activity following transfection with either Fragment 1 containing the CR or Fragment 3 in the 3’ UTR (Figure 5B). Following mutation of 4 bases in the seed sequence binding region of the predicted miR-214-3p binding sites in Fragment 2 (Figure 5C) and Fragment 4 (Figure 5D), no decrement in luciferase activity was observed following cotransfection with either mutated fragment and pre-miR-214-3p. Finally, mutating both binding sites in FL 3’UTR resulted in complete abrogation of the 50% decrement in luciferase activity seen with the wild type full-length construct (Figure 5E).
Figure 5.
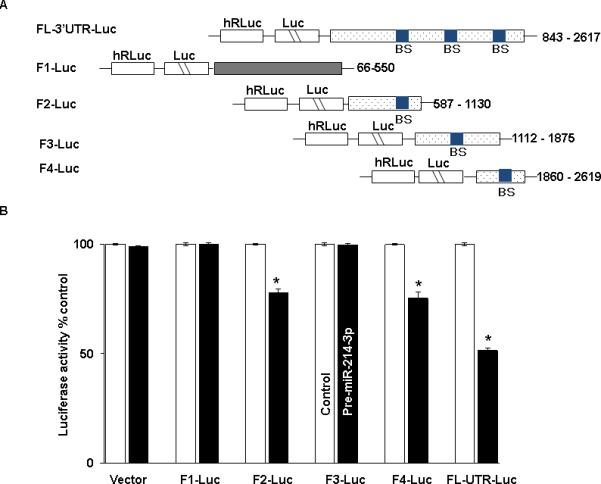
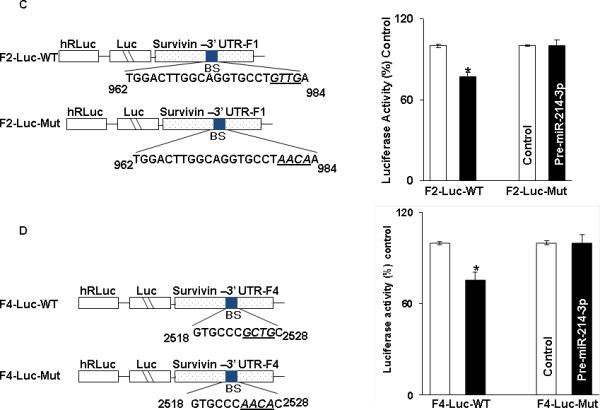

miR-214-3p associates with survivin mRNA. A. Schematic representation for constructs of different survivin luciferase reporters containing the full length 3’UTR (FL-3’UTR), CR (F1), or 3’UTR fragments with individual predicted miR-214-3p binding sites (F2-F4). B. Luciferase activity in the different survivin reporter constructs following co-transfection with pre-miR-214-3p (50nM) or control miR in TE7 cells for 36 hours. Firefly luciferase activities were normalized to Renilla luciferase activities and expressed as the mean of three independent experiments, where all experiments were carried out in triplicate. Error bars represent mean ± S.D. and * represents statistically significant p < 0.05, p values based on two-tailed Student's t test. C & D. The binding sequence of the miR-214-3p potential binding site in survivin 3’UTR fragments F2 (C) and F4 (D) were mutated (schematic, left top and bottom) by substituting 4 bases (underlined). Luciferase activity was measured and compared with its WT fragment. E. Binding sequences of both the specific binding sites in survivin full length 3’UTR were mutated (schematic left) and luciferase activity was measured and compared with WT.
A similar set of experiments was performed to analyze the relative contributions of the 5 predicted binding sites for miR-214-3p in CUG-BP1 mRNA. Five fragments of CUG-BP1 mRNA, each containing a unique potential binding site, were PCR amplified (Figure 6A). Fragments 1 and 2 contained binding sites located within the CR, while Fragments 3-5 contained binding sites located in the 3’ UTR. Each fragment was then separately sub-cloned into a luciferase reporter vector. Following co-transfection of pre-miR-214-3p or control miR with each construct, luciferase activity was measured. As seen in Figure 6B luciferase activity was decreased by approximately 50% following transfection with the construct containing the binding site in Fragment 1 in the CR and by approximately 40% following transfection with the construct containing the binding site in Fragment 4 in the 3’ UTR. There were no significant changes in luciferase activity following transfection with the constructs containing the other 3 potential binding sites. Finally, site directed mutagenesis was performed to alter 3 bases in the seed sequence binding region of the predicted miR-214-3p binding sites in Fragment 1 and Fragment 4. These mutated fragments were then cloned into luciferase reporter vectors. As seen in Figures 6C and 6D, co-transfection of the mutated constructs and pre-miR-214-3p abrogated the decrement in luciferase activity seen with the wild-type constructs.
Figure 6.
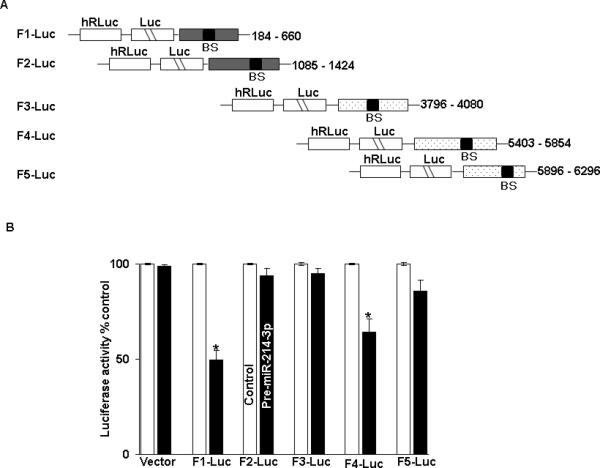
miR-214-3p associates with CUG-BP1 mRNA. A. Schematic diagram for constructs of different CUG-BP1 luciferase reporters containing predicted miR-214-3p binding sites in either the CR (F1 and F2) or 3’UTR (F3-F5). B. Luciferase activity in theses reporter constructs following cotransfection with pre-miR-214-3p (50 nM) or control miR in TE7 cells for 36 hours. Firefly luciferase activities were normalized to Renilla luciferase activities and expressed as the mean of three independent experiments in triplicates. Error bars represent ± S.D. (n=3 in each set of experiment) and * represents statistically significant value, p < 0.05, based on a two-tailed Student's t test. C. The binding sequences of the miR-214-3p potential binding site in CUG-BP1 CR (F1) reporter construct was mutated (schematic, left) by substituting 3 bases (underlined). Luciferase activity was measured and compared with WT luciferase construct. D. The binding sequences of the miR-214-3p potential binding site in CUG-BP1 3’UTR (F4) reporter construct was mutated (schematic, left) by substituting 3 bases (underlined). Luciferase activity was measured and compared with WT luciferase construct. Representative experiment of three separate experiments. All experiments were carried out in triplicate. Asterisk, statistical significance based on a two-tailed Student's t test
Overexpression of miR 214-3p enhances susceptibility of TE7 cells to Cisplatin-induced apoptosis
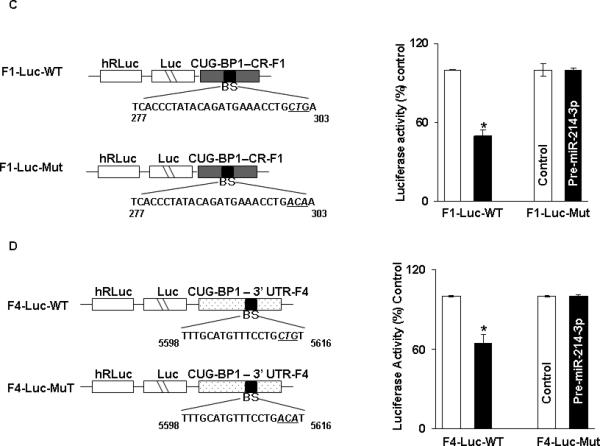
Based on our previous findings that silencing either survivin or CUG-BP1 enhanced the sensitivity of TE7 cells to chemotherapy-induced apoptosis, we predicted similar results following forced expression of miR-214-3p in these cells. In the time course experiment depicted in Figure 7A, TE7 cells were transfected with pre-miR-214-3p or control miR for 48 hours. At that time, cells were exposed to 15 μM Cisplatin and cell lysates harvested at various time points. Western blot analysis of lysates harvested 24 hours following Cisplatin exposure revealed a marked increase in caspase-3 protein levels in cells transfected with pre-miR-214-3p compared to control. In order to determine whether the observed enhancement in apoptosis following overexpression of miR-214-3p was due to its reduction in survivin and/or CUG-BP1 levels, rescue experiments were performed. As seen in Figure 7B, overexpression of either survivin or CUG-BP1 following transfection of miR-214-3p restores expression of these proteins. Following restoration of either survivin or CUG-BP1 expression, TE7 cells exposed to Cisplatin following transfection with pre-miR-214-3p no longer demonstrate release of caspase-3 (Figure 7C).
Figure 7.
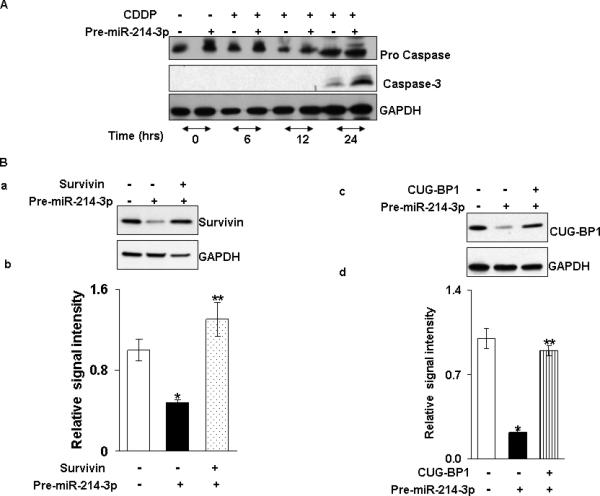

miR-214-3p overexpression sensitizes cells to Cisplatin (CDDP) -induced apoptosis. A. An immunoblot of cleaved caspase in TE7 cells exposed to Cisplatin following pre-miR-214-3p transfection. Cells were transfected with pre-miR-214-3p or control miR for 48 hours then treated with Cisplatin (15 μM) for indicated time points. Representative western blot of three independent experiments. B. Following overexpression of pre-miR-214-3p in TE7 cells (middle & last lane), cells were transfected with 2μg (a) survivin or (c) CUG-BP1 plasmid (last lane) and level of survivin and CUG-BP-1 was measured respectively by Western blot. (b). Relative signal intensity of survivin expression as shown in a. (d). Relative CUG-BP1 signal intensity as shown in c. Mean ± S.D. of three independent experiment is shown. and statistical significance is indicated by asterisk (p<0.05). * represents significance between control-miR and empty vector (first lane) and pre-miR-214-3p (middle lane) transfected samples and ** stands for statistical significance between ectopic expression of pre-miR-214-3p alone (middle lane) and both pre-miR-214-3p and plasmid DNA samples (last lane). C. TE7 cells were transfected with control miR and empty vector (lane 1, 5), pre-miR-214-3p alone (lane 2, 6), pre-miR-214-3p and CUG-BP-1 plasmid (lane 3, 7) and pre-miR-214-3p and survivin plasmid (lane 4, 8). After 48 hours of the transfection, cells were exposed to cisplatin (15μM, lane 5-8) and immunoblot was performed for cleaved caspase. Representative immunoblot of three independent experiments. D. Caspase activity was measured by caspase-3 colorimetric instant ELISA assay in cell lysates as described in C. Mean ± S.D. of three independent experiment is shown and statistical significance is indicated by asterisk (p<0.05). E. TE7 cells were transfected for 48 hours with pre-miR-214-3p or control miR, subjected to 15 μM Cisplatin for 24 hours and labelled with Annexin-V. Apoptosis was evaluated by flow cytometry. Representative experiment of three independent experiments. F. Bar diagram of percentage apoptotic cells measured in E. Mean ± S.D. of three independent experiments is shown. * p< 0.05, statistically significant based on two-tailed Student's t test.
To ensure that the observed caspase-3 seen following miR-214-3p overexpression was functional, a caspase-3 ELISA assay was performed under the same conditions. This revealed a two-fold increase in caspse-3 enzyme activity following 24 hours of exposure to Cisplatin in TE7 cells transfected with pre-miR-214-3p relative to control (Figure 7D). To further confirm this increased sensitivity to Cisplatin-induced apoptosis, TE7 cells underwent flow cytometry analysis for Annexin-V expression. Treatment with pre-miR-214-3p alone or control miR plus Cisplatin resulted in approximately 5-10% of cells staining positive for Annexin-V expression, whereas over 50% of TE7 cells transfected with pre-miR-214-3p and exposed to Cisplatin stained positive for Annexin-5 (Figures 7E and 7F).
Discussion
Our findings indicate that miR-214-3p is markedly downregulated in esophageal squamous cancer cell lines compared to esophageal epithelial cells. We also demonstrate that miR-214-3p regulates survivin expression in these esophageal cancer cells, by both a direct interaction with survivin mRNA, as well as indirectly through an interaction with CUG-BP1 mRNA. Forced expression of miR-214-3p in esophageal cancer cells leads to a decrease in both mRNA and protein levels of survivin and CUG-BP1, associated with decreased mRNA stability of both targets. Finally, overexpression of miR-214-3p results in markedly enhanced sensitivity of esophageal cancer cells to Cisplatin, which is abrogated following rescue expression of either survivin or CUG-BP1.
The analysis of global miR expression in both TE7 and TE10 cells compared to hESO cells is in agreement with a study from Matsushima and colleagues who compared miR expression between the esophageal squamous cancer cell lines TE10 and OE-21 and the immortalized esophageal epithelial line Het-1A [17]. All five of the miRs (miRs-141, 200c, 203, 205, 429) found to be most upregulated in their study were also upregulated by at least 2 log-fold in both cancer cell lines in our analysis. Seven of the nine miRs (miRs-10a, 99a, 100-5p, 125b, 146b, 376a, 379) found to be most downregulated in the cancer cell lines were also downregulated by 1 to 2 log-fold in the TE7 and TE10 cell lines used in our study. The relative expression of miR-214-3p was not detailed in their report. However, in a study comparing miR expression in 40 esophageal squamous cell cancer specimens and matched normal tissues, miR-214-3p was found to be significantly downregulated in 77.5% of samples [18].
The data presented here not only demonstrate a new role for miR-214-3p as an important post-transcriptional regulator of survivin in esophageal squamous cancer cells, but, by also describing its interaction with CUG-BP1, enhance the understanding of the complex regulatory relationships that exist between miRs and RBPs [19]. In the only other study describing post-transcriptional regulation of CUG-BP1, miR-503 was shown to negatively influence the translational efficiency of CUG-BP1 mRNA in intestinal epithelial cells [20]. In that report, similar to our results with miR-214-3p, altering expression of miR-503 profoundly affected the anti-apoptotic effect promoted by CUG-BP1. Silencing miR-503 resulted in increased levels of CUG-BP1, which protected cells from TNFα -induced apoptosis. Intriguingly, the upregulated targets of CUG-BP1 responsible for this phenomenon, c-IAP1 and c-IAP2, are members of the same IAP family as survivin. Furthermore, simultaneous silencing of miR-503 and CUG-BP1 abolished this increase in c-IAP1 and c-IAP2 levels, providing additional evidence that CUG-BP1 enhances the expression of these anti-apoptotic proteins.
Our findings indicate that the pro-apoptotic effect observed following forced expression of miR-214-3p, is related at least in part, to the reduction in survivin expression. It is certainly possible, however, that additional targets of both miR-214-3p and CUG-BP1 may also be reduced. Alterations in levels of both miR-214-3p and CUG-BP1 have been shown to affect sensitivity to chemotherapy-induced apoptosis in cancer cells, although their expression and targets vary considerably across different malignancies. In ovarian cancer cells, where miR-214-3p is overexpressed compared to normal tissues, miR-214-3p was shown to downregulate PTEN [21]. PTEN downregulation led to activation of the Akt pathway, thereby promoting cell survival and resistance to Cisplatin. Similarly, in nasopharyngeal cancer, the upregulation of miR-214-3p led to decreased levels of the pro-apoptotic protein Bim [22]. Conversely, miR-214-3p has been shown to be downregulated relative to normal cells in HCC and cervical cancer. In each case, miR-214-3p was found to target an anti-apoptotic gene; XBP-1 in HCC and Bcl2l2 in cervical cancer, such that the loss of miR-214-3p in these cells resulted in the increased expression of its anti-apoptotic targets [23-24]. Additionally, forced expression of miR-214-3p in the esophageal squamous cancer cell line Eca109 inhibited expression of the enhancer of zeste homolog 2 (EZH2) [18]. Of note, EZH2 was also found to be a target of miR-214-3p in HCC [25]. In both reports, overexpression of miR-214-3p led to decreased proliferation and invasion capacity of the transfected cancer cells.
In addition to our previous description of its role in regulating survivin expression in esophageal cancer cells, other evidence supports an important role for CUG-BP1 in promoting an anti-apoptotic phenotype in cancer cells. CUG-BP1 has been shown to be overexpressed in both oral squamous cancer cell lines and human tumors [26]. In these cells, CUG-BP1 bound to the 3’UTRs of the mRNAs encoding the pro-apoptotic proteins BAD and BAX, and facilitated their degradation. Silencing CUG-BP1 therefore resulted in increased levels of BAD and BAX and enhanced sensitivity to chemotherapy-induced apoptosis. Gareau and colleagues described the ability of CUG-BP1 to mediate resistance to the proteasome inhibitor bortezomid in HeLa cells by stabilizing p21 mRNA [27]. Together with our findings, these data regarding targets of miR-214-3p and CUG-BP1 in cancer cells raise the intriguing possibility that miR-214-3p and/or CUG-BP1 could serve as important regulators of multiple anti-apoptotic effectors in esophageal cancer cells. This suggests a model in which loss of these post-transcriptional regulators could be important events in esophageal carcinogenesis.
Materials and Methods
Cell culture and reagents
The human esophageal squamous cancer cell lines TE7 and TE10 are kind gifts from Dr. Nishihira (Tohoku University, Sendai Japan). These cell lines were cultured in RPMI media (Mediatech Inc, Herndon, VA) supplemented with 10% heat-inactivated FBS. hESO is a spontaneously immortalized esophageal epithelial cell line derived from esophageal specimens harvested at the time of donor lung procurement. These cells were cultured in BEBM media (Lonza Corp, Walkersville, MD) supplemented with 20% heat-inactivated FBS and the BEGM bullet kit. All cells were maintained in a 37°C incubator with 5% CO2 humidified air.
Transfection
Cells were seeded in 6 cm plates at a density of 0.5-1 × 10⁶, a day prior to transfection. For miR transfections, pre-miR-214-3p (12 nM), anti-miR-214-3p (25 nM), or control miR (Ambion, Austin, TX) was diluted in 500μl Opti-MEM I (Invitrogen, Carlsbad, CA) containing 5 μl Lipofectamine RNAiMAX (Invitrogen, Carlsbad, CA). After 15 min incubation at room temperature (RT), the complex was added to the cells in a final volume of 5 ml of fresh medium. In order to transiently over-express CUG-BP1 and survivin, TE7 cells were transfected with 2 μg of pCMV6-XL5 plasmid containing CUG-BP1 or survivin cDNA (OriGene, Rockville, MD) diluted in 500μl Opti-MEM I containing 5 μl Lipofectamine 2000 (Invitrogen, Carlsbad, CA).
Global miRNA expression Profiling
hESO, TE7 and TE10 cells (two replicates each) were seeded in 6 cm plates at passage 5. Total RNA was isolated using miRNeasy Mini Kit (Qiagen, Valencia, CA) according to manufacturer's manual. All the experiments for miR array were conducted at Exiqon Services, Denmark. Briefly, RNA quality was verified by an Agilent 2100 Bioanalyzer profile. Total RNA (750 ng) of each sample and common reference was labeled with Hy3 and Hy5 fluorescent label using the miRCURY LNA microRNA Hi-Power labeling kit (Exiqon). RNA samples were mixed pairwise and hybridized to the miRCURY LNA microRNA array 7th generation which contains capture probes targeting all miRs for human listed in miRBASE 18.0. Hybridization was performed using a Tecan HA4800 hybridization station. Slides were then scanned using Agilent G2565BA Microarray Scanner system and image analysis was carried out using ImaGene9 microRNA Array analysis software. The quantified signals were background corrected (Normexp with offset value10) and normalized using the global Lowess (Locally Weighted Scatterplot Smoothing) regression algorithm [28]. For each comparison the fold change is listed as log2 transformed values. The fold change is calculated as 2^logFC. All calculations have been done with R/Bioconductor software using mainly the limma package [29]. All microarray data are deposited in the Gene Expression Omnibus (GEO data base accession No: GSE67016).
Reverse transcription (RT) and quantitative real-time PCR (q-PCR) analyses
For all the RT and q-PCR experiments, total RNA was isolated from each sample using miRNeasy Mini Kit (Qiagen, Valencia, CA) according to manufacturer's manual and quantitated using NanoDrop1000 spectrometry (Thermo Scientific, Wilmington, DE). Equal amounts (1μg) of total RNA were reverse transcribed using Oligo dt primer and AMV reverse transcriptase (Reverse Transcription System, Promega, Madison, WI). 10 ng of total RNA per 15 μl reaction was reverse transcribed using TaqMan miR reverse transcription kit with specific miR primers (Applied Biosystems, Foster City, CA). Q-PCR was performed in triplicate with specific (Survivin, CUG-BP1, HuR, miR-214-3p, U6 and GAPDH) TaqMan primers and probes (Applied Biosystems, Foster City, CA). Two μl cDNA were used in total 20 μl volume per reaction. Reactions were run on a STEP-ONE Plus Real–Time PCR System (Applied Biosystems, Foster City, CA) and cycling conditions were as follows: 2 min at 50°C, 10 min at 95°C, followed by 40 cycles of 15 s at 95°C and 1 min at 60°C. The threshold limit was set so that it intersected all the samples during the log-liner phase of amplification. The levels of GAPDH were used to normalize levels of survivin, CUG-BP1, and HuR in q-PCR samples. For miR experiments, normalization was accomplished using small nuclear RNA U6.
Immunoblotting
30 μg of protein from whole cell lysates was resolved on 10% SDS-PAGE gels (Bio-Rad Laboratories, Hercules, CA) and transferred onto PVDF membranes (GE Healthcare, Piscataway, NJ). After transfer, membranes were blocked in 5% nonfat milk in TBST and membranes were incubated with specific antibodies (overnight at 4°C) followed by horseradish peroxidaseconjugated anti-mouse or anti-rabbit (Santa Cruz, Dallas, TX) immunoglobulin for 1 hour at RT. Signal was detected by Chemiluminescence Reagent (PerkinElmer, Waltham, MA) and visualized by autoradiography. Anti-human survivin antibody was purchased from R&D Systems (Minneapolis, MN). Anti-CUG-BP1, anti-HuR, and anti-GAPDH antibodies were purchased from Santa Cruz Biotechnology (Dallas, TX). All primary anti-bodies were used at a dilution of 1:2000 and all secondary antibodies were used at a dilution of 1:4000. Signal intensity was quantified using Image Lab quantification software (Bio-Rad, Hercules, CA).
Bioinformatics
Two software programs, RegRNA 2.0 [regrna.mbc.nctu.edu.tw] and Weizmann Institute of Science [http://genie.weizmann.ac.il/index.html] were used to predict the potential target genes of miR-214-3p.
mRNA stability
mRNA stability assays were performed as previously reported [30]. Twenty-four hours following transfection as described above, medium containing Actinomycin D (Sigma–Aldrich, St. Louis, MO) at a final concentration of 0.2μM was added for specified time points. Total RNA was isolated from each sample and qRT-PCR was performed in triplicate as described above.
Biotin-labeled pull-down assays
Biotinylated miR-214-3p (Dharmacon, Lafayette, CO) pull-down assay with target mRNAs was performed as described earlier [31-32]. Briefly, 1 × 10⁶ TE7 cells were seeded in 10 cm plate in duplicate a day before transfection. Next day, control miR or 3’ biotin-labeled miR-214-3p (5’ACAGCAGGCACAGACAGGCAGU 3’Bi) was transfected at a final concentration of 50 nM. After 48 hours, whole cell lysates were harvested. Simultaneously, Streptavidin-Dyna beads (Dyna beads M-280 Streptavidin, #11205D, Invitrogen, 50 μl each sample) were coated with 10 μl per sample yeast tRNA (stock 10 mg/ml Ambion, Austin, TX) and incubated with rotation at 4°C for 2 hrs. Then beads were washed with 500 μl lysis buffer and resuspended in 50 μl lysis buffer. Sample lysates were mixed with pre-coated beads (50 μl per sample) and incubated overnight at 4°C on a rotator. Beads were then pellet down next day to remove unbound materials at 4°C for 1 minute, 5K rpm and washed five times with 500 μl ice cold lysis buffer. To isolate the RNA, 750 μl of TRIzol (Invitrogen, Carlsbad, CA) and 250 μl nuclease free water was added to both input and pulldown samples. Tubes were mixed well and kept in −20°C for 2 hrs. RNA was then precipitated using standard chloroform-isopropanol method and then subjected to q-PCR as explained above.
Apoptosis studies
After transfection with pre-miR-214-3p (12 nM) for 48 hours, TE7 cells were treated with Cisplatin (15 μM) (clinical grade) for 24 hours and stained with fluorescein-labeled Annexin-V (FITC) and Propidium Iodide (PI) (TACS Annexin V FITC Apoptosis Detection kit, Trevigen Inc, Gaithersburg, MD). Briefly, cells were washed twice with cold PBS and spun at 300g for 5 min at RT. 106 cells were resuspended in 100μl Annexin V incubation reagent (10 μl 10× binding buffer, 2 μl PI, 1 μl Annexin V FITC and 87 μl deionized water per sample) and incubated in the dark for 15 minutes at RT. At the end of incubation, 400 μl of 1× binding buffer was added (per 100 μl reaction). Samples were then analyzed for FITC Annexin-V positive, PI negative or FITC Annexin-V positive, PI positive by flow cytometry (BD Accuri C6). For caspase activation assays, cells were exposed to Cisplatin following transfection with pre-miR-214-3p for 24 hours and cleaved caspase was measured by Western blot using rabbit anti-caspase-3 (Cell Signaling, Danvers, MA). Caspase enzyme activity was measured in triplicate for each experiment, using instant ELISA kit (eBioscience Inc., San Diego, CA), following the manufacturer's instructions.
Luciferase Reporter Assay
Luciferase reporter constructs were prepared as previously described [33]. For survivin (Variant 1 NM_001168.2), individual luciferase reporter constructs were generated that contained either the CR, full-length 3’ UTR, or one of 3 separate 3’UTR fragments. For CUG-BP1 (Variant 5 NM_ 001172640), the constructs contained either one of 2 CR fragments or one of 3 separate 3’ UTR fragments. The inserts were amplified by PCR and individual fragments were subcloned into a NheI and SalI or SacI and Xba1 (New England Bio Labs, Ipswich, MA) digested pmirGLO Dual-Luciferase miRNA target expression vector (Promega, Madison, WI). The constructs containing mutations at the seed sequence binding region of potential binding sites were generated using site directed mutagenesis kit (Agilent Technologies, Santa Clara, CA). All primer sequences used to create these constructs are listed in Tables 2 and 3. Restriction enzyme digestion and DNA sequencing confirmed the orientation and sequence of the constructs. For luciferase activity assay, 1 × 10⁵ TE7 cells/well were plated onto 12-well cell culture plates and co-transfected as described above with luciferase reporter constructs (10ng) and pre-miR-214-3p (50 nM) for 36 hours. Luciferase activity was measured using Dual Luciferase Reporter Assay kit (Promega, Madison, WI), as per manufacturer's protocol. Levels of firefly luciferase activity were normalized to Renilla luciferase activity
Table 2.
Primer sequences used to generate survivin mRNA luciferase reporter constructs for miR-214-3p binding studies.
| Name | Sequence | Region | Cutting Site |
|---|---|---|---|
| pmirGLO-F1-Fwd | GAGCTC CCATTAACCGCCAGATTTGA | 66-550 | Sac I |
| pmirGLO-F1-Rev | TCTAGATCAATCCATGGCAGCCAGCT | 66-550 | Xba I |
| pmirGLO-F2-Fwd | GAGCTCGCACCACTTCCAGGGTTTAT | 587-1130 | Sac I |
| pmirGLO-F2-Rev | TCTAGAAGAGGAGCCAGGGACTCTGT | 587-1130 | Xba I |
| pmirGLO-F3-Fwd | GAGCTCCAGAGTCCCTGGCTCCTCTA | 1112-1875 | Sac I |
| pmirGLO-F3-Rev | TCTAGAAGCCCGGATGATACAAACAG | 1112-1875 | Xba I |
| pmirGLO-F4-Fwd | GAGCTCTTGTATCATCCGGGCTCCT | 1860-2619 | Sac I |
| pmirGLO-F4-Rev | TCTAGACATGAGACTTTATTGGCAATTGTG | 1860-2619 | Xba I |
| pmirGLO-UTR-Fwd | GAGCTCAGGGAGGAAGAAGGCAGTGT | 843-2617 | Sac I |
| pmirGLO-UTR-Rev | TCTAGATGAGACTTTATTGGCAATTGTGAG | 843-2617 | Xba I |
| pmirGLO-Mut-F2-Fwd | GTGGACTTGGCAGGTGCCTAACAAATCTGAGCTGCAGGTTCC | 587-1130 | N/A |
| pmirGLO-Mut-F2-Rev | GGAACCTGCAGCTCAGATTTGTTAGGCACCTGCCAAGTCCAC | 587/1130 | N/A |
| pmirGLO-Mut-F4-Fwd | GAGACAGCAGTGCCCAACACCCAGAAGAGACCAGC | 1860-2619 | N/A |
| pmirGLO-Mut-F4-Rev | GCTGGTCTCTTCTGGGTGTTGGGCACTGCTGTCTC | 1860-2619 | N/A |
Table 3.
Primer sequences used to generate CUG-BP1 mRNA luciferase reporter constructs for miR-214-3p binding studies.
| Name | Sequence | Region | Cutting Site |
|---|---|---|---|
| pmirGLO-F1-Fwd | GCTAGCGCAAAGGGTGCTGTTTTGTT | 184-660 | Nhe I |
| pmirGLO-F1-Rev | GTCGACAAGGTTTCCCCACACAGATG | 184-660 | Sal I |
| pmirGLO-F2-Fwd | GCTAGCACTCAGGCCTACTCGGGTATC | 1085-1424 | Nhe I |
| pmirGLO-F2-Rev | GTCGACTAAGCCGCTTCATGCCAAT | 1085-1424 | Sal I |
| pmirGLO-F3-Fwd | GCTAGCTAAGAGGCCAAGGTGCAATC | 3796-4080 | Nhe I |
| pmirGLO-F3-Rev | GTCGACGAGCTGAGCCCTTTCACAC | 3796-4080 | Sal I |
| pmirGLO-F4-Fwd | GCTAGCTCTTCCCTGGAGCGACTCT | 5403-5854 | Nhe I |
| pmirGLO-F4-Rev | GTCGACAAGCCCCGGTAAGACCTG | 5403-5854 | Sal I |
| pmirGLO-F5-Fwd | GCTAGC GCCTGGAGAGACACGAGAAG | 5896-6296 | Nhe I |
| pmirGLO-F5-Rev | GTCGACCCACAAGAGAGGAGGGTCAG | 5896-6296 | Sal I |
| pmirGLO-Mut-F1-Fwd | CCCTATACAGATGAAACCTGACAACAGTGAGAAGAACAATGTGG | 184-660 | N/A |
| pmirGLO-Mut-F1-Rev | CCACATTGTTCTTCTCACTGTTGTCAGGTTTCATCTGTATAGGG | 184-660 | N/A |
| pmirGLO-Mut-F4-Fwd | CCCAGAAAAAAGTTTTGCATGTTTCCTGACATTTCTTCACACCTTCGTATATATCACC | 5403-5854 | N/A |
| pmirGLO-Mut-F4-Rev | GGTGATATATACGAAGGTGTGAAGAAATGTCAGGAAACATGCAAAACTTTTTTCTGGG | 5403-5854 | N/A |
Statistical Analysis
Results are expressed as the means ± S.D from three independent experiments with minimum three replicates for each set of experiment. Data derived from multiple determinations were subjected to two-tailed Student's t test and p values < 0.05 were considered statistically significant.
Acknowledgements
This work was supported by the Department of Veterans Affairs, U.S.A. [Merit Review Grants (to J.N.R., D.J.T., and J.-Y.W.), VA Career Development Award (to J.M.D.)]; the National Institutes of Health [grant numbers DK-57819, DK-61972 and DK-68491 (to J.-Y.W.)] and departmental funds from the Department of Surgery, University of Maryland School of Medicine (to J.M.D.). The authors would also like to acknowledge Dr. Karthika Natarajan, Dr. Xi Yang and Ratnakar Potla for their technical assistance as well as Dr. Anne W. Hamburger for assistance in preparation of the manuscript.
Footnotes
Conflict of Interest
The authors declare no conflict of interest.
References
- 1.Kaufmann SH, Vaux DL. Alterations in the apoptotic machinery and their potential role in anticancer drug resistance. Oncogene. 2003;22(47):7414–7430. doi: 10.1038/sj.onc.1206945. [DOI] [PubMed] [Google Scholar]
- 2.Mita AC, Mita MM, Nawrocki ST, Giles FJ. Survivin key regulator of mitosis and apoptosis and novel target for cancer therapeutics. Clin Cancer Res. 2008;14(16):5000–5005. doi: 10.1158/1078-0432.CCR-08-0746. [DOI] [PubMed] [Google Scholar]
- 3.Kato J, Kuwabara Y, Mitani M, Shinoda N, Sato A, Toyama T, et al. Expression of survivin in esophageal cancer: correlation with the prognosis and response to chemotherapy. Int J Cancer. 2001;95(2):92–95. doi: 10.1002/1097-0215(20010320)95:2<92::aid-ijc1016>3.0.co;2-9. [DOI] [PubMed] [Google Scholar]
- 4.Chang E, Donahue J, Smith A, Hornick J, Rao JN, Wang JY, et al. Loss of p53, rather than beta-catenin overexpression, induces survivin-mediated resistance to apoptosis in an esophageal cancer cell line. Thorac Cardiovasc Surg. 2010;140(1):225–232. doi: 10.1016/j.jtcvs.2009.11.038. [DOI] [PubMed] [Google Scholar]
- 5.Vallböhmer D, Kuhn E, Warnecke-Eberz U, Brabender J, Hoffmann AC, Metzger R, et al. Failure in downregulation of intratumoral survivin expression following neoadjuvant chemoradiation in esophageal cancer. Pharmacogenomics. 2008;9(6):681–690. doi: 10.2217/14622416.9.6.681. [DOI] [PubMed] [Google Scholar]
- 6.Audic Y, Hartley RS. Post-transcriptional regulation in cancer. Biol Cell. 2004;96(7):479–498. doi: 10.1016/j.biolcel.2004.05.002. [DOI] [PubMed] [Google Scholar]
- 7.Di Leva G, Garofalo M, Croce CM. MicroRNAs in cancer. Annu Rev Pathol. 2014;9:287–314. doi: 10.1146/annurev-pathol-012513-104715. [DOI] [PMC free article] [PubMed] [Google Scholar]
- 8.Cheetham SW, Gruhl F, Mattick JS, Dinger ME. Long noncoding RNAs and the genetics of cancer. Br J Cancer. 2013;108(12):2419–2425. doi: 10.1038/bjc.2013.233. [DOI] [PMC free article] [PubMed] [Google Scholar]
- 9.Keene JD. RNA regulons: coordination of post-transcriptional events. Nat Rev Genet. 2007;8(7):533–543. doi: 10.1038/nrg2111. [DOI] [PubMed] [Google Scholar]
- 10.Chang ET, Donahue JM, Xiao L, Cui Y, Rao JN, Turner DJ, et al. The RNA-binding protein CUG-BP1increases survivin expression in oesophageal cancer cells through enhanced mRNA stability. Biochem J. 2012;446(1):113–123. doi: 10.1042/BJ20120112. [DOI] [PMC free article] [PubMed] [Google Scholar]
- 11.Cao W, Fan R, Wang L, Cheng S, Li H, Jiang J, et al. Expression and regulatory function of miRNA-34a in targeting survivin in gastric cancer cells. Tumor Boil. 2013;34(2):963–971. doi: 10.1007/s13277-012-0632-8. [DOI] [PubMed] [Google Scholar]
- 12.Shen Z, Zhan G, Ye D, Ren Y, Cheng L, Wu Z, et al. MicroRNA-34a affects the occurrence of laryngeal squamous cell carcinoma by targeting the antiapoptotic gene survivin. Med Oncol. 2012;29(4):2473–2480. doi: 10.1007/s12032-011-0156-x. [DOI] [PubMed] [Google Scholar]
- 13.Saini S, Majid S, Yamamura S, Tabatabai L, Suh SO, Shahryari V, et al. Regulatory Role of mir-203 in Prostate Cancer Progression and Metastasis. Clin Cancer Res. 2011;17(16):5287–5298. doi: 10.1158/1078-0432.CCR-10-2619. [DOI] [PubMed] [Google Scholar]
- 14.Xu D, Wang Q, An Y, Xu L. MiR-203 regulates the proliferation, apoptosis and cell cycle progression of pancreatic cancer cells by targeting Survivin. Mol Med Rep 2013. 8(2):379–384. doi: 10.3892/mmr.2013.1504. [DOI] [PubMed] [Google Scholar]
- 15.Wei W, Wanjun L, Hui S, Dongyue C, Xinjun Y, Jisheng Z. miR-203 inhibits proliferation of HCC cells by targeting survivin. Cell Biochem Funct. 2013;31(1):82–85. doi: 10.1002/cbf.2863. [DOI] [PubMed] [Google Scholar]
- 16.Donahue JM, Chang ET, Xiao L, Wang PY, Rao JN, Turner DJ, et al. The RNA-binding protein HuR stabilizes survivin mRNA in human oesophageal epithelial cells. Biochem J. 2011;437(1):89–96. doi: 10.1042/BJ20110028. [DOI] [PubMed] [Google Scholar]
- 17.Matsushima K, Isomoto H, Kohno S, Nakao K. MicroRNAs and esophageal squamous cell carcinoma. Digestion. 2010;82(3):138–144. doi: 10.1159/000310918. [DOI] [PubMed] [Google Scholar]
- 18.Huang SD, Yuan Y, Zhuang CW, Li BL, Gong DJ, Wang SG, et al. MicroRNA-98 and microRNA-214 post-transcriptionally regulate enhancer of zeste homolog 2 and inhibit migration and invasion in human esophageal squamous cell carcinoma. Mol Cancer. 2012;11:51–61. doi: 10.1186/1476-4598-11-51. [DOI] [PMC free article] [PubMed] [Google Scholar]
- 19.Ciafrè SA, Galardi S. MicroRNAs and RNA-binding proteins: a complex network of Interactions and reciprocal regulations in cancer. RNA Biol. 2013;10(6):935–942. doi: 10.4161/rna.24641. [DOI] [PMC free article] [PubMed] [Google Scholar]
- 20.Cui YH, Xiao L, Rao JN, Zou T, Liu L, Chen Y, et al. miR-503 represses CUG-binding protein 1 translation by recruiting CUGBP1 mRNA to processing bodies. Mol Biol Cell. 2012;23(1):151–162. doi: 10.1091/mbc.E11-05-0456. [DOI] [PMC free article] [PubMed] [Google Scholar]
- 21.Yang H, Kong W, He L, Zhao JJ, O'Donnell JD, Wang J, et al. MicroRNA expression profiling in human ovarian cancer: miR-214 induces cell survival and cisplatin resistance by targeting PTEN. Cancer Res. 2008;68(2):425–433. doi: 10.1158/0008-5472.CAN-07-2488. [DOI] [PubMed] [Google Scholar]
- 22.Zhang ZC, Li YY, Wang HY, Fu S, Wang XP, Zeng MS, et al. Knockdown of miR-214 promotes apoptosis and inhibits cell proliferation in nasopharyngeal carcinoma. PLoS One. 2014;9(1):e8614, 1–10. doi: 10.1371/journal.pone.0086149. [DOI] [PMC free article] [PubMed] [Google Scholar]
- 23.Duan Q, Wang X, Gong W, Ni L, Chen C, He X, et al. ER stress negatively modulates the expression of the miR-199a/214 cluster to regulates tumor survival and progression in human hepatocellular cancer. PLoS One. 2012;7(2):e31518, 1–10. doi: 10.1371/journal.pone.0031518. [DOI] [PMC free article] [PubMed] [Google Scholar]
- 24.Wang F, Liu M, Li X, Tang H. MiR-214 reduces cell survival and enhances cisplatin-Induced cytotoxicity via down-regulation of Bcl2l2 in cervical cancer cells. FEBS Lett. 2013;587(5):488–495. doi: 10.1016/j.febslet.2013.01.016. [DOI] [PubMed] [Google Scholar]
- 25.Xia H, Ooi LL, Hui KM. MiR-214 targets β-catenin pathway to suppress invasion, stem-like traits and recurrence of human hepatocellular carcinoma. PLoS One. 2012;7(9):e44206, 1–13. doi: 10.1371/journal.pone.0044206. [DOI] [PMC free article] [PubMed] [Google Scholar]
- 26.Talwar S, Balasubramanian S, Sundaramurthy S, House R, Wilusz CJ, Kuppuswamy D, et al. Overexpression of RNA-binding protein CELF1 prevents apoptosis and destabilizes proapoptotic mRNAs in oral cancer cells. RNA Biol. 2013;10(2):277–286. doi: 10.4161/rna.23315. [DOI] [PMC free article] [PubMed] [Google Scholar]
- 27.Gareau C, Fournier MJ, Filion C, Coudert L, Martel D, Labelle Y, et al. p21(WAF1/ CIP1) upregulation through the stress granule-associated protein CUGBP1 confers resistance to bortezomib-mediated apoptosis. PLoS One. 2011;6(5):e20254, 1–14. doi: 10.1371/journal.pone.0020254. [DOI] [PMC free article] [PubMed] [Google Scholar]
- 28.Richie ME, Silver S, Oshlack A, Holmes M, Diyagama D, Holloway A, et al. A comparison of background correction methods for two-colour microarrays. Bioinformatics. 2007;23(20):2700–2707. doi: 10.1093/bioinformatics/btm412. [DOI] [PubMed] [Google Scholar]
- 29.Smyth GK. Limma linear models for microarray data. In: Gentleman R, Carey V, Huber W, Irizarry R, Dudoit S, editors. Bioinformatics and Computational Biology Solutions using R and Bioconductor. Springer; New York: 2005. pp. 397–420. [Google Scholar]
- 30.Brennan SE, Kuwano Y, Alkharouf N, Blackshear PJ, Gorospe M, Wilson GM. The mRNA-Destabilizing protein tristeraprolin is suppresses in many cancers, altering tumorigenic phenotypes and patient prognosis. Cancer Res. 2009;69(12):5168–5176. doi: 10.1158/0008-5472.CAN-08-4238. [DOI] [PMC free article] [PubMed] [Google Scholar]
- 31.Orom UA, Lund AH. Isolation of microRNA targets using biotinylated synthetic microRNAs. Methods. 2007;43(2):162–165. doi: 10.1016/j.ymeth.2007.04.007. [DOI] [PubMed] [Google Scholar]
- 32.Choi YE, Pan Y, Park E, Konstantinopoulos P, De S. MicroRNAs down-regulate homologous recombination in the G1 phase of cycling cells to maintain genomic stability. D'Andrea A et al. eLIFE. 2014;3:e02445. doi: 10.7554/eLife.02445. [DOI] [PMC free article] [PubMed] [Google Scholar]
- 33.Liu L, Rao JN, Zou T, Xiao L, Wang PY, Turner DJ, et al. Polyamines regulate c-Myc translation through Chk2-dependent HuR phosphorylation. Mol Biol Cell. 2009;20(23):4885–4898. doi: 10.1091/mbc.E09-07-0550. [DOI] [PMC free article] [PubMed] [Google Scholar]