

Summary
Variation in gene expression is an important feature of mouse embryonic stem cells (ESCs). However, the mechanisms responsible for global gene expression variation in ESCs are not fully understood. We performed single cell mRNA-seq analysis of mouse ESCs and uncovered significant heterogeneity in ESCs cultured in serum. We define highly variable gene clusters with distinct chromatin states; and show that bivalent genes are prone to expression variation. At the same time, we identify an ESC priming pathway that initiates the exit from the naïve ESC state. Finally, we provide evidence that a large proportion of intracellular network variability is due to the extracellular culture environment. Serum free culture reduces cellular heterogeneity and transcriptome variation in ESCs.
Introduction
Early mammalian development cells differentiate toward trophectoderm (TE) and inner cell mass (ICM). The ICM goes on to form the epiblast (EPI) and the primitive endoderm (PE). ESCs can be derived from the ICM in the presence of leukemia inhibitory factor (LIF) and fetal calf serum (FCS) (Evans and Kaufman, 1981). ESCs have two important characteristics: the capacity for differentiation into all somatic cell types and the property of unlimited self-renewal in vitro.
Previous studies suggest that ESCs in culture are not homogeneous. Transcription factors associated with ESC identity may be expressed in a heterogeneous manner. For example, Nanog and Dppa3 are expressed in only a fraction of cells (Chambers et al., 2007; Hayashi et al., 2008). Variation in expression of these individual genes has been implicated in controlling the differentiation potential of different subpopulations. However, traditional methods are limited to the analysis of small number of genes. The mechanisms underlying genome scale ESC variability are not fully characterized.
Single cell gene expression analysis has been developed as a powerful tool for studying cellular heterogeneity and hierarchy. Several hallmark technical advances have been achieved. High-throughput single cell qPCR is a dynamic approach for quantifying a set of target genes in systems of interest (Buganim et al., 2012; Dalerba et al., 2011; Guo et al., 2013; Guo et al., 2010; Moignard et al., 2013). Single cell mass cytometry constitutes a complementary system for multiplexed gene expression analysis at the protein level (Bendall et al., 2011). Single cell mRNA sequencing strategies, which enable whole transcriptome analysis from individual cells, have become increasingly mature and capable (Fan et al., 2015; Hashimshony et al., 2012; Islam et al., 2012; Jaitin et al., 2014; Klein et al., 2015; Macosko et al., 2015; Ramskold et al., 2012; Sasagawa et al., 2013; Shalek et al., 2013; Tang et al., 2010; Tang et al., 2009; Treutlein et al., 2014; Xue et al., 2013; Yan et al., 2013).
Using single cell technologies, several studies reported transcriptome analysis of mouse ESCs and uncovered signaling and microRNA pathways that influence heterogeneity of ESCs in culture (Grün et al., 2014; Kumar et al., 2014). More recent studies have also examined transcriptional networks and cell cycle regulators that contribute to transcriptional variation (Kolodziejczyk et al., 2015; Papatsenko et al., 2015). Epigenetic regulation, which may also contribute to overall variability, has not been adequately explored. Moreover, the relevance of ESC culture heterogeneity to early embryonic development has yet to be analyzed.
In this study, we sought to combine the power of microfluidic based single cell mRNA-seq and single cell qPCR to characterize in depth the molecular basis of heterogeneity among mouse ESCs in culture. We employ optimized computational strategies to reveal epigenetic mechanisms contributing to variation in gene expression and search for upstream pathways that induce network plasticity.
Results
Single cell mRNA-seq analysis reveals heterogeneity among mouse ESCs in culture
We performed single cell mRNA-seq analysis of undifferentiated ESCs in culture. Feeder free J1 ESCs were grown in the presence of serum and LIF. Single ESCs were captured on a medium-sized (10–17μm cell diameter) microfluidic RNA-seq chip (Fluidigm) using the Fluidigm C1 system (Figure 1A). Whole-transcriptome sequencing libraries were prepared using template switching based amplification (Figure 1B). We compared the abundance of selected markers from single cell cDNA amplified with the template switching (SMART) method, as well as the sequence specific amplification (SSA) method. Quantitative PCR results from different amplification products revealed comparable expression patterns for wildtype ESCs, namely high level detection of EPI markers Pou5f1, Nanog and Sox2, as well as low level detection of TE markers, Cdx2 and Gata3. From amplified cDNA, we detected a bimodal distribution for Id2 and sharp unimodal distribution for endogenous controls, Actb and Gapdh (Figure 1C).
Figure 1. Single cell mRNA-seq of mouse embryonic stem cells.
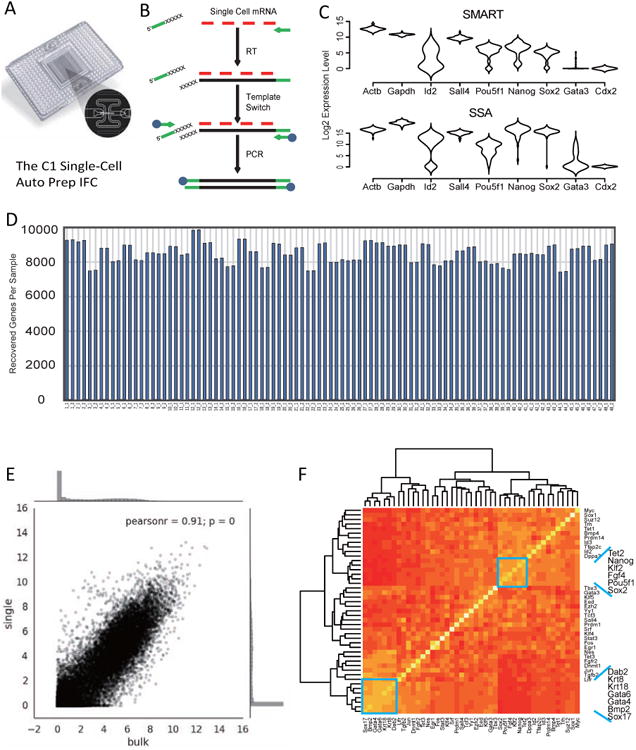
(A) The C1 (Fluidigm) micro-fluidic system for single cell capture and library generation. (B) Protocol for the template-switch method (SMARTer Kit, Clontech) for global mRNA amplification from single cells. (C) Comparison of results from template switching amplification method (SMART) and sequence specific amplification method (SSA) for single cell mRNA quantification. Amplified single cell cDNAs were tested by qPCR using selected gene primers. Expression level distributions are presented as violin plots. (D) Bar chart depicts the number of expressed genes in each single cell mRNA sequencing samples. (E) A scatter plot showing the correlation between J1 ES single cell mRNA-seq data and bulk cell mRNA-seq data. (F) A gene expression correlation heatmap from single cell expression data reveals separation of different gene expression modules that reflect network heterogeneity in mouse ES culture.
Amplified single cell libraries were barcoded, pooled and sequenced to a depth of about 1.2 million reads per sample. For each gene in a sample, the median reads per kilobase of transcript per million reads mapped (RPKM) was ∼10 (Figure S1A and S1B). In order to filter out unreliable signals, we removed genes with low copy counts, and ensured an average Pearson correlation of R=0.8 between two sequencing duplicates for each single cell library (Figure S1C-S1E) (see methods for details). Using this strategy we recover ∼ 9000 genes per cell (Figure 1D). The average of single cell mRNA-seq profiles from ESCs showed high correlation with bulk mRNA-seq profiles from the same cell line (Figure 1E). However, we observed that a fraction of the samples had distinct global signatures from the others, suggesting strong heterogeneity under the tested culture conditions (Figure S1F). Although an endogenous control gene, Actb, and a pluripotency gene, Pou5f1, were homogenously expressed among single cells, we observed strong variation of other markers, including Lamb1, Clu and Snai1 in both J1 and E14 cells (Figure S1G and S1H). By examining the expression correlation of key lineage regulators in the single cell data, we defined different gene modules that correlate with this heterogeneity (Figure 1F). The tightly correlated pluripotency markers, Pou5f1, Sox2, Nanog and Fgf4, define a module for maintaining the undifferentiated ESC state. A Sox17, Gata6 and Gata4 cluster reflects a PE module that is indicative of PE differentiation.
Gene expression variability is associated with distinct chromatin states
In order to study variability of gene expression within the single cell transcriptome data, we first tested different ways to quantify the level of variability. As variability measurements are easily influenced by mean level and amplification bias, we sought to decouple gene expression variation from the mean expression. We fitted a Lowess curve to log2 of the mean expression vs the log2 of the standard deviation, and then calculated the distance from this curve for each gene (Figure 2A). Since the distribution of this distance is approximately normal, we further rescaled the values by converting to z-scores. The resulting value, which we term the Lowess Coefficient of Dispersion (LCOD), is used to quantify the variation of gene expression. We show that LCOD is the least correlated or anti-correlated with the MEAN expression level as compared to other measurements (Figure 2B). We then selected the most (LCOD>1.5) and the least variable genes (LCOD<-1.5). Gene Ontology (GO) enrichment analysis indicated that the most variable genes are related predominantly with developmental processes, while the least variable genes are enriched for translation, mRNA processing and splicing (Figure S2A).
Figure 2. Distinct chromatin states mark gene expression variability.
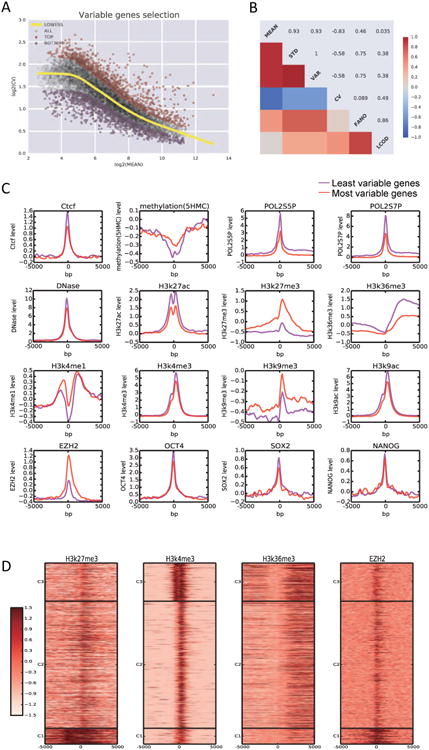
(A) Selection of the most variable genes (red) and the least variable genes (purple) using Lowess Coefficient of Dispersion (LCOD) analysis. (B) The choice of LCOD as the criteria for measuring gene expression variability. (C) Comparison of chromatin states between the most and least variable genes in mouse ES culture. (D) Analysis of selected chromatin marks on the most variable genes reveals 3 clusters of genes with different characteristics.
To investigate the mechanism underlying variability at the single-cell level, we integrated our single cell mRNA-seq data with the genome-wide transcription factor binding and chromatin state information obtained from publicly available bulk-level ChIP-seq datasets. We mapped both transcription factor occupancy and key chromatin marks in a 10kb window at the transcriptional start site of the most and least variable genes. Of note, the master pluripotency regulators, including Oct4, Sox2 and Nanog, displayed similar binding patterns between the most and least variable genes. However, we observed a distinct chromatin state signature associated with the most variable genes, including enrichment of the H3K27me3 mark and Ezh2 occupancy, as well as depletion of H3K36me3. Our analysis suggests that chromatin regulators may play an important role in mediating gene expression variability at the single-cell level (Figure 2C).
We then aimed to further discriminate the list of most variable genes using the chromatin marks found to correlate for gene expression variation. As shown in Figure 2D, we observed three distinct patterns, suggesting multiple pathways leading to fluctuations in gene expression. Cluster 1 genes were strongly enriched for H3K27me3, Ezh2 binding and moderately enriched for H3K4me3, suggesting a role of polycomb group proteins in mediating expression variability. Cluster 2 genes were moderately enriched for H3K27me3, H3K4me3 and H3K36me3. Cluster 3 genes were enriched for H3K4me3 and H3K36me3, indicating a possible role of Setd2.
Importantly, the most variable genes were enriched for previously defined bivalent genes marked by both H3K27me3 and H3K4me3 in their promoters (22% of the most variable vs 6% for all the genes measured in our assay, Figure 2D and Figure S2B to S2D) (Bernstein et al., 2006). We also found that overall gene expression variability was significantly higher among bivalent genes (p = 1.0E-32, KS-test) (Figure S2E). While bivalent genes have been commonly considered to be silent in ESCs, previous studies have been limited to population level analysis. Here, using single-cell analysis we observed that many bivalent genes are in fact actively transcribed in a subset of cells and that the overall distribution is bimodal, suggesting that the transcriptional activities in an ESC may be highly dynamic and that the bivalent domains may play a role in modulating the frequency of gene activation.
Computational analysis reveals ESC early priming pathway
To better understand the complex structure driven by heterogeneity in gene expression we used Locally Linear Embedding (LLE) dimensionality reduction analysis. LLE is an unbiased approach that computes a low dimensional representation of the data preserving the original distances between neighborhoods points (Roweis and Saul, 2000). As seen from the LLE projection, a culture of morphologically “undifferentiated” ESCs was comprised of different subgroups (Figure S3A and S3B). The distribution of cell states suggests a defined pathway exiting pluripotency. In order to delineate this pathway more accurately, we applied a principal curve analysis and reconstructed a smooth path that passes through the cells at all stages (Figure 3A and Figure S3C). By mapping the individual cells onto the principal curve, we identified three distinct cellular states (Figure 3A and S3C). On the left, the closely clustered population corresponds to the naïve ES state. The cells within this population express pluripotency markers (e.g. Nanog, Sox2 and Klf2) at high level (Figure 3A and S3C). In addition, expression of differentiation markers was not detected in this group. On the top of the curve, we defined a previously unrecognized population, consisting of “primed” cells. These ESCs simultaneously express pluripotent markers (e.g. Sox2 and Nanog) and differentiation markers (e.g. Gata4, Gata6 and Lamb1). This population appears to represent a transcriptionally primed cellular state in which cells are exiting the naïve ES state and under transition to a differentiated state. The third cluster of cells express Gata6 and Gata4 at high level and pluripotent markers at low level. Cells of this population are predominantly representative of PE lineage cells, which are considered to be the default differentiation state for wild-type ESCs in culture. Of note, expression of Tet1, Ezh2 and Suz12 was high in the naïve state, reduced in the primed state, and then repressed in differentiated cells (Figure S3C), whereas the endogenous control markers, Actb and Gapdh, were robustly expressed in all cells.
Figure 3. Computational analysis reveals ESC priming pathway.
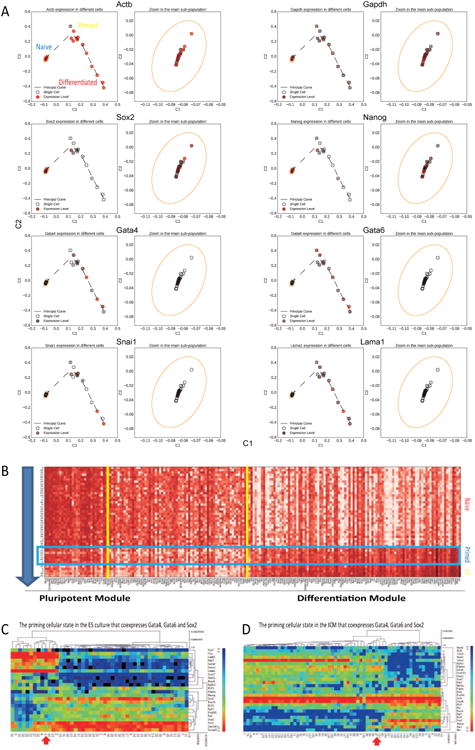
(A) Local linear embedding plus the principal curve analysis reveals early priming pathway in the mouse ESCs in culture. (B) Expression pattern of most variable genes through the ES cell priming pathway indicates a transitional state that co-expresses pluripotent markers and differentiation markers. (C) Hierarchical clustering of single cell gene expression data reveals the primed pluripotent cells in ESC culture. (D) Hierarchical clustering of single cell gene expression data reveals the primed pluripotent cells in the blastocyst stage ICM. Note that the primed EPI cells co-express pluripotent markers and PE markers.
To examine in a systematic fashion the contribution of each gene to the pluripotency exit pathway, we calculated the Pearson correlation between its expression level in a cell and the mapped position on the principal curve. For the most variable genes, we identified a subset whose expression levels were highly correlated with the differentiation path, including Lama1 and Lamb1 (Figure S3D). These genes are likely to play an important role in initiating cell differentiation. Similarly, we also identified another subset whose expression levels are anti-correlated with the differentiation path, such as Tet1 and Tet2. These genes are likely to play an important role in maintenance of pluripotency. Figure 3B depicts an expression heatmap of highlighted genes along the early ES cell differentiation path. In the heatmap, we show that primed cells co-express pluripotent and differentiation modules.
The primed ESC state maintains a distinct gene expression signature (Figure S3E). Hierarchical clustering of single cell data also distinguishes this state as a unique cell type cluster that co-expresses pluripotency markers and differentiation markers (Figure 3C). In order to link the state with in vivo developmental processes, we reanalyzed previously published single cell data from blastocyst stage ICM cells (Guo et al., 2010). We found a corresponding primed cell type cluster that is distinct from known PE and EPI cell clusters in the blastocyst ICM (Figure 3D). The special cluster of blastocyst cells also co-expresses Sox2, Gata4 and Gata6. The identification of a primed state adds to the complexity of seemingly homogenous pluripotent cells, and suggests stepwise exit from the naïve pluripotent state both in vitro and in vivo.
External culture system affects network variability
A central question regarding cellular heterogeneity is whether variability in gene expression is derived from internal transcriptional “noise” or results from fluctuation in response to external signals. To address this question, we searched for upstream regulators of the variably expressed genes defined by our analysis. We used the Haystack pipeline (Pinello et al., 2014) to identify enriched transcription factor motifs upstream of different groups of highly variable genes (Figure 4A). For Cluster 1 variable genes, we observed enrichment for a motif recognized by Zbtb33. For Cluster 2 genes, the motif for TCF factors was enriched. For Cluster 3 genes, the most enriched motif corresponded to that for serum response factor, SRF. TCF factors lie downstream of Glycogen synthase kinase 3 (GSK3) pathways in ESCs (Martello et al., 2012). SRF is a critical transcription factor that binds to the c-fos serum response element (Norman et al., 1988) that lies downstream of serum response and the MAPK pathways (Hill et al., 1993). These clues suggest that the serum-based culture conditions generally employed for ESCs might be a major contributor to variable gene expression observed in single cell analysis. Indeed, downstream effectors for these signaling pathways are highly variable in cultured ESCs. (Figure S4A and S4B).
Figure 4. External culture system affects ES network stability.
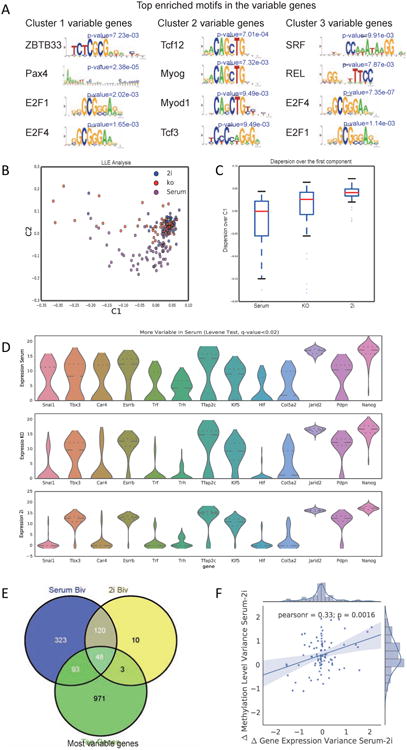
(A) Motif analysis of most variable genes predicts the roles of several important signaling pathways in regulating gene expression variability. (B) LLE projection of single cell analysis data from ESCs cultured with serum, knockout serum replacement, or 2i medium. (C) Box plots for the expression distribution over the first PC reveal reduced gene variability in the 2i medium cultured ESCs. (D) Violin plots showing expression level distribution of selected genes in ESCs cultured with serum, knockout serum replacement, or 2i medium. (E) 2i medium reduces bivalency in the list of most variable genes defined with serum cultured ESCs. (F) Correlation of single cell level gene expression variability and single cell level DNA methylation variability in 2i and serum cultured ESCs.
Besides the classical serum-based culture conditions, a serum free 2i culture system targeting both the MAPK and GSK3 pathways has been found to maintain mouse ESC pluripotency (Ying et al., 2008). To ascertain the contribution of serum-based culture conditions on expression variability, we assessed expression in J1 ESCs at the single cell level in medium containing normal serum, knockout serum replacement, or 2i chemicals (PD184352 and CHIR99021). We analyzed these three ESC cultures using a more cost effective single cell qPCR protocol that we previously described (Guo et al., 2013). We selected 96 genes for analysis, including known pluripotency regulators and differentiation markers, as well genes that displayed strong variability under standard culture conditions.
On examination of the single cell data from cells under the three culture conditions, we found that ESCs cultured in serum expressed more markers of differentiation (e.g. Id2, Lamb1 and Snai1) than ESCs in 2i medium (Figure S4C). On LLE projection of single cell data, global expression of 2i ESCs was more tightly distributed than that of ESCs cells cultured in serum or serum replacement (Figure 4B). Specifically, by focusing on distribution over the first principal component and distribution of expression standard deviation, we confirmed that ESCs cultured in 2i medium exhibit the least variation. Medium with serum led to the greatest heterogeneity in expression (Figure 4C, 4D and S4D). As revealed by violin plots in Figure 4D, the expression distribution of key regulators suggested a more homogenous transcriptional network in 2i ESCs. For example, Tbx3, which is a highly variable pluripotency marker, showed clear bimodal distribution in serum cultured ESCs. However, under 2i conditions, the percentage of Tbx3 expressing cells was significantly increased, while the differentiation priming marker Snai1 was repressed. These findings were confirmed in E14 ESCs, as well as an independent clone of J1 ES cells (Figure S4E).
We next asked whether the reduced heterogeneity under 2i conditions was accompanied with altered epigenetic status. We searched for an effect of 2i culture on the bivalent marks of highly variable genes using available epigenomic data (Marks et al., 2012). The overall number of bivalent genes was reduced dramatically in 2i cultured ESCs, as compared with ESCs cultured in serum-containing medium (Figure S4F). We also found that among the most variable genes defined in serum cultured ESCs, two thirds of bivalent markers lost their bivalency in 2i conditions (Figure 4E).
We then utilized published single cell DNA methylation data (Smallwood et al., 2014) to interrogate the link between gene expression variation and DNA methylation variation. For each gene we considered the region [TSS-2kb, TES+2kb] and calculated the difference in methylation variance between serum and 2i conditions. Interestingly, we found a moderate correlation (r=0.33, p-value=0.0016) between the difference in methylation variance and the difference in gene expression variance between serum and 2i conditions (Figure 4F). When cells were cultured with serum, Tbx3 and Snai1, two variable markers in ESCs, showed strong variation of DNA methylation level in gene bodies. However, when cultured with 2i medium, such epigenetic variation was significantly reduced (Figure S4G), suggesting that reduction of DNA methylation variability may in part contribute to reduction of gene expression variability.
In summary, the nature of the culture conditions represents an important contributor to bivalency, gene expression variation, and DNA methylation variation in mouse ESCs. With replacement of serum and proper targeting of the related signaling pathways, variability among ESCs is largely controllable without hampering pluripotency and self-renewal.
Discussion
Cellular heterogeneity has been accepted as a hallmark of both embryonic and adult stem cells (Graf and Stadtfeld, 2008; Chambers et al., 2007). It has been proposed that variation in gene expression arises from transcriptional noise and network fluctuation, and that associated heterogeneity accounts for stochasticity of cell fate decisions in stem and progenitor cells (Chang et al., 2008). Using mouse ESCs as a model, we have investigated global gene expression variability at single cell resolution.
In agreement with recently published single cell analyses of mouse ESCs (Grün et al., 2014; Kolodziejczyk et al., 2015; Kumar et al., 2014; Papatsenko et al., 2015), we observed significant heterogeneity in gene expression in the serum cultured mouse ESCs. Using LLE analysis, we showed that heterogeneity does not appear to be stochastic, but rather follows a defined differentiation pathway towards PE-like cells. Importantly, we defined a primed ESC state that reflects transition from a naïve to differentiated state. ESCs in the primed state co-express pluripotency and differentiation modules. We have also provided evidence that the primed state is developmentally relevant, as the same signature is found in the developing mouse blastocyst during PE and EPI lineage specification.
Prior studies emphasized transcriptional networks and microRNA pathways that lead to gene expression variation (Kolodziejczyk et al., 2015; Kumar et al., 2014). In the current work we associate gene expression variation with epigenetic characteristics. We used LCOD analysis to extract true variability from mean expression level, and describe the unique epigenetic status that distinguishes the highly variable genes. We propose that a proportion of previously defined bivalent marked genes are actually highly variable in their expression in cultured ESCs, suggesting a possible role for bivalent domains in modulating the frequency of transcription activation. One caveat is that ChIP-seq data are obtained from population level studies. As a result, it remains unclear whether bivalent domains are established in all cells or only a fraction of cells. Future developments of methods for the mapping of epigenetic marks at single cell resolution are needed to resolve these issues.
Importantly, we demonstrated that the culture environment contributes strongly to observed gene expression variability. Upon replacement of serum and targeting the MAPK and GSK3 pathways by 2i conditions, ESCs in culture exhibit greater homogeneity in gene expression. Our results confirm findings from other recent studies (Grün et al., 2014; Kumar et al., 2014). The FGF and MAPK pathway are closely related with EPI cell differentiation (Ying et al., 2008; Guo et al., 2010). WNT and GSK3 signaling has been implicated in control of gene expression noise during development (Arias and Hayward, 2005). Using motif analysis, we have connected gene expression variation with these important signaling pathways. Interestingly, replacing serum with knockout serum replacement alone also reduces gene expression variation, suggesting that other serum responsive pathways contribute to ESC culture heterogeneity. Moreover, we show that 2i cultured ESCs exhibit reduced bivalency, and altered single cell level gene expression variation correlates with single cell level methylation status. We provide an example that gene expression variation is controllable through proper perturbation of key signaling pathways.
The plasticity of mammalian cellular states complicates an understanding of cell fate decision mechanisms. Comprehensive characterization of dynamic stem cell differentiation pathways requires single cell gene expression analysis. Acquisition of similar analyses from different cellular systems should eventually allow for the mapping of the cell fate decision landscape and the modeling of dynamic network configurations during mammalian development.
Experimental Procedures
Cell culture
Mouse ESCs were cultured in feeder-free conditions. Cells cultured in serum were grown in Dulbecco's Modified Eagle Medium (DMEM) + Glutamax (Gibco) + 15% fetal bovine serum (FBS, Gemini) + penicillin/streptomycin (Gibco) + non-essential amino acids (NEAA) (Gibco) + b-mercaptoethanol (EmbryoMax ES cell -qualified, Millipore) + 1,000U/ml leukaemia inhibitory factor (LIF, Millipore). Cells cultured in knockout serum replacement were grown in Dulbecco's Modified Eagle Medium (DMEM) + Glutamax (Gibco) + 20% knockout serum replacement (Gibco) + penicillin/streptomycin (Gibco) + non-essential amino acids (NEAA) (Gibco) + b-mercaptoethanol (EmbryoMax ES cell-qualified, Millipore) + 1,000U/ml leukaemia inhibitory factor (LIF, Millipore). Cells cultured in 2i medium were grown in Dulbecco's Modified Eagle Medium (DMEM) + Glutamax (Gibco) + 20% knockout serum replacement (Gibco) + penicillin/streptomycin (Gibco) + non-essential amino acids (NEAA) (Gibco) + b-mercaptoethanol (EmbryoMax ES cell-qualified, Millipore) + 1,000U/ml leukaemia inhibitory factor (LIF, Millipore) + 1 mM MEK inhibitor PD0325901 (StemGent) + 3 mM GSK3 inhibitor CHIR99021 (StemGent). Cells from the same line same stock and same passage were used for the culture system comparison experiment from Figure 4B, 4C and 4D.
Single cell mRNA-seq
Feeder free J1 ESCs were grown in the presence of serum and LIF. ESCs were dispersed via Trypsin-EDTA treatment. Single-cell whole transcriptome amplification was performed using the FluidigmC1 Single-Cell Auto Prep System (C1 System) according to the manufacturer's recommendations (full details available at http://www.fluidigm.com). Amplified cDNAs were diluted with C1 DNA dilution reagent, quantified using Quant-it HS system, and validated by qPCR with selected primers. Successfully amplified single-cell cDNA samples were selected and diluted to the same concentration. Single-cell libraries were constructed using the Nextera XT DNA Sample Preparation kit (Illumina), pooled using Nextera XT DNA Sample Preparation Index Kit (Illumina) and then sequenced using Hiseq 2500 (Illumina). Each library was sequenced twice on two lanes.
Single cell qPCR
Individual primer sets (total of 96) were pooled to a final concentration of 0.1μM for each primer. Individual cells were sorted directly into 96 well PCR plates loaded with 5μL RT-PCR master mix (2.5μL CellsDirect reaction mix, Invitrogen; 0.5μL primer pool; 0.1μL RT/Taq enzyme, Invitrogen; 1.9μL nuclease free water) in each well. Sorted plates were immediately frozen on dry ice. After brief centrifugation at 4°C, the plates were placed immediately on PCR machine. Cell lyses and sequence-specific reverse transcription were performed at 50°C for 60 minutes. Then, reverse transcriptase inactivation and Taq polymerase activation was achieved by heating to 95°C for 3 min. Subsequently, in the same tube, cDNA was subjected to 20 cycles of sequence-specific amplification by denaturing at 95°C for 15 sec, annealing and elongation at 60°C for 15 min. After preamplification, PCR plates were stored at -80°C to avoid evaporation. Pre-amplified products were diluted 5-fold prior to analysis. Amplified single cell samples were analyzed with Universal PCR Master Mix (Applied Biosystems), EvaGreen Binding Dye (Biotium) and individual qPCR primers using 96.96 Dynamic Arrays on a BioMark System (Fluidigm). Ct values were calculated using the BioMark Real-Time PCR Analysis software (Fluidigm).
Supplementary Material
Acknowledgments
We thank Y. Fujiwara, M. Nguyen, HE. Benjamin, A. Saadatpour, E. Maerco, Z. Shao for help on experiments. Y. Zhang, Z. Li, H. Ouyang, Y. Zhou, J. Ji for insightful discussions on the project. This work was supported by funding from NIH and the Harvard Stem Cell Institute (S.H.O). S.H.O. is an investigator of the Howard Hughes Medical Institute (HHMI). G.G. is supported by 1000 youth talent program from China. L.P. is supported by NHGRI Career Development Award K99HG008399.
Footnotes
Accession Numbers: All RNA-seq data are submitted to GEO, with the accession number GEO: GSE75804
Author Contributions: Conceptualization, G.G., L.P., G-C.Y. and S.H.O.; Methodology, G.G., L.P. and X.H.; Investigation, G.G., L.P., X.H., S.L., L.S., T-W.L.; Writing - Original Draft, G.G. and L.P.; Writing – Review & Editing, K.Z., G-C.Y and S.H.O.; Supervision, S.H.O; Funding Acquisition, S.H.O.
The authors declare no conflict of interest.
Publisher's Disclaimer: This is a PDF file of an unedited manuscript that has been accepted for publication. As a service to our customers we are providing this early version of the manuscript. The manuscript will undergo copyediting, typesetting, and review of the resulting proof before it is published in its final citable form. Please note that during the production process errors may be discovered which could affect the content, and all legal disclaimers that apply to the journal pertain.
References
- Anders S, Huber W. Differential expression analysis for sequence count data. Genome Biol. 2010;11:R106. doi: 10.1186/gb-2010-11-10-r106. [DOI] [PMC free article] [PubMed] [Google Scholar]
- Arias AM, Hayward P. Filtering transcriptional noise during development: concepts and mechanisms. Nat Rev Genet. 2006;7:34–44. doi: 10.1038/nrg1750. [DOI] [PubMed] [Google Scholar]
- Bendall SC, Simonds EF, Qiu P, Amir el AD, Krutzik PO, Finck R, Bruggner RV, Melamed R, Trejo A, Ornatsky OI, et al. Single-cell mass cytometry of differential immune and drug responses across a human hematopoietic continuum. Science. 2011;332:687–696. doi: 10.1126/science.1198704. [DOI] [PMC free article] [PubMed] [Google Scholar]
- Bernstein BE, Mikkelsen TS, Xie X, Kamal M, Huebert DJ, Cuff J, Fry B, Meissner A, Wernig M, Plath K, et al. A bivalent chromatin structure marks key developmental genes in embryonic stem cells. Cell. 2006;125:315–326. doi: 10.1016/j.cell.2006.02.041. [DOI] [PubMed] [Google Scholar]
- Buganim Y, Faddah DA, Cheng AW, Itskovich E, Markoulaki S, Ganz K, Klemm SL, van Oudenaarden A, Jaenisch R. Single-cell expression analyses during cellular reprogramming reveal an early stochastic and a late hierarchic phase. Cell. 2012;150:1209–1222. doi: 10.1016/j.cell.2012.08.023. [DOI] [PMC free article] [PubMed] [Google Scholar]
- Chambers I, Silva J, Colby D, Nichols J, Nijmeijer B, Robertson M, Vrana J, Jones K, Grotewold L, Smith A. Nanog safeguards pluripotency and mediates germline development. Nature. 2007;450:1230–1234. doi: 10.1038/nature06403. [DOI] [PubMed] [Google Scholar]
- Chang HH, Hemberg M, Barahona M, Ingber DE, Huang S. Transcriptome-wide noise controls lineage choice in mammalian progenitor cells. Nature. 2008;453:544–547. doi: 10.1038/nature06965. [DOI] [PMC free article] [PubMed] [Google Scholar]
- Dalerba P, Kalisky T, Sahoo D, Rajendran PS, Rothenberg ME, Leyrat AA, Sim S, Okamoto J, Johnston DM, Qian D, et al. Single-cell dissection of transcriptional heterogeneity in human colon tumors. Nat Biotechnol. 2011;29:1120–1127. doi: 10.1038/nbt.2038. [DOI] [PMC free article] [PubMed] [Google Scholar]
- Dobin A, Davis CA, Schlesinger F, Drenkow J, Zaleski C, Jha S, Batut P, Chaisson M, Gingeras TR. STAR: ultrafast universal RNA-seq aligner. Bioinformatics. 2013;29:15–21. doi: 10.1093/bioinformatics/bts635. [DOI] [PMC free article] [PubMed] [Google Scholar]
- Evans MJ, Kaufman MH. Establishment in culture of pluripotential cells from mouse embryos. Nature. 1981;292:154–156. doi: 10.1038/292154a0. [DOI] [PubMed] [Google Scholar]
- Fan HC, Fu GK, Fodor SP. Expression profiling. Combinatorial labeling of single cells for gene expression cytometry. Science. 2015;347:1258367. doi: 10.1126/science.1258367. [DOI] [PubMed] [Google Scholar]
- Graf T, Stadtfeld M. Heterogeneity of embryonic and adult stem cells. Cell Stem Cell. 2008;3:480–483. doi: 10.1016/j.stem.2008.10.007. [DOI] [PubMed] [Google Scholar]
- Grun D, Kester L, van Oudenaarden A. Validation of noise models for single-cell transcriptomics. Nat Methods. 2014;11:637–640. doi: 10.1038/nmeth.2930. [DOI] [PubMed] [Google Scholar]
- Guo G, Huss M, Tong GQ, Wang C, Li Sun L, Clarke ND, Robson P. Resolution of cell fate decisions revealed by single-cell gene expression analysis from zygote to blastocyst. Dev Cell. 2010;18:675–685. doi: 10.1016/j.devcel.2010.02.012. [DOI] [PubMed] [Google Scholar]
- Guo G, Luc S, Marco E, Lin TW, Peng C, Kerenyi MA, Beyaz S, Kim W, Xu J, Das PP, et al. Mapping cellular hierarchy by single-cell analysis of the cell surface repertoire. Cell Stem Cell. 2013;13:492–505. doi: 10.1016/j.stem.2013.07.017. [DOI] [PMC free article] [PubMed] [Google Scholar]
- Hashimshony T, Wagner F, Sher N, Yanai I. CEL-Seq: single-cell RNA-Seq by multiplexed linear amplification. Cell Rep. 2012;2:666–673. doi: 10.1016/j.celrep.2012.08.003. [DOI] [PubMed] [Google Scholar]
- Hayashi K, Lopes SM, Tang F, Surani MA. Dynamic equilibrium and heterogeneity of mouse pluripotent stem cells with distinct functional and epigenetic states. Cell Stem Cell. 2008;3:391–401. doi: 10.1016/j.stem.2008.07.027. [DOI] [PMC free article] [PubMed] [Google Scholar]
- Hill CS, Marais R, John S, Wynne J, Dalton S, Treisman R. Functional analysis of a growth factor-responsive transcription factor complex. Cell. 1993;73:395–406. doi: 10.1016/0092-8674(93)90238-l. [DOI] [PubMed] [Google Scholar]
- Islam S, Kjallquist U, Moliner A, Zajac P, Fan JB, Lonnerberg P, Linnarsson S. Characterization of the single-cell transcriptional landscape by highly multiplex RNA-seq. Genome Res. 2011;21:1160–1167. doi: 10.1101/gr.110882.110. [DOI] [PMC free article] [PubMed] [Google Scholar]
- Jaitin DA, Kenigsberg E, Keren-Shaul H, Elefant N, Paul F, Zaretsky I, Mildner A, Cohen N, Jung S, Tanay A, et al. Massively parallel single-cell RNA-seq for marker-free decomposition of tissues into cell types. Science. 2014;343:776–779. doi: 10.1126/science.1247651. [DOI] [PMC free article] [PubMed] [Google Scholar]
- Klein AM, Mazutis L, Akartuna I, Tallapragada N, Veres A, Li V, Peshkin L, Weitz DA, Kirschner MW. Droplet barcoding for single-cell transcriptomics applied to embryonic stem cells. Cell. 2015;161:1187–1201. doi: 10.1016/j.cell.2015.04.044. [DOI] [PMC free article] [PubMed] [Google Scholar]
- Kolodziejczyk AA, Kim JK, Tsang JC, Ilicic T, Henriksson J, Natarajan KN, Tuck AC, Gao X, Buhler M, Liu P, et al. Single Cell RNA-Sequencing of Pluripotent States Unlocks Modular Transcriptional Variation. Cell Stem Cell. 2015;17:471–485. doi: 10.1016/j.stem.2015.09.011. [DOI] [PMC free article] [PubMed] [Google Scholar]
- Kumar RM, Cahan P, Shalek AK, Satija R, DaleyKeyser AJ, Li H, Zhang J, Pardee K, Gennert D, Trombetta JJ, et al. Deconstructing transcriptional heterogeneity in pluripotent stem cells. Nature. 2014;516:56–61. doi: 10.1038/nature13920. [DOI] [PMC free article] [PubMed] [Google Scholar]
- Macosko EZ, Basu A, Satija R, Nemesh J, Shekhar K, Goldman M, Tirosh I, Bialas AR, Kamitaki N, Martersteck EM, et al. Highly Parallel Genome-wide Expression Profiling of Individual Cells Using Nanoliter Droplets. Cell. 2015;161:1202–1214. doi: 10.1016/j.cell.2015.05.002. [DOI] [PMC free article] [PubMed] [Google Scholar]
- Marks H, Kalkan T, Menafra R, Denissov S, Jones K, Hofemeister H, Nichols J, Kranz A, Stewart AF, Smith A, et al. The transcriptional and epigenomic foundations of ground state pluripotency. Cell. 2012;149:590–604. doi: 10.1016/j.cell.2012.03.026. [DOI] [PMC free article] [PubMed] [Google Scholar]
- Martello G, Sugimoto T, Diamanti E, Joshi A, Hannah R, Ohtsuka S, Gottgens B, Niwa H, Smith A. Esrrb is a pivotal target of the Gsk3/Tcf3 axis regulating embryonic stem cell self-renewal. Cell Stem Cell. 2012;11:491–504. doi: 10.1016/j.stem.2012.06.008. [DOI] [PMC free article] [PubMed] [Google Scholar]
- Moignard V, Macaulay IC, Swiers G, Buettner F, Schutte J, Calero-Nieto FJ, Kinston S, Joshi A, Hannah R, Theis FJ, et al. Characterization of transcriptional networks in blood stem and progenitor cells using high-throughput single-cell gene expression analysis. Nat Cell Biol. 2013;15:363–372. doi: 10.1038/ncb2709. [DOI] [PMC free article] [PubMed] [Google Scholar]
- Norman C, Runswick M, Pollock R, Treisman R. Isolation and properties of cDNA clones encoding SRF, a transcription factor that binds to the c-fos serum response element. Cell. 1988;55:989–1003. doi: 10.1016/0092-8674(88)90244-9. [DOI] [PubMed] [Google Scholar]
- Papatsenko D, Darr H, Kulakovskiy IV, Waghray A, Makeev VJ, MacArthur BD, Lemischka IR. Single-Cell Analyses of ESCs Reveal Alternative Pluripotent Cell States and Molecular Mechanisms that Control Self-Renewal. Stem cell reports. 2015;5:207–220. doi: 10.1016/j.stemcr.2015.07.004. [DOI] [PMC free article] [PubMed] [Google Scholar]
- Pinello L, Xu J, Orkin SH, Yuan GC. Analysis of chromatin-state plasticity identifies cell-type-specific regulators of H3K27me3 patterns. Proceedings of the National Academy of Sciences of the United States of America. 2014;111:E344–353. doi: 10.1073/pnas.1322570111. [DOI] [PMC free article] [PubMed] [Google Scholar]
- Ramskold D, Luo S, Wang YC, Li R, Deng Q, Faridani OR, Daniels GA, Khrebtukova I, Loring JF, Laurent LC, et al. Full-length mRNA-Seq from single-cell levels of RNA and individual circulating tumor cells. Nat Biotechnol. 2012;30:777–782. doi: 10.1038/nbt.2282. [DOI] [PMC free article] [PubMed] [Google Scholar]
- Roweis ST, Saul LK. Nonlinear dimensionality reduction by locally linear embedding. Science. 2000;290:2323–2326. doi: 10.1126/science.290.5500.2323. [DOI] [PubMed] [Google Scholar]
- Sasagawa Y, Nikaido I, Hayashi T, Danno H, Uno KD, Imai T, Ueda HR. Quartz-Seq: a highly reproducible and sensitive single-cell RNA sequencing method, reveals non-genetic gene-expression heterogeneity. Genome Biol. 2013;14:R31. doi: 10.1186/gb-2013-14-4-r31. [DOI] [PMC free article] [PubMed] [Google Scholar]
- Shalek AK, Satija R, Adiconis X, Gertner RS, Gaublomme JT, Raychowdhury R, Schwartz S, Yosef N, Malboeuf C, Lu D, et al. Single-cell transcriptomics reveals bimodality in expression and splicing in immune cells. Nature. 2013;498:236–240. doi: 10.1038/nature12172. [DOI] [PMC free article] [PubMed] [Google Scholar]
- Smallwood SA, Lee HJ, Angermueller C, Krueger F, Saadeh H, Peat J, Andrews SR, Stegle O, Reik W, Kelsey G. Single-cell genome-wide bisulfite sequencing for assessing epigenetic heterogeneity. Nat Methods. 2014;11:817–820. doi: 10.1038/nmeth.3035. [DOI] [PMC free article] [PubMed] [Google Scholar]
- Tang F, Barbacioru C, Bao S, Lee C, Nordman E, Wang X, Lao K, Surani MA. Tracing the derivation of embryonic stem cells from the inner cell mass by single-cell RNA-Seq analysis. Cell Stem Cell. 2010;6:468–478. doi: 10.1016/j.stem.2010.03.015. [DOI] [PMC free article] [PubMed] [Google Scholar]
- Tang F, Barbacioru C, Wang Y, Nordman E, Lee C, Xu N, Wang X, Bodeau J, Tuch BB, Siddiqui A, et al. mRNA-Seq whole-transcriptome analysis of a single cell. Nat Methods. 2009;6:377–382. doi: 10.1038/nmeth.1315. [DOI] [PubMed] [Google Scholar]
- Treutlein B, Brownfield DG, Wu AR, Neff NF, Mantalas GL, Espinoza FH, Desai TJ, Krasnow MA, Quake SR. Reconstructing lineage hierarchies of the distal lung epithelium using single-cell RNA-seq. Nature. 2014;509:371–375. doi: 10.1038/nature13173. [DOI] [PMC free article] [PubMed] [Google Scholar]
- Xue Z, Huang K, Cai C, Cai L, Jiang CY, Feng Y, Liu Z, Zeng Q, Cheng L, Sun YE, et al. Genetic programs in human and mouse early embryos revealed by single-cell RNA sequencing. Nature. 2013;500:593–597. doi: 10.1038/nature12364. [DOI] [PMC free article] [PubMed] [Google Scholar]
- Yan L, Yang M, Guo H, Yang L, Wu J, Li R, Liu P, Lian Y, Zheng X, Yan J, et al. Single-cell RNA-Seq profiling of human preimplantation embryos and embryonic stem cells. Nat Struct Mol Biol. 2013;20:1131–1139. doi: 10.1038/nsmb.2660. [DOI] [PubMed] [Google Scholar]
- Ying QL, Wray J, Nichols J, Batlle-Morera L, Doble B, Woodgett J, Cohen P, Smith A. The ground state of embryonic stem cell self-renewal. Nature. 2008;453:519–523. doi: 10.1038/nature06968. [DOI] [PMC free article] [PubMed] [Google Scholar]
Associated Data
This section collects any data citations, data availability statements, or supplementary materials included in this article.