

Abstract
Fungal aerosols consist of spores and fragments with diverse array of morphologies; however, the size, shape, and origin of the constituents require further characterization. In this study, we characterize the profile of aerosols generated from Aspergillus fumigatus, A. versicolor, and Penicillium chrysogenum grown for 8 weeks on gypsum boards. Fungal particles were aerosolized at 12 and 20 L min−1 using the Fungal Spore Source Strength Tester (FSSST) and the Stami particle generator (SPG). Collected particles were analyzed with field emission scanning electron microscopy (FESEM). We observed spore particle fraction consisting of single spores and spore aggregates in four size categories, and a fragment fraction that contained submicronic fragments and three size categories of larger fragments. Single spores dominated the aerosols from A. fumigatus (median: 53%), while the submicronic fragment fraction was the highest in the aerosols collected from A. versicolor (median: 34%) and P. chrysogenum (median: 31%). Morphological characteristics showed near spherical particles that were only single spores, oblong particles that comprise some spore aggregates and fragments (<3.5 μm), and fiber-like particles that regroup chained spore aggregates and fragments (>3.5 μm). Further, the near spherical particles dominated the aerosols from A. fumigatus (median: 53%), while oblong particles were dominant in the aerosols from A. versicolor (68%) and P. chrysogenum (55%). Fiber-like particles represented 21% and 24% of the aerosols from A. versicolor and P. chrysogenum, respectively. This study shows that fungal particles of various size, shape, and origin are aerosolized, and supports the need to include a broader range of particle types in fungal exposure assessment.
Introduction
Indoor environments with a high moisture content often result in saprophytic fungal colonization of structural building materials. Fungal colonization of these indoor environments in combination with indoor dampness has been associated with adverse health outcomes (Institute of Medicine 2004; World Health Organization 2009). However, epidemiological and exposure studies including the assessment of fungal spore exposure in indoor air could not confirm such an association (Eduard 2009). Epidemiological studies based on traditional methods of identification and quantification of fungal spores or fungal colony forming units have not provided insight into health effects from other airborne fungal particles such as fragments of spores and hyphae.
The composition of fungal aerosols is diverse and comprises particles of various sizes, shapes and origin (spores and mycelia), thus with varying aerodynamic behavior (Lacey 1991). Single spores from many molds encountered in indoor environments are globose or ellipsoidal with smooth or ornamented surface (Reponen et al. 2001) while chained spore aggregates are often elongated and fiber-like. Moreover, hyphal fragments have various morphologies: they can be tubular, elongate or fiber-like and irregular.
The aerodynamic diameter of particles is commonly used in the prediction of particle motion and deposition in human respiratory tract. Shape also influences motion and deposition of particles in human respiratory tract (Yeh et al. 1976) and aerosol samplers. For nonspherical or irregular particles, aerodynamic size is dependent on the particle shape and surface structures (Cox 1995) therefore one-dimensional size measurement poorly describes irregular or fibrous shaped particles. To date, little is known about the shape of various particle types reported as fungal aerosols except for the distribution of single spores and aggregates. Moreover, detailed characteristics of the fungal aerosol profile are unknown.
The morphology and size of spores, and hyphal and spore fragments have been assessed by microscopy in attempts to describe the fungal aerosols (Pady and Kramer 1960; Pady and Gregory 1963; Eduard et al. 1988, 1990; Heikkila et al. 1988; Karlsson and Malmberg 1989; Green et al. 2005; Halstensen et al. 2007; Afanou et al. 2014; Vestlund et al. 2014). Quantification and size-characterization of fungal particles have also been performed by measuring the optical or aerodynamic diameter of aerosol particles using automatic particle counters or sizers. For this purpose, a fairly narrow size range has been used to discriminate spores from fragments in aerosols generated from fungal cultures (Kildesø et al. 2000, 2003; Górny et al. 2002; Sivasubramani et al. 2004; Kanaani et al. 2009; Górny and Ławniczek-Wałczyk 2012). This approach led to the discovery of submicronic fragments. Fungal biomarkers such as ergosterol (Rao et al. 2005; Lau et al. 2006; Menetrez et al. 2009), phospholipid fatty acids (Womiloju et al. 2003) and β-glucans (Rao et al. 2005; Reponen et al. 2007; Adhikari et al. 2009; Madsen et al. 2009; Singh et al. 2011; Frankel et al. 2013; Seo et al. 2009, 2014) have also been used to demonstrate the presence of fungal biomass in various sizes of fungal aerosols. Further, enzymes, (e.g., chitinases [Madsen et al. 2005, 2009; Madsen 2012]), antigens (Górny et al. 2002) and allergens (Menetrez et al. 2001) as well as mycotoxins (Sorenson et al. 1987; Brasel et al. 2005) have been used to demonstrate allergenicity and toxicity potential of various size fractions of the fungal aerosols. Actually, the cut-off characteristics of the size-selective samplers are decisive for the separation efficiency.
The toxicological and immunological properties of allergen-bearing fine particles have been found to be strongly correlated with the particle number and overall surface than the particle mass (Nygaard et al. 2004). Thus, it can be hypothesized that the number of fungal particles with aerodynamic diameter <2.5 μm may show stronger correlations with observed health outcomes, than with mass. Moreover, hyphae have been shown to elicit stronger allergic inflammation as compared to single spores that induced non-allergic inflammatory responses (Bozza et al. 2002; Hohl et al. 2005). Also, Branzk et al. showed that neutrophils with mechanisms of neutrophils extracellular traps (NETosis) and reactive oxidative species (ROS) were involved in clearance of fiber-like particles and large spore aggregates (Branzk et al. 2014). A detailed description of the fungal aerosol by simultaneous assessment of physical size, shape, and particle numbers is only possible by microscopy (Cox 1995).
Following our previous publication on the enumeration and origin of submicronic fungal fragments by high-resolution microscopy (Afanou et al. 2014), we describe in this study the morphology of fragments and spore particles, and their distribution in in vitro generated fungal aerosols. The size, shape and origin characteristics of various fungal particle types are described, as well as the profile of the aerosols generated from pure fungal cultures. The effect of generators and airflows used on the whole-aerosol composition was also investigated.
Materials and Methods
Fungal Culture
Isolates of Aspergillus fumigatus Fresenius 1863 (strain A1258 FGSC) obtained from the Fungal Genetics Stock Center (University of Missouri, Kansas City, KS), Aspergillus versicolor Tirobaschi 1908 (strain VI 03554), and Penicillium chrysogenum Thom 1910 (strain VI 04528) obtained from the Section of Mycology at the Norwegian Veterinary Institute (Oslo, Norway) were used. The characteristics of these fungal isolates and the procedure for inoculum preparation have been previously described elsewhere (Afanou et al. 2014). Briefly, spores from 2-week-old cultures grown on malt extract agar (MEA) (Samson et al. 2004) were harvested by gently scraping cultures submerged in 20 mL phosphate buffered saline (PBS) containing 0.1% Tween 20 using a sterile inoculation loop. The spore suspension was transferred into 50 mL centrifuge tubes and resuspended by vortexing for 2 × 30 seconds followed by sonication for 3 min in an ultrasonic bath at a frequency of 35 kHz (Sonorex RK 510H, Bandalin Electric, Berlin, Germany). The suspension was filtered through a 10 μm nylon mesh filter (Millipore, Tullagreen, Cork, Ireland), centrifuged at 1500 × g for 5 min (Sigma 4k 15, Osterode, Germany) and the pellet re-suspended in 30 mL sterile milliQ water containing 10% glycerol. The spore concentration was determined by filtration of 0.1 mL of 10 fold diluted suspension through a 25 mm diameter polycarbonate filter with 0.4 μm pore size (Millipore, Tullagreen Cork, Ireland) and subsequent enumeration of deposited spores by field emission scanning electron microscopy (FESEM). One milliliter (containing ca. 108 spores) of this spore suspension was used to inoculate gypsum board (GB) (Lafarge Gips Dekoform 6 AK, Oberursel, Germany) commonly used as indoor building material in Norwegian residential environments. The GB was cut into 80 mm diameter circular plates that were prepared following the procedure previously described (Afanou et al. 2014). Following 8 weeks of incubation at 25 ± 1°C and 45 ± 5% relative humidity (in the incubator), the GB plates were utilized for aerosolization experiments.
Aerosolization and Collection of Fungal Aerosols
The fungal cultures were aerosolized with the Fungal Spore Source Strength Tester (FSSST) (Sivasubramani et al. 2004), and Stami Particle Generator (SPG) (Afanou et al. 2014). The FSSST was built in polyvinyl chloride with a square internal area of 144 cm2, and 112 orifices of 0.4 mm diameter that directed air jets perpendicularly toward the culture plates. The SPG was built in aluminum and included a rotating plate of 156 cm2 as support for the culture plates. A 6 mm diameter tube outfitted with ten orifices of 1.2 mm diameter served to direct air jets perpendicularly toward the culture plate. Schematic illustration for both generators and the experimental setup are shown in Figure 1.
Fig. 1.
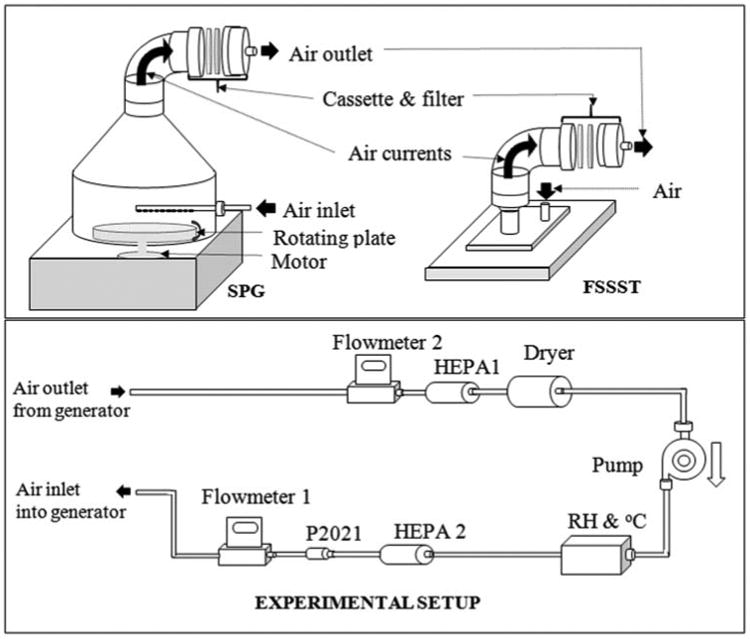
Schematic illustration of the aerosolization chambers: Stami particle generator (SPG), fungal spore source strength tester (FSSST) and the experimental set up. One aerosolization chamber is connected to the system set up. Flow at the inlet and outlet of the chamber is measured by flowmeter 1 and 2, respectively. HEPA filter 1 and 2 filter the air to and from the pump, respectively. Constant relative humidity is maintained by the dryer (in line tube with silica beads). P2021 ionizer reduces elctrostatic charges. Reproduced with permission from American Society of Microbiology: Afanou et al. 2014; Applied and Environmental Microbiology, 80(22): 7122–7130.
The aerosolization experiments were performed at airflow rates of 12 and 20 L min−1. At these airflows, the air velocities at the orifices were 18 and 29 m s−1 in the SPG, and 14 and 23 m s−1 in the FSSST, respectively. During aerosolization the GB plates were situated at 14 mm below the orifices. Fungal aerosols were liberated by air currents provided through the orifices. Each aerosolization experiment was run for 120 sec while rotating the plate supporting A. versicolor and P. chrysogenum culture at 0.5 rpm in the SPG. In FSSST, the culture dishes were aerosolized without rotation. In the experiment with A. fumigatus, a modified approach was used to prevent bioaerosol overload on the sampling filter. Briefly, the A. fumigatus culture surface area was covered with a plate that contained a 1 cm diameter central hole. A. fumigatus particles were liberated using the same airflow rate as described above. However, the sampling interval was 60 s while rotating at 1 rpm in SPG. Released particles from the culture were transported by the air currents within each system onto a 0.4 μm pore sized polycarbonate filter membrane (Isopore, Millipore, Ireland) and contained in open 37 mm cassettes (SKC Inc., Eighty Four, PA, USA). All experiments were conducted in a Bio Safe Grade II laminar flow hood to prevent external particle contamination and to protect laboratory workers from fungal exposure. The generator chamber was cleaned with 70% ethanol and purged for 10 min with HEPA filtered air prior to each experiment. Each experimental treatment was run in triplicate. Sixteen blank experiments were performed using cleaned empty chamber for background adjustment. Blanks with GB plates were disregarded because the substrate material after fungal bio-deterioration is different from the substrate at start (Sáchez 2009). Four blank experiments for each generator × flow rate combination were run for 120 s.
Sample Preparation and Analysis
Briefly, a segment (ca. 2.4 cm2) was cut from the collection filter, mounted on a 25 mm aluminum pin stub (Agar Scientific Ltd., Stansted Essex, UK) using double-sided carbon adhesive discs (Ted Pella Inc., Redding, CA, USA), and coated with platinum in a Balzers SDC 050 sputter coater (Balzers, Liechtenstein) as previously described by Afanou and colleges (Afanou et al. 2014). Samples were analyzed using FESEM (SU 6600 Hitachi, Ibaraki-ken, Japan) in the secondary electron imaging (SEI) mode. The microscope was operated at 15 keV acceleration voltage, 1.8 kV extraction voltage and a working distance of 10 mm. Particles were quantified using the counting criteria described by Eduard and Aalen (Eduard and Aalen 1988). The particles were considered to be homogenously distributed on the filter because an electrically conducting filter holder had been used to reduce electrostatic charging of the filter holder (Eduard et al. 1990).
Identification and Classification of the Fungal Particles
Spore particles were identified and classified by their morphological features while other indiscernible particles were defined as fragment particles and classified by length (Figure 2). Spore particles were categorized into five classes according to spore units per aggregate: single spores, and aggregates of 2, 3, 4, and ≥5 spores. Fragment particles were grouped in four classes based on their length: 0.2–1 μm fragments, 1–2 μm fragments, 2–3.5 μm fragments, and >3.5 μm fragments. Four hundred particles or a maximum of 100 fields were counted at 3000–6000 × magnification depending on the particle density on the filter and type of particle. The lowest detectable number of particles was 8 × 10³ and 2 × 10⁴ particles/filter at 3000 × and 6000 × magnification, respectively. The background numbers of each particle type by cm2 surface of the supporting culture plate were in the range: 0–200 for single spores, 0 for aggregates of 2 spores, 0–45 for aggregates of 3 spores, 0 for aggregates of 4 spores, 0–40 for aggregates of 5 spores or more, 160–4000 for submicronic fragments, 55–800 for 1–2 μm fragments, 0 for 2–3.5 μm fragments and 0–160 for ≥3.5 μm fragments.
Fig. 2.
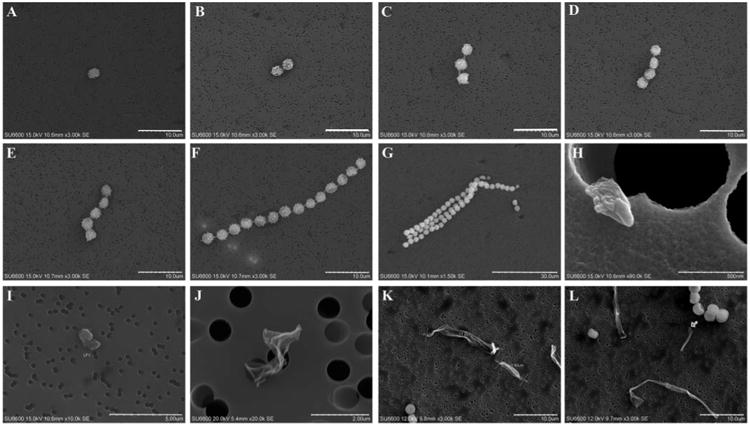
Micrographs of various fungal aerosolized particles. Spore particles (a–f); (a) single spores, (b–g) aggregate of 2, 3, 4, 5, and >5 spores from A. versicolor. Fragment particles (h–l); (h) submicronic fragments: <1 μm; (h–l) large fragments; (i) 1—2 μm fragments; (j) 2–3.5 μm fragments, (k and l) >3.5 μm fragments. Scale bar: 10 μm (a, f, k, and l); 30 μm (g); 0.5 μm (h); 5 μm (i); 2 μm (j).
Size and Shape Measurements
The largest width and length were additionally measured on 12 randomly selected spore particles (single spores and aggregates of 2–6 spores). Similar measurements were performed on each type of fragment particles (submicronic and larger fragments) counted in 200 randomly selected fields at 3000× magnification. Measurements were performed at 3000–40,000× magnification depending on particle type and size. Shape of each particle was described by their aspect ratio calculated as length to width ratio.
Statistical Analysis
Data from 12 experiments of each fungal species were available for statistical analysis. All counts were adjusted for blank prior to the estimation of the number of particles per cm2 culture. Negative or zero counts after background adjustment, were arbitrarily assigned 0.1 in order to enable ratio calculations and log ratio transformations for statistical analysis. Primary results were reported as median numbers, 25th and 75th percentiles of particles of each type per exposed culture area. The median numbers of particle types were compared between the fungal species using the nonparametric Kruskal–Wallis (K–W) test for multiple categories followed by post hoc Wilcoxon-rank sum test (Mann–Whitney U tests) and Bonferroni adjusted p-values (significant p-values <0.017).
Proportions of each particle type were calculated as the ratio of particle type counted to the total number of particles and were also reported as medians and percentiles (25th and 75th). The effects of the generators and airflows on the particle composition of the fungal aerosols were statistically assessed by applying linear mixed model on centered log ratio (CLR) transformed particle ratios (Aitchison 2003; Pawlowsky-Glahn and Egozcue 2006). CLR transformation was performed with CoDaPack version 2.01.15 (Department of Computer Science and Applied Mathematics, University of Girona, Girona Spain) by dividing each count ratio by the geometric mean of count ratios for each treatment. This transformation has been described to remove the constant sum constraint on compositional data (Aitchison 2003; Pawlowsky-Glahn and Egozcue 2006) prior to analysis.
Schematically the models were:
Generator: CLR = constant + Type + Type × Generator + experiments (random) + residuals
Airflow rates: CLR = constant + Type + Type × Flow + experiments (random) + residuals (CLR: centered log ratio; Type represent the nine types of particles; Generator represents the two generators used; Flow represents the two airflow rates used).
To detect significant changes in the fungal aerosol composition between generators or airflows, we tested the significance of the two interaction terms (Type × Generator) and (Type × Flow). This was done by likelihood ratio tests between models with and without the interaction terms. Here, the models without the interaction terms included the two variables of the interaction term as single fixed effects (Jaeger 2008; Fitzmaurice et al. 2011). Furthermore, particle fractions that significantly changed between generators or airflows were pinpointed by the sign and significance of the individual coefficients of these two interaction terms. Significant p-values (p < 0.05) were adjusted for multiple comparisons using the false discovery rate method (Benjamini and Hochberg 1995; Benjamini 2010). Statistical analysis was performed in Stata SE 13 (Statacorp LP, College Station, TX, USA).
Results
Size and Shape Characteristics of Spores and Fragment Particles
All counted particles were classified according to their physical length measured by FESEM. The average sizes for spore particles were in the range 2.41–15.04 μm and 2.02–4.26 μm for lengths and widths, respectively (Table 1). The corresponding sizes for fragment particles were 0.52–12.80 μm and 0.33–5.10 μm (Table 2).
Table 1. Size and aspect ratio of spore particles.
| A. fumigatus | A. versicolor | P. chrysogenum | ||||||||||||||||
|---|---|---|---|---|---|---|---|---|---|---|---|---|---|---|---|---|---|---|
|
|
|
|
||||||||||||||||
| S1 | S2 | S3 | S4 | S5 | S6 | S1 | S2 | S3 | S4 | S5 | S6 | S1 | S2 | S3 | S4 | S5 | S6 | |
| N | 12 | 12 | 12 | 12 | 12 | 12 | 12 | 12 | 12 | 12 | 12 | 12 | 12 | 12 | 12 | 12 | 12 | 12 |
| AM | ||||||||||||||||||
| Length | 2.68 | 4.77 | 6.42 | 6.83 | 8.55 | 12.26 | 2.97 | 5.87 | 8.00 | 10.61 | 12.51 | 15.04 | 2.41 | 4.32 | 6.77 | 8.88 | 11.45 | 12.28 |
| Width | 2.25 | 2.61 | 3.20 | 3.64 | 3.65 | 4.26 | 2.53 | 2.66 | 3.20 | 3.65 | 3.75 | 4.25 | 2.02 | 2.07 | 2.22 | 2.78 | 2.88 | 3.34 |
| Aspect ratio | 1.20 | 1.83 | 2.05 | 1.97 | 2.45 | 3.14 | 1.18 | 2.22 | 2.57 | 3.10 | 3.70 | 3.88 | 1.21 | 2.16 | 3.11 | 3.45 | 4.19 | 4.16 |
| SD | ||||||||||||||||||
| Length | 0.27 | 0.61 | 1.61 | 1.15 | 1.03 | 2.48 | 0.26 | 0.78 | 1.15 | 1.82 | 2.30 | 3.17 | 0.28 | 0.48 | 1.10 | 2.03 | 1.93 | 2.11 |
| Width | 0.30 | 0.19 | 0.46 | 0.85 | 0.94 | 1.08 | 0.19 | 0.21 | 0.50 | 0.97 | 1.09 | 1.10 | 0.35 | 0.38 | 0.31 | 0.62 | 0.74 | 1.13 |
| Aspect ratio | 0.15 | 0.23 | 0.59 | 0.56 | 0.58 | 1.26 | 0.20 | 0.34 | 0.56 | 0.94 | 1.44 | 1.63 | 0.20 | 0.46 | 0.63 | 1.33 | 1.04 | 1.63 |
AM: Arithmetic mean; SD: standard deviation; length and width in μm.
S1: Single spores; aggregates of 2 (S2), 3 (S3), 4 (S4), 5 (S5) and 6 (S6) spores
Table 2. Size and aspect ratio of fragment particles.
| A. fumigatus | A. versicolor | P. chrysogenum | ||||||||||
|---|---|---|---|---|---|---|---|---|---|---|---|---|
|
|
|
|
||||||||||
| <1 μm | 1–2 μm | 2–3.5 μm | >3.5 μm | <1 μm | 1–2 μm | 2-3.5 μm | >3.5 μm | <1 μm | 1–2 μm | 2–3.5 μm | >3.5 μm | |
| N | 113 | 41 | 27 | 19 | 102 | 44 | 25 | 29 | 67 | 36 | 30 | 68 |
| AM | ||||||||||||
| Length | 0.53 | 1.38 | 2.59 | 11.20 | 0.52 | 1.40 | 2.49 | 12.80 | 0.63 | 1.44 | 2.59 | 10.6 |
| Width | 0.33 | 0.77 | 1.41 | 4.69 | 0.34 | 0.76 | 1.46 | 5.10 | 0.37 | 0.75 | 1.42 | 3.34 |
| Aspect ratio | 1.78 | 2.12 | 2.26 | 3.34 | 1.78 | 2.19 | 1.89 | 3.01 | 2.00 | 2.17 | 2.08 | 4.68 |
| SD | ||||||||||||
| Length | 0.20 | 0.27 | 0.44 | 10.50 | 0.21 | 0.28 | 0.35 | 11.77 | 0.20 | 0.30 | 0.43 | 9.50 |
| Width | 0.14 | 0.34 | 0.91 | 5.10 | 0.22 | 0.35 | 0.40 | 4.53 | 0.16 | 0.28 | 0.64 | 2.50 |
| Aspect ratio | 0.77 | 1.00 | 0.87 | 4.15 | 0.86 | 1.04 | 0.83 | 3.25 | 1.47 | 0.94 | 0.72 | 5.82 |
AM: Arithmetic mean; SD: standard deviation; length and width in μm
<1 μm: submicronic fragments (SF); 1 - 2 μm fragments (LF1); 2–3.5 μm fragments (LF2) > 3.5 μm fragments (LF3)
Three shape groups were recognized from the aspect ratios (Table 3). Spherical or near-spherical particles with aspect ratio in the range 1:1–1.5:1 group specifically the single spores irrespective to species. The median proportions of this group were 53%, 7%, and 6% of total aerosolized particles from A. fumigatus, A. versicolor, and P. chrysogenum, respectively. A second group of oblong shaped particles has aspect ratios in the range 1.5:1–3:1 and represents 45%, 68%, and 55% (median) of the aerosolized particles from A. fumigatus, A. versicolor and P. chrysogenum, respectively. Further, this group comprises 0.2–1 μm fragments, 1–3.5 μm fragments, and spore aggregates except the largest aggregates. The third group has elongate and fiber-like shape with aspect ratio >3:1. Larger fragments (>3.5 μm) and larger spore aggregates belong to this group which represents 1%, 21%, and 24% (median) of total particles aerosolized from A. fumigatus, A. versicolor and P. chrysogenum, respectively. The overall average lengths (widths) were in the ranges 2.41–2.97 μm (2.02–2.53 μm) for near spherical particles, 0.52–8.55 μm (0.33–3.65 μm) for oblong particles and 3.5–15.04 μm (2.22–5.10 μm) for the elongate and fiber-like particles. The micrographs of various particle types observed are shown in Figure 2.
Table 3. Shape characteristics of fungal bioaerosols based on aspect ratio. AM arithmetic means.
| Range of aspect ratio (AM) | A. fumigatus | A. versicolor | P. chrysogenum | ||||||
|---|---|---|---|---|---|---|---|---|---|
|
|
|
|
|
|
|
||||
| Spore particles | Fragment particles | Median (%) | Spore particles | Fragment particles | Median (%) | Spore particles | Fragment particles | Median (%) | |
| 1:1–1.5:1 (near spherical) | Single spores | — | 53 | Single spores | — | 7 | Single spores | — | 6 |
| 1.5:1–3:1 (oblong) | Aggregates of 2, 3, 4, and 5 spores | <1 μm, 1–2 μm and 2–3.5 μm | 45 | Aggregates of 2 and 3 spores | <1 μm, 1–2 μm and 2–3.5 μm | 68 | Aggregates of 2 spores | <1 μm, 1–2 μm and 2–3.5 μm | 55 |
| >3:1 (fiber-like) | Aggregates of 6 spores | >3.5 μm | 1 | Aggregates of 4, 5, and 6 spores | >3.5 μm | 21 | Aggregates of 3, 4, 5, and 6 spores | >3.5 μm | 24 |
Number of Spores and Fragment Particles
The total median numbers of aerosolized particles were 4.8 × 10⁵ per cm−2 culture of A. fumigatus, 5.6 × 10³ for A. versicolor and 8.9 × 10³ for P. chrysogenum. Median sum spore particle numbers were 2.9 × 10⁵, 0.8 × 10³, and 0.9 × 10³ per cm−2 culture, while the corresponding numbers for fragment particles were 1.9 × 10⁴, 4.2 × 10³, and 8.6 × 10³ for per cm−2 culture for A. fumigatus, A. versicolor and P. chrysogenum, respectively. The median number of spore particles released from A. fumigatus cultures differed significantly from A. versicolor and P. chrysogenum cultures (Table 4). A. fumigatus cultures released over 300 times the median number from A. versicolor (p < 0.001) and P. chrysogenum (p < 0.001). The number of fragment particles did not differ significantly between the tested species (p = 0.2).
Table 4. Particle types aerosolized from A. fumigatus, A. versicolor, and P. chrysogenum (all experiments combined).
| Particle types | A. fumigatus (N = 12) | A. versicolor (N = 12) | P. chrysogenum (N = 12) | K–W test p-value | |||
|---|---|---|---|---|---|---|---|
|
|
|
|
|||||
| Number of particlesab | % of totalb | Number of particlesab | % of totalb | Number of particlesab | % of totalb | ||
| Spores | |||||||
| S1 | 170 (7.0–1400) | 53 (26–62) | 0.3 (0.02–1.4) | 7 (0.4–14) | 0.4 (0.06–2.4) | 6 (1–10) | 0.001 |
| S2 | 47 (2.0–240) | 12 (8–17) | 0.2 (0.02–1.8) | 7 (0.3–15) | 0.06 (0.06–0.40) | 1 (0.6–5) | <0.001 |
| S3 | 20 (0.4–107) | 4 (2–5) | 0.09 (0.02–0.7) | 1 (0.3–6) | 0.06 (0.06–0.3) | 2 (0.7–4) | 0.001 |
| S4 | 11 (0.06–118) | 3 (2–4) | 0.02 (0.02–0.4) | 1 (0.3–4) | 0.06 (0.06–0.1) | 1 (0.6–3) | 0.005 |
| ≥S5 | 26 (0.6–140) | 5 (2–15) | 0.3 (0.09–2.1) | 9 (1–19) | 0.06 (0.06–0.6) | 3 (0.7–8) | 0.01 |
| Sum | 290 (9.0–1950) | 88 (75–94) | 0.9 (0.3–7.0) | 39 (5–58) | 1.0 (0.3–3.4) | 16 (8–42) | <0.001 |
| Fragments | |||||||
| SF | 13.0 (1.0–300) | 5 (1–21) | 2.0 (0.6–5.0) | 34 (7–62) | 8.0 (0.6–10) | 31 (10–89) | 0.2 |
| LF1 | 2.0 (0.06–4.1) | 1 (0.2–1) | 0.06 (0.06–0.5) | 2 (1–8) | 0.06 (0.06–0.6) | 2 (1–8) | 0.2 |
| LF2 | 2.7 (0.06–4.1) | 1 (0.2–4) | 0.06 (0.06–0.6) | 4 (0.5–22) | 0.06 (0.06–0.7) | 2 (0.7–6) | 0.07 |
| LF3 | 2.0 (0.06–4.1) | 1 (0.1–3) | 0.06 (0.06–0.2) | 3 (1–8) | 0.06 (0.06–3.0) | 4 (1–38) | 0.2 |
| Sum | 19.0 (1.8–350) | 12 (6–25) | 4.0 (1.0–6.0) | 61 (42–95) | 9.0 (2.0–15.0) | 84 (58–92) | 0.2 |
| TOTAL | 480 (17–2659) | 5.6 (2.4–14) | 8.9 (3–16.5) | ||||
Data represent 103 particles cm−2 of culture media.
Medians, 25th and 75th percentiles (in parentheses); K–W D Kruskal–Wallis test for the three fungal species. The post-hoc Wilcoxon rank sum test of differences between species for median numbers with A. fumigatus significantly higher than A. versicolor and P. chrysogenum. Significance level (p ≤ 0.017). S1: Single spores; Aggregates of 2 (S2), 3 (S3), 4 (S4) and ≥5 (S5) spores. SF: Submicronic fragments, LF1: 1–2 μm fragments, LF2: 2–3.5 μm fragments, and LF3: ≥ 3.5 μm fragments.
Fungal Aerosol Composition
The bioaerosols collected from A. fumigatus was predominantly composed of single spores (median 53% of total particles) while submicronic fragment fractions were the highest in the aerosols from A. versicolor (submicronic fragments, median 34%) and P. chrysogenum (submicronic fragments, median 31%). Within the spore particle fraction from A. fumigatus and P. chrysogenum, single spores were most common: medians 70% and 28%, respectively, whereas the aerosols from A. versicolor were mainly composed of larger spore aggregates (aggregates of ≥5 spores, median 32%) (Table 4). Moreover, the submicronic fragments were dominant in the fragment particle fraction from all three isolates: medians 62%, 70%, and 63% of total fragments from A. fumigatus, A. versicolor, and P. chrysogenum, respectively.
The combined proportions of larger fragments (medians of 1–2 μm fragments, 2–3.5 μm, and ≥3.5 μm) amounted to median 3%, 9%, and 8% of all particles collected from A. fumigatus, A. versicolor, and P. chrysogenum, respectively (Table 4). The median proportions of single spores were 53%, 7%, and 6% while the medians of all spore aggregates combined were 26%, 23%, and 10% of all particles from A. fumigatus, A. versicolor, and P. chrysogenum cultures, respectively (Table 4).
Effect of Generator Types on the Fungal Aerosol Composition
Significant changes in the aerosol composition related to the type of generator were demonstrated trough CLR regression models and likelihood ratio tests of the interaction terms ‘Generator × Type’ (Table S1). The test was significant for A. fumigatus cultures aerosolized at 12 L min−1 (p = 0.005), for the A. versicolor and P. chrysogenum cultures both aerosolized at 12 and 20 L min−1 (p = <0.001–0.007). The fraction of submicronic fragments was mainly affected when changes in the profile were observed between SPG and FSSST at 12 and 20 L min−1. Further, the fraction of submicronic fragments was significantly higher in SPG (p = 0.001) as compared to FSSST with A. fumigatus cultures aerosolized at 12 L min−1 (Figure 3a) while this fraction was lower in SPG as compared to FSSST at airflow 12 L min−1 for A. versicolor (p < 0.001) (Figure 3c) and P. chrysogenum (p = 0.007) (Figure 3e). In addition, the single spore fraction was significantly larger in SPG versus FSSST with P. chrysogenum cultures (p < 0.001). At 20 L min−1, no significant difference was observed between SPG and FSSST in the bioaerosol composition from A. fumigatus cultures (Figure 3b). But with A. versicolor cultures, the 2–3.5 μm fragments fraction was significantly lower in SPG compared to FSSST (p = 0.001) (Figure 3d). Furthermore, the submicronic fragment fraction from P. chrysogenum cultures was significantly larger in SPG versus FSSST (p = 0.002) (Figure 3f).
Fig. 3.
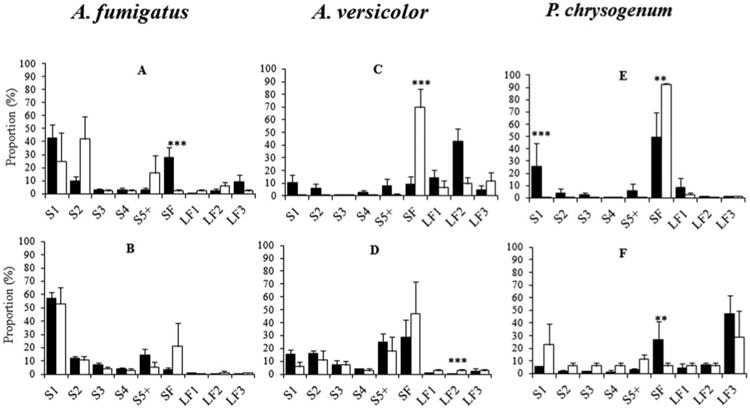
Distribution of mean proportions of particle types aerosolized from A. fumigatus, A. versicolor, and P. chrysogenum cultures; SPG (black columns) and FSSST (white columns) at 12 L min−1 (a, c, and e) and at 20 L min−1 (b, d, and f). S1: Single spores; aggregates of 2 (S2), 3 (S3), 4 (S4), ≥5 (S5) spores. SF: Submicronic fragments, LF1: 1–2 μm fragments, LF2: 2–3.5 μm fragments, and LF3: >3.5 μm fragments. * p ≤ 0.05, ** p ≤ 0.01, *** p ≤ 0.001 (t-test of interaction coefficients between generator and particle types in the centered log-ratio mixed effect regression model of the proportions of particles; all p-values were adjusted for multiple comparisons by the false discovery rate method). Error bars represent standard errors.
Effect of Airflow Rates on the Fungal Aerosol Composition
Fungal cultures subjected to airflow rates of 12 L min−1 and 20 L min−1 showed significantly different aerosol profiles. The likelihood ratio test of the interaction term ‘Flow × Type’ was significant with both SPG and FSSST for all tested fungal isolates (p = <0.001–0.003) (Table S2). For A. versicolor, the fraction of spore particles was the largest at 20 L min−1 in both generators (p = 0.004–0.02) whereas the proportion of >1 μm fragment particles was highest at 12 L min−1 (p = <0.001–0.03) in FSSST (Figures 4c and d). Similar results were observed for A. fumigatus, but only in the SPG; the fraction of aggregates of ≥5spores increased with increasing airflow (p = 0.012), while ≥3.5 μm fragments fraction (p <0.001) and the submicronic fragments fraction decrease with increasing airflow (p = <0.001– 0.002) (Figure 4a). In the FSSST, the difference between the single spore fractions at 12 and 20 L min−1 was closed to significance (p = 0.006) with the largest fraction obtained at 20 L min−1 (Figure 4b). Fractions of single spore and aggregates of ≥5spores of P. chrysogenum were higher at 20 L min−1 than at 12 L min−1 (p = 0.008) in the FSSST but not in SPG (Figures 4e and f). The ≥3.5 μm fragments fraction increased with increasing airflow in both generators (p = <0.001–0.013) (Figures 4e and f) as opposed to the findings for the Aspergillus isolates. The submicronic fragment fraction decreased with increasing airflow rate in FSSST (p <0.001), but not significantly in SPG (p = 0.07).
Fig. 4.
Distribution of mean proportions of particle types aerosolized from A. fumigatus, A. versicolor, and P. chrysogenum cultures. Airflow 12 L min−1 (black columns) and 20 L min−1 (white columns) with SPG (a, c, and e) and FSSST (b, d, and f). S1: Single spores; aggregates of 2 (S2), 3 (S3), 4 (S4), ≥5 (S5) spores. SF: Submicronic fragments, LF1: 1–2 μm fragments, LF2: 2–3.5 μm fragments and LF3: ≥3.5 μm fragments. * p ≤ 0.05, ** p ≤ 0.01, *** p ≤ 0.001 (t-test of interaction coefficients between airflow and particle types in the centered log-ratio mixed effect regression model of the proportions of particles; all p-values were adjusted for multiple comparisons by the false discovery rate method). Error bars represent standard errors.
Discussion
With FESEM, the aerosols generated from fungal cultures revealed diverse arrays of particles with different size, shape, and origin. The composition varied substantially between species and aerosolization conditions. The aspect ratio revealed three major particle shapes: near spherical, oblong and fiberlike. All single spores were fitted in the group of near spherical particles which is in close agreement with morphology described for spores from these species (Samson et al. 2004).
The aerodynamic diameter of these particles could therefore be a good predictor of their behavior in the respiratory tract as suggested by Reponen (1995) assuming that surface ornamentation has negligible effects. Further, most submicronic fragments were oblong while most of spores aggregates and larger fragments were elongate and fiber-like in shape. It is therefore likely that motion and deposition models of these particles in the respiratory tract will have to consider their shape characteristics in addition to aerodynamic equivalent diameter as reviewed by Lacey (1991).
Based on the physical sizes of various particles (microscopic length and width), 3–9% (median) of total particle counts were large fragments in the same size range as single spores and spore aggregates. Obviously, the heterogeneity of size and shape of fragment particles will confound the recognition of spore particles by large fragments when automatic counters or sizers are used. For example, Gorny et al. (2002; Górny and Ławniczek-Wałczyk 2012) used optical diameter of 1.6 μm (a size delimitation) to discriminate between small fragments and spores from Aspergillus versicolor, Penicillium melinii, P. chrysogenum, and Cladosporium cladosporioides culture (Górny et al. 2002; Górny and Ławniczek-Wałczyk 2012). Similarly, Madsen described the composition of aerosols from Botrytis cinerea by allocating specific aerodynamic diameter ranges to specific particles types such as fragments (<1.6 μm), microconidia (1.8–3.3 μm), and macroconidia (3.5–10.4 μm) (Madsen 2012). In these studies, the spore or conidia fractions are likely to comprise both spore aggregates and large fragments.
Using aerosol size fractionation samplers, spores, and fragment fractions have been reported likewise as studies that used automatic particle counters. Further quantification of fungal biomarker in the specific fractions allows the application of this approach in field settings for quantification of fungal submicronic fraction. For example, the mass of β-glucans was estimated in different size fractions of air samples collected by cyclones from indoor environments with molds contamination. The fungal aerosol profile was thus described as submicronic fragments fraction (< 1 μm), a mixture fraction of spores and fragments (1.05–2.25 μm) and a spore fraction (>2.25 μm) (Reponen et al. 2007; Seo et al. 2009, 2014). Moreover, multi-stage impactors (Górny et al. 2002; Cho et al. 2005) as well as filters with different pore size in series (Brasel et al. 2005) have been used to disclose the fungal aerosol composition. However, the problem of spore bounce associated with impactor and cyclone sampling (Lindsley et al. 2006; Madsen et al. 2009) as well as the cut-off characteristics of impactors and cyclones suggest possible contamination of the submicronic fragment fraction by larger particles.
In any case whether fungal aerosols are studied with automatic counter or size fractionation coupled to biomarkers, characterization of the aerosol composition revealed only a one-dimensional size description of spores and fragment particles. In contrary, two-dimensional size measurements revealing shapes and sizes characteristics of various constituents present in the fungal aerosol was achieved in the present study using field emission scanning electron microscopy. Such visualization of particles favors their classification whether as spore or fragments. The present microscopic approach provides therefore more detailed characteristics of the fungal aerosols as compared to other approaches.
The total numbers of spore particles aerosolized from A. fumigatus were significantly higher as compared to A. versicolor and P. chrysogenum (p < 0.001), but no species difference was observed for fragment numbers (p = 0.2). We found no significant differences between A. versicolor and P. chrysogenum either for spore or fragment particles. This is in contradiction to results reported by Górny and Ławniczek-Wałczyk 2012 who also conducted aerosolization experiments on these species and observed significantly higher numbers of spores and fragments from A. versicolor as compared to P. chrysogenum. We can only speculate about what causes the deviating results: differences in experimental parameters such as generator, airflow, culture age, and the variation between isolates from the same fungal species. Nevertheless, the dominance of the submicronic particle fraction in the aerosols from A. versicolor or P. chrysogenum is in agreement with previously reported studies based on automatic particle counters or sizers (Górny et al. 2002; Cho et al. 2005; Madsen et al. 2005; Seo et al. 2009; Górny and Ławniczek-Wałczyk 2012). Further, the level of spore propagules (single spores and spore aggregates) aerosolized from A. versicolor grown on gypsum board has been previously assessed using microscopic counts (Sivasubramani et al. 2004). They reported higher levels: about 7×10³ per cm−2 as compared to 0.9×10³ per cm−2 of total spore particles in our study. This may be due to longer aerosolization period (10 min versus 2 min) and longer incubation time (12 months versus 8 weeks) applied in that study.
The presence of large spore aggregates in the aerosols is of concern because they carry much more antigenic substances into the respiratory tract despite their smaller number in the generated aerosols. The long chained aggregates have fiberlike shape with aerodynamic properties that may increase their chance to reach the trachea-bronchial region. It has been recently demonstrated that neutrophils sense the microbe size and selectively release neutrophils extracellular traps (NETs) in response to large particles including fungal hyphal fragments and spore aggregates, but not in response to single spores (Branzk et al. 2014). It is therefore likely that different response mechanisms with substantially different cellular pathology will be induced upon inhalation and deposition of fungal particles in the respiratory tract. Large spore aggregates are likely to induce NETosis, whereas single spores are phagocytized. This size-dependent response should be emphasized in future exposure-response studies, and it will be important to include particle size determination in the characterization of fungal aerosols. The present study provides important information of fungal aerosols in this respect. The composition of aerosols generated from A. fumigatus including submicronic fragments has, to our knowledge, not been previously reported. Single spore outnumbered other particles suggesting that there is higher probability to detect spores from this species if growing in indoor environments as compared to A. versicolor and P. chrysogenum with aerosols dominated by fragments.
The present study revealed also significant changes in the bioaerosol composition related to the generators and airflows used for all tested isolates. For example, with A. fumigatus cultures the bioaerosol profile changed significantly to relatively fewer single spores and more submicronic fragments in SPG compared to FSSST when the airflow was 12 L min−1. Similarly the proportions of submicronic fragments and ≥3.5 μm fragments increased at 12 L min−1 compared to 20 L min−1 when SPG was used. Gorny and co-authors (Górny and Ławniczek-Wałczyk 2012) reported that generation factors such as air jet velocity, direction and movements have significant effects on the number of small fragments (< 1.6 μm) and spores released from fungal cultures of A. versicolor and P. chrysogenum. Different physical parameters such as the level of turbulence inside the generator, impaction of particles onto the substrate and mycelia, and electrostatic charges on the particles and generator surfaces may collectively influence the release, the transportation, and loss of particles during in vitro aerosolization. These factors may even differ between particle types. The particle types (spores, spore aggregates, or fragments) that are mostly affected are likely of great importance for how the final composition of the bioaerosol may look.
The fraction of submicronic fragments was mostly influenced by the generator and airflow used. The most striking change was observed with P. chrysogenum aerosolized in the FSSST where the submicronic fragment fraction was 93% at a flow rate of 12 L min−1 which was reduced to 6% at a flow rate of 20 L min−1. Only the results for A. versicolor seemed fairly consistent, showing increased spore fractions and lower fragment fractions at higher flow rate in both generators. The other fungal isolates showed more diverse results. Thus, the composition of fungal aerosols in these in vitro experiments was greatly influenced by generation conditions. As changes in the fungal profiles often were in opposite directions, extrapolation of our results to environmental conditions appears difficult. Direct measurements in the environment are therefore required in order to assess exposure to fungal particle types different from spores.
Although detailed characteristics of fungal particles were obtained with FESEM, this microscopic method has been criticized for introducing two biases. First, the imaging that is performed in a vacuum chamber may cause distortion, collapse or disintegration of spore aggregates (Vestlund et al. 2014). Nevertheless, the morphological characteristics and the size measurements found are quite consistent with the literature (Frisvad and Samson 2004). In SEM, naturally collapsed spores have similar size (length and width) as compared to whole spores (Beckett et al. 1984). Furthermore, spores will desiccate when the relative humidity is below 100%, and desiccated spores are likely to occur naturally in the environment (Beckett et al. 1984). Secondly, the analyzed filter area is a small fraction (0.1–1%) of the exposed filter area. Although the distribution of particles in filter samples collected in electrically conducting cassettes is fairly homogenous (Eduard and Aalen 1988) the enumeration at higher resolution (3000–6000×) may lead to very low numbers or zero counted particles leading to highly Poisson distributed particle counts. However, the high resolution microscopic method is the only approach that permits classification and size and shape characterization of a broader range of fungal particles that include submicronic fragments, large fragments and spore particles.
Conclusions
The high-resolution microscopic characterization of fungal aerosols from A. fumigatus, A. versicolor, and P. chrysogenum revealed a complex profiles with different shape, origin, and size. Fungal spores were aerosolized as single spores, chained, or clustered spore aggregates with shape and size that favor their deposition in different regions in the respiratory systems. Released fragments were mainly submicronic fragments but also included larger fragments with sizes that partly overlap those of spore particles. The FESEM method used in the present study was satisfactory for assessing shape and size as well as the source of fungal particles aerosolized from pure cultures grown on gypsum board.
The composition of the experimentally generated fungal aerosols was significantly influenced by the generator or the airflow rate used. Changes in the profiles were too diverse to enable extrapolation to real conditions. The complexity and variability of the bioaerosol composition and the dominance of fragments in the fungal aerosol from A. versicolor and P. chrysogenum supports previous recommendations on detecting broader range of particles types during fungal exposure assessment studies.
Supplementary Material
Acknowledgments
The technical support provided by the Norwegian Veterinary Institute is gratefully acknowledged. The findings and the conclusions in this report are those of the authors and do not necessarily represent the views of the National Institute for Occupational Safety and Health.
Funding: The present study is a part of the project “Fungal particles in indoor air” that is financially supported by the Norwegian Research Council: Grant number NFR196130/H10.
Footnotes
Supplemental Material: Supplemental data for this article can be accessed on the publisher's website.
References
- Adhikari A, Jung J, Reponen T, Lewis JS, DeGrasse EC, Grimsley LF, et al. Aerosolization of Fungi, (1→3)-β-D-Glucans, and Endotoxin from Flood-Affected Materials Collected in New Orleans Homes. Environ Res. 2009;109(3):215–24. doi: 10.1016/j.envres.2008.12.010. [DOI] [PMC free article] [PubMed] [Google Scholar]
- Afanou KA, Straumfors A, Skogstad A, Nilsen T, Synnes O, Skaar I, et al. Submicronic Fungal Bioaerosols: High-Resolution Microscopic Characterization and Quantification. Appl Environmen Microbiol. 2014;80(22):7122–7130. doi: 10.1128/AEM.01740-14. [DOI] [PMC free article] [PubMed] [Google Scholar]
- Aitchison J. A concise guide to compositional data analysis. CDA Workshop; Girona: 2003. [Accessed 17 10 2014]. Available at http://www.leg.ufpr.br/lib/exe/fetch.php/pessoais:abtmartins:aconciseguidetocompositionaldataanalysis.pdf. [Google Scholar]
- Beckett A, Read ND, Porter R. Variations in Fungal Spore Dimensions in Relation to Preparatory Techniques for Light Microscopy and Scanning Electron Microscopy. J Microsc. 1984;136(1):87–95. doi: 10.1111/j.1365-2818.1984.tb02548.x. [DOI] [Google Scholar]
- Benjamini Y. Discovering the False Discovery Rate. J R Stat Soc Series B: Statistical Methodol. 2010;72(4):405–416. [Google Scholar]
- Benjamini Y, Hochberg Y. Controlling the False Discovery Rate: A Practical and Powerfull Approach of Multiple Testing. J R Stat Soc. 1995;57(1):289–300. doi: 10.2307/2346101. [DOI] [Google Scholar]
- Bozza S, Gaziano R, Spreca A, Bacci A, Montagnoli C, Francesco P, et al. Dendritic Cells Transport Conidia and Hyphae of Aspergillus fumigatus from the Airways to the Draining Lymph Nodes and Initiate Disparate Th Responses to the Fungus. J Immunol (Baltimore, Md: 1950) 2002;168(3):1362–1371. doi: 10.4049/jimmunol.168.3.1362. [DOI] [PubMed] [Google Scholar]
- Branzk N, Lubojemska A, Hardison SE, Wang Q, Guitierrez MG, Brown GD, Papayannopoulos V. Neutrophils Sense Microbe Size and Selectively Release Neutrophil Extracellular Traps in Response to Large Pathogens. Nat Immunol. 2014;15(11):1017–1025. doi: 10.1038/ni.2987. [DOI] [PMC free article] [PubMed] [Google Scholar]
- Brasel TL, Douglas DR, Wilson SC, Straus DC. Detection of Airborne Stachybotrys Chartarum Macrocyclic Trichothecene Mycotoxins on Particulates Smaller Than Conidia. Appl Environ Microbiol. 2005;71(1):114–122. doi: 10.1128/AEM.71.1.114. [DOI] [PMC free article] [PubMed] [Google Scholar]
- Cho SH, Seo SC, Schmechel D, Grinshpun SA, Reponen T. Aerodynamic Characteristics and Respiratory Deposition of Fungal Fragments. Atmospher Environ. 2005;39(30):5454–5465. doi: 10.1016/j.atmosenv.2005.05.042. [DOI] [Google Scholar]
- Cox CS. Physical Aspect of Bioaerosols Particles. In: Cox CS, Wathes CM, editors. Bioaerosols handbook. CRS Lewis Publishers; Boca Raton, Florida: 1995. pp. 15–25. [Google Scholar]
- Eduard W. Fungal Spores: A Critical Review of the Toxicological and Epidemiological Evidence as a Basis for Occupational Exposure Limit Setting. Crit Rev Toxicol. 2009;39(10):799–864. doi: 10.3109/10408440903307333. [DOI] [PubMed] [Google Scholar]
- Eduard W, Aalen O. The Effect of Aggregation on the Counting Precision of Mould Spores on Filters. Ann Occupat Hyg. 1988;32(4):471–479. doi: 10.1093/annhyg/32.4.471. [DOI] [PubMed] [Google Scholar]
- Eduard W, Laguionie P, Karlsson K, Palmgren U, Str G, Blomquist G. Evaluation of Methods for Enumerating Microorganisms in Filter Samples from Highly Contaminated Occupational Environments. Amer Ind Hyg Assoc J. 1990;51(8):427–36. doi: 10.1080/15298669091369899. [DOI] [PubMed] [Google Scholar]
- Eduard W, Sandven P, Johansen BV, Bruun R. Identification and Quantification of Mould Spores by Scanning Electron Microscopy (SEM): Analysis of Filter Samples Collected in Norweigian Saw Mills. Ann Occupat Hyg. 1988;(32):447–445. [Google Scholar]
- Fitzmaurice G, Laird N, Ware J. Applied Longitudinal Analysis. 2nd. New Jersey; John Wiley & Sons, Inc., Hoboken: 2011. [Google Scholar]
- Frankel M, Hansen E, Madsen AM. Effect of Relative Humidity on the Aerosolization and Total Inflammatory Potential of Fungal Particles from Dust-Inoculated Gypsum Boards. Indoor Air. 2013:1–13. doi: 10.1111/ina.12055. [DOI] [PubMed] [Google Scholar]
- Frisvad JC, Samson RA. Polyphasic Taxonomy of Penicillium Subgenus Penicillium: A Guide to Identification of Food and Air-Borne Terverticillate Penicillia and Their Mycotoxins. Stud Mycol. 2004;49:1–173. [Google Scholar]
- Górny RL, Ławniczek-Wałczyk A. Effect of Two Aerosolization Methods on the Release of Fungal Propagules from a Contaminated Agar Surface. Ann Agricult Environ Med: AAEM. 2012;19(2):279–84. http://www.ncbi.nlm.nih.gov/pubmed/22742802. [PubMed] [Google Scholar]
- Górny RL, Reponen T, Willeke K, Robine E, Boissier M, Sergey A, et al. Fungal Fragments as Indoor Air Biocontaminants. Appl Environ Microbiol. 2002;68(7):3522–3532. doi: 10.1128/AEM.68.7.3522. [DOI] [PMC free article] [PubMed] [Google Scholar]
- Green BJ, Schmechel D, Sercombe JK, Tovey ER. Enumeration and Detection of Aerosolized Aspergillus Fumigatus and Penicillium Chrysogenum Conidia and Hyphae using a Novel Double Immunostaining Technique. J Immunol Methods. 2005;307(1–2):127–34. doi: 10.1016/j.jim.2005.10.001. [DOI] [PubMed] [Google Scholar]
- Halstensen AS, Nordby K, Wouters I, Eduard W. Determinants of Microbial Exposure in Grain Farming. Ann Occupat Hyg. 2007;51(7):581–92. doi: 10.1093/annhyg/mem038. [DOI] [PubMed] [Google Scholar]
- Heikkila P, Salmi T, Kotimaa M. Identification and counting of fungal spores by scanning electron microscopy. Scand J Work, Environ Health. 1988;14(Supplement 1):66–67. [PubMed] [Google Scholar]
- Hohl TM, Van Epps HL, Rivera A, Morgan LA, Chen PL, Feldmesser M, Pamer EG. Aspergillus Fumigatus Triggers Inflammatory Responses by Stage-Specific Beta-Glucan Display. PLoS Pathogens. 2005;1(3):0232–0240. doi: 10.1371/journal.ppat.0010030. [DOI] [PMC free article] [PubMed] [Google Scholar]
- Institute of Medicine. Damp Indoor Spaces and Health. Washington, DC: National Academies Press; 2004. Human Health Effects; pp. 189–243. [Google Scholar]
- Jaeger TF. Categorical Data Analysis: Away from ANOVAs (transformation or not) and Towards Logit Mixed Models. J Memory Language. 2008;59(4):434–446. doi: 10.1016/j.jml.2007.11.007. [DOI] [PMC free article] [PubMed] [Google Scholar]
- Kanaani H, Hargreaves M, Ristovski Z, Morawska L. Fungal Spore Fragmentation as a Function of Airflow Rates and Fungal Generation Methods. Atmos Environ. 2009;43(24):3725–3735. doi: 10.1016/j.atmosenv.2009.04.043. [DOI] [Google Scholar]
- Karlsson K, Malmberg P. Characterization of Exposure to Molds and Actinomycetes in Agricultural Dusts by Scanning Electron Microscopy, Fluorescence Microscopy and the Culture Method. Scand J Work, Environ Health. 1989;15(5):353–359. doi: 10.5271/sjweh.1847. [DOI] [PubMed] [Google Scholar]
- Kildesø J, Wurtz H, Nielsen KF, Wilkins C, Gravesen S, Thrane U, et al. The Release of Fungal Spores from Water Damaged Building Materials. In: Seppanen O, Sateri J, editors. Proceedings of Exposure, Human Responses and Building Investigations. Vol. 1. Helsinki, Finland: 2000. pp. 313–318. [Google Scholar]
- Kildesø J, Wütz H, Nielsen KF, Kruse P, Wilkins K, Thrane U, et al. Determination of Fungal Spore Release from Wet Building Materials. Indoor Air. 2003;13:148–155. doi: 10.1034/j.1600-0668.2003.00172.x. [DOI] [PubMed] [Google Scholar]
- Lacey J. Aggregation of Spores and its Effect on Aerodynamic Behaviour. Grana. 1991;30(2):437–445. doi: 10.1080/00173139109432005. [DOI] [Google Scholar]
- Lau APS, Lee AKY, Chan CK, Fang M. Ergosterol as a Biomarker for the Quantification of the Fungal Biomass in Atmospheric Aerosols. Atmos Environ. 2006;40(2):249–259. doi: 10.1016/j.atmosenv.2005.09.048. [DOI] [Google Scholar]
- Lindsley WG, Schmechel D, Chen BT. A Two-Stage Cyclone using Microcentrifuge Tubes for Personal Bioaerosol Sampling. J Environ Monit: JEM. 2006;8(11):1136–42. doi: 10.1039/b609083d. [DOI] [PubMed] [Google Scholar]
- Madsen AM. Effects of Airflow and Changing Humidity on the Aerosolization of Respirable Fungal Fragments and Conidia of Botrytis Cinerea. Appl Environ Microbiol. 2012;78(11):3999–4007. doi: 10.1128/AEM.07879-11. [DOI] [PMC free article] [PubMed] [Google Scholar]
- Madsen AM, Schlünssen V, Olsen T, Sigsgaard T, Avci H. Airborne Fungal and Bacterial Components in PM1 Dust from Biofuel Plants. Ann Occupat Hyg. 2009;53(7):749–57. doi: 10.1093/annhyg/mep045. [DOI] [PMC free article] [PubMed] [Google Scholar]
- Madsen AM, Wilkins K, Poulsen O. Micro-Particles from Fungi. In: Johanning E, editor. Bioaerosols, Fungi, Bacteria, Mycotoxins and Human Health. Fungal Research Group Fundation, Inc.; Albany, New York, USA: 2005. pp. 276–281. [Google Scholar]
- Menetrez MY, Foarde KK, Ensor DS. An Analytical Method for the Measurement of Nonviable Bioaerosols. J Air Waste Manag Assoc (1995) 2001;51:1436–1442. doi: 10.1080/10473289.2001.10464365. [DOI] [PubMed] [Google Scholar]
- Menetrez MY, Foarde KK, Esch RK, Schwartz TD, Dean TR, Hays MD, et al. An Evaluation of Indoor and Outdoor Biological Particulate Matter. Atmos Environ. 2009;43(34):5476–5483. doi: 10.1016/j.atmosenv.2009.07.027. [DOI] [Google Scholar]
- Nygaard UC, Samuelsen M, Aase A, Løvik M. The Capacity of Particles to Increase Allergic Sensitization is Predicted by Particle Number and Surface Area, Not by Particle Mass. Toxicol Sci: Off J Soc Toxicol. 2004;82(2):515–24. doi: 10.1093/toxsci/kfh287. [DOI] [PubMed] [Google Scholar]
- Pady S, Gregory P. Numbers and Viability of Airborne Hyphal Fragments in England. Trans Brit Mycol Society. 1963;46(4):609–613. [Google Scholar]
- Pady S, Kramer C. Kansas Aeromycology VI: Hyphal Fragments. Mycologia. 1960;52:681–687. [Google Scholar]
- Pawlowsky-Glahn V, Egozcue JJ. Compositional Data and Their Analysis: An Introduction. Geolog Soc, London, Special Publicat. 2006;264(1):1–10. doi: 10.1144/GSL.SP.2006.264.01.01. [DOI] [Google Scholar]
- Rao CY, Cox-Ganser J, Chew GL, Doekes G, White S. Use of Surrogate Markers of Biological Agents in Air and Settled Dust Samples to Evaluate a Water Damaged Hospital. Indoor Air. 2005;15(Suppl 9):89–97. doi: 10.1111/j.1600-0668.2005.00348.x. [DOI] [PubMed] [Google Scholar]
- Reponen T. Aerodynamic Diameters and Respiratory Deposition Estimates of Viable Fungal Particles in Mold Problem Dwellings. Aerosol Sci Technol. 1995;22(1):11–23. doi: 10.1080/02786829408959724. [DOI] [Google Scholar]
- Reponen T, Grinshpun SA, Conwell KL, Wiest J, Anderson M. Aerodynamic Versus Physical Size of Spores: Measurement and Implication for Respiratory Deposition. Grana. 2001;40(February 2015):119–125. doi: 10.1080/00173130152625851. [DOI] [Google Scholar]
- Reponen T, Seo SC, Grimsley LF, Lee T, Crawford C, Grinshpun SA. Fungal Fragments in Moldy Houses: A Field Study in Homes in New Orleans and Southern Ohio. Atmos Environ (Oxford, England: 1994) 2007;41(37):8140–8149. doi: 10.1016/j.atmosenv.2007.06.027. [DOI] [PMC free article] [PubMed] [Google Scholar]
- Samson RA, Frisvad JC, Hoekstra E. Introduction to Food and Airborne Fungi. Utrecht: Centraalburreau voor Schimmelcultures; 2004. [Google Scholar]
- Sáchez C. Lignocellulosic Residues: Biodegradation and Bioconversion by Fungi. Biotechnol Adv. 2009;27(2):185–94. doi: 10.1016/j.biotechadv.2008.11.001. [DOI] [PubMed] [Google Scholar]
- Seo SC, Choung JT, Cehn BT, Lindsley WG, Kim KY. The Level of Submicron Fungal Fragments in Homes with Asthmatic Children. Environ Res. 2014;131C:71–76. doi: 10.1016/j.envres.2014.02.015. [DOI] [PMC free article] [PubMed] [Google Scholar]
- Seo SC, Reponen T, Levin L, Grinshpun SA. Size-Fractionated (1→3)-β-D-Glucans Concentrations Aerosolized from Different Moldy Building Materials. Sci Total Environ. 2009;407(2):806–14. doi: 10.1016/j.scitotenv.2008.10.018. [DOI] [PubMed] [Google Scholar]
- Singh U, Levin L, Grinshpun SA, Schaffer C, Adhikari A, Reponen T. Influence of Home Characteristics on Airborne and Dust-borne Endotoxin and β-D-Glucan. J Environ Monit: JEM. 2011;13(11):3246–53. doi: 10.1039/c1em10446b. [DOI] [PubMed] [Google Scholar]
- Sivasubramani SK, Niemeier RT, Reponen T, Grinshpun SA. Fungal Spore Source Strength Tester: Laboratory Evaluation of a New Concept. Sci Total Environ. 2004;329(1–3):75–86. doi: 10.1016/j.scitotenv.2004.03.007. [DOI] [PubMed] [Google Scholar]
- Sorenson W, Frazer DG, Jarvis BB, Simpson J, Robinson VA. Trichothecene Mycotoxins in Aerosolized Conidia of Stachybotrys Atra. Appl Environ Microbiol. 1987;53(6):1370–1375. doi: 10.1128/aem.53.6.1370-1375.1987. [DOI] [PMC free article] [PubMed] [Google Scholar]
- Vestlund T, Al-Ashaab R, Tyrrel SF, Longhurst PJ, Pollard SJT, Drew GH. Morphological Classification of Bioaerosols from Composting using Scanning Electron Microscopy. Waste Manag (New York, NY) 2014;34(22):3833–3842. doi: 10.1016/j.wasman.2014.01.021. [DOI] [PubMed] [Google Scholar]
- Womiloju TO, Miller JD, Mayer PM, Brook JR. Methods to Determine the Biological Composition of Particulate Matter Collected from Outdoor Air. Atmos Environ. 2003;37(31):4335–4344. doi: 10.1016/S1352-2310(03)00577-6. [DOI] [Google Scholar]
- World Health Organization. Guidelines for Indoor Air Quality: Dampness and Mould. WHO Regional Office for Europe; Copenhagen O, Denmark: 2009. doi. [Google Scholar]
- Yeh HC, Phalen RF, Raabe OG. Factors Influencing the Deposition of Inhaled Particles. Environ Health Perspect. 1976;15:147–156. doi: 10.1289/ehp.7615147. [DOI] [PMC free article] [PubMed] [Google Scholar]
Associated Data
This section collects any data citations, data availability statements, or supplementary materials included in this article.