Abstract
Phase of an electromagnetic wave propagating through a sample-of-interest is well understood in the context of quantitative phase imaging in transmission-mode microscopy. In the past decade, Fourier-domain optical coherence tomography has been used to extend quantitative phase imaging to the reflection-mode. Unlike transmission-mode electromagnetic phase, however, the origin and characteristics of reflection-mode Fourier phase are poorly understood, especially in samples with a slowly varying refractive index. In this paper, the general theory of Fourier phase from first principles is presented, and it is shown that Fourier phase is a joint estimate of subresolution offset and mean spatial frequency of the coherence-gated sample refractive index. It is also shown that both spectral-domain phase microscopy and depth-resolved spatial-domain low-coherence quantitative phase microscopy are special cases of this general theory. Analytical expressions are provided for both, and simulations are presented to explain and support the theoretical results. These results are further used to show how Fourier phase allows the estimation of an axial mean spatial frequency profile of the sample, along with depth-resolved characterization of localized optical density change and sample heterogeneity. Finally, a Fourier phase-based explanation of Doppler optical coherence tomography is also provided.
1. INTRODUCTION
Phase is a manifestation of an electromagnetic wave propagating through a medium [1]. In microscopic imaging, where the media are often cells and tissue samples with low intrinsic contrast under bright-field imaging conditions, phase contrast [2,3] and differential interference phase contrast [4,5] microscopes are extensively used to noninvasively visualize the structure and dynamics of these unlabeled biological samples. Over time, research efforts have focused on developing microscopes with the ability to both visualize and quantify this phase contrast [6–12] and applying them to characterize cellular dynamics and pathology [13–19]. The phase in these transmission-mode quantitative phase microscopes is well understood in wave optics. It is the integral of the sample refractive index along its depth—that is, the optical path length (OPL)—with respect to the surrounding medium and couples together the refractive index and the sample thickness.
In the past decade, Fourier-domain optical coherence tomography (FD-OCT) [20,21] has been utilized to successfully extend the idea of quantitative phase from transmission-mode to reflection-mode [22–24], generating significant interest in the research community [25–41]. Unlike the transmission phase, however, the phase measured through FD-OCT—either using spectral-domain OCT (SD-OCT) or swept-source OCT (SS-OCT) configurations—is the phase of the Fourier transform of the spectral interference between the depthwise coherently integrated back-reflected waves from within the sample and a reference (preferably a common mode). This Fourier phase, therefore, involves an explicit recharacterization of the phase associated with the propagating electromagnetic wave and carries distinctly different information than the OPL in transmission-mode quantitative phase microscopy (QPM). While studying cellular dynamics at a strong interface, the authors of [23] showed that Fourier phase at the interface estimates the subresolution change in its optical depth location. They named their FD-OCT-derived approach for measuring Fourier phase changes at strong interfaces as spectral-domain phase microscopy (SDPM). In our own work, we have been interested in extending the measurement of Fourier phase to fixed-depth locations within the sample without any strong interfaces. This has led to the development of depth-resolved spatial-domain low-coherence quantitative phase microscopy (dr-SLQPM) [42,43]. During its development, we realized that both SDPM and dr-SLQPM are special cases of a more general and richer theory of Fourier phase. This general theoretical framework is the focus of this paper.
We show that Fourier phase in the context of FD-OCT is an estimate of the otherwise inaccessible (based on Fourier amplitude) structural information about the sample refractive index within the implicit coherence gating enforced by the limited spectral bandwidth of the light source. This structural information characterizes the subresolution offset and mean spatial frequency of the coherence-gated refractive index at the optical depth being probed.
Subresolution offset, first introduced in [23] for a special case, is in general a measure of the subresolution deviation between the optical depth where the measurement is made and the optical depth corresponding to the weighted-center of the coherence-gated refractive index around the probed optical depth. In the particular case of a strong interface, it can be used to measure the subresolution change in the optical depth location of the interface [23]. (Also see Eq. (9) and the related discussion, and Section 4).
The mean spatial frequency is a measure of the average rate-of-change of refractive index within the coherence gate at the optical depth being probed. It is, therefore, a measure of the intrinsic structural property of the coherence-gated refractive index. It quantifies not only the changing (increasing or decreasing) optical density within the gate but also its mean heterogeneity.
Fourier phase is a joint estimate of these two characteristics of the coherence-gated sample refractive index. We show why this is so and derive analytical expressions for this joint estimate from first principles. We additionally show that under specific sample and measurement conditions, SDPM and dr-SLQPM are special cases of this joint estimate. To bring the theoretical framework full circle, we further show that for an ideal source with unrestricted spectral bandwidth, all structural information is carried in the Fourier amplitude of FD-OCT and the Fourier phase is zero. The theoretical results presented here are illustrated and verified throughout by plotting the derived analytical expressions and performing numerical simulations.
These analytical expressions and numerical simulations have interesting implications. Using them we estimate the axial mean spatial frequency profile of the sample, along with providing depth-resolved characterization of localized heterogeneity of the sample refractive index and density changes in the sample refractive index. We also show that they provide a Fourier-phase-based explanation of the principle of Doppler OCT (D-OCT), a functional extension of FD-OCT [44].
The paper is structured as follows. In Section 2, we present how Fourier phase originates and derive its general expression by introducing the concept of structural information. Section 3 explains Fourier phase in the context of a slowly varying refractive index and presents the corresponding analytical expression. This expression is used to establish the validity of dr-SLQPM. In Section 4, the refractive index profile with a strong interface is considered, and the general expression for Fourier phase is used to derive the specific measurement made by SDPM. In Section 5, Fourier phase is discussed for an ideal source with infinite spectral bandwidth. Simulation-based results along with Fourier phase applications and a Fourier phase-based explanation of the D-OCT principle are presented in Section 6. We conclude in Section 7. For ease of explanation, detailed derivations associated with the above sections have been collected in the appendices.
2. GENERAL THEORY
Consider an FD-OCT optical setup that either uses a coherent source with point scanning or a spatially incoherent source with full-field illumination. In the latter case, the van Cittert–Zernike theorem [1] along with the light source properties can be utilized to design optical setups (see, for example, [45]) that decompose the sample illumination beam into mutually incoherent light channels. In either case, if the illumination angle is small, the back-reflected sample field at an en face location (x′, y′) is characterized by a one-dimensional (1D) axial refractive index profile ns(z′), with z′ denoting the physical depth [46]. This 1D characterization is also used in developing the principle of SDPM [23,24] and FD-OCT itself [20].
Assuming that the sample being probed satisfies the Born approximation [1], the reflection profile corresponding to ns(z′) is given by [47,48]
| (1) |
We note that the concept of Born approximation is typically associated with describing the scattering potential of a weakly scattering sample in the setting of diffraction tomography to reconstruct the three-dimensional (3D) refractive index distribution of the sample via far-field measurements of the scattering amplitude [49]. There, the scattering potential F(r) characterizes the refractive index distribution of the sample ns(r) with respect to the surrounding medium nm(r) through the relation [1,47,50], where is free-space wavenumber corresponding to wavelength λ0. However, in the context of Fourier phase, the gradient of the refractive index within the sample is of primary interest as it is the change in the refractive index within the sample that gives rise to the back-reflected sample field. It has been shown that the validity of the Born approximation also allows the scattering potential of an object to be described in terms of the gradient of the 3D refractive index [47]. The restriction of the gradient to the 1D setting is given by Eq. (1).
For the purpose of explication, we adopt a common-path reflection-mode geometry, while noting that it is not a requirement. (Methods have been developed to remove phase noise arising in optical setups, where the reference is generated using a mirror placed in a separate reference arm [51].) In common-path geometry, the reference wave generated by reflection from the substrate–sample interface spectrally interferes with the back-scattered waves from all sample depths (see Fig. 1) resulting in a spectrally interfered signal given by [50]
| (2) |
Here, S(k) is the source spectrum, and the integration upper limit L represents the sample thickness. Equation (2) states that for every wave number k=1∕λ (we use the spectroscopic wave number notation), the last term on the right-hand side is the coherent integration of interference between the reference and reflections from all depths, modulated by the source spectrum. The strength of the sample reflection from physical depth z′ is given by the reflection profile rs(z′) and that of the reference by rr. The self-interference of the reference and within-sample scattering gives rise to the first two terms. In this expository development of Fourier phase, we ignore the first two terms. In practice, ancillary background measurements are used to separately measure and remove . Furthermore, typical experimental conditions ensure rs(z′) ≪ rr, and we can ignore the second term . (In SS-OCT dual balanced detection is used to mitigate the effect of the first two terms.) We, therefore, simplify Eq. (2) to
| (3) |
where, the reflection term has been normalized to remove rr.
Fig. 1.
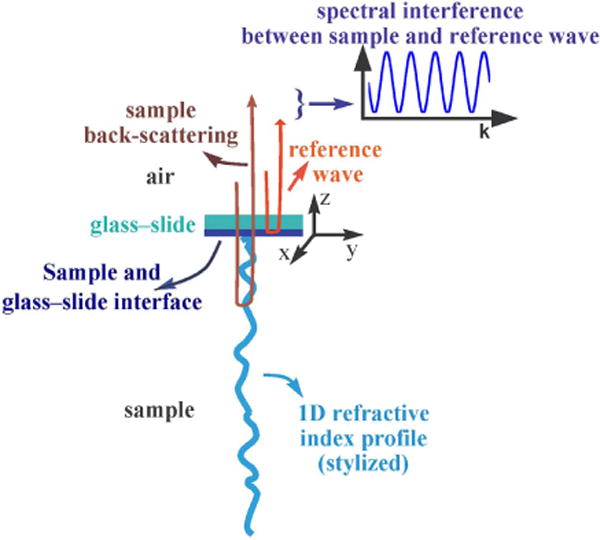
Stylized depiction of spectral interference due to sample back-scattering and common-path reference.
In reflection-mode geometry shown in Fig. 1, the illumination and back-scattered wave vectors corresponding to the wave number k, respectively, are and . The resulting axial spatial frequency, therefore, is given by . We note that throughout this paper spatial frequency will exclusively refer to axial spatial frequency. Incorporating it in Eq. (3) and transforming to the optical-space where Fourier measurements are made, we reformulate Eq. (3) as (see Appendix A)
| (4) |
where
| (5) |
is the optical depth corresponding to the physical depth z′ and
| (6) |
defines the mapping of the reflection profile rs(z′) to the optical-space. Equation (4) now expresses the coherent integration of interference between the reference and reflections from all depths within the sample as a function of the optical depth instead of the physical depth. We emphasize that this mapping from physical-space to optical-space is imperative with the use of Fourier transform in FD-OCT, as the Fourier transform allows access only to the latter and not the former.
The spectral source S(K) we controls the resolution with which can recover ropl(zopl(z′)) through the virtual coherence gating enforced by its correlation function in the optical-space. If the source spectrum had infinite bandwidth, we would have ideal resolution allowing for exact measurement of real-valued ropl(zopl(z′)) with Fourier phase being zero. (We prove this in Section 5.) In practice, however, only a finite spectral bandwidth can be realized, with an attendant loss in resolution. The resulting Fourier transform of the spectral interference has both amplitude and phase, with both carrying distinct information about the refractive index profile within the coherence gate.
The amplitude of the Fourier transform has been well understood within the context of FD-OCT. It captures the coherence-gated average of ropl(zopl(z′)) and therefore is a point estimate of the average strength of coherence-gated ropl(zopl(z′)) at the optical depth being probed. Fourier phase, on the other hand, is a point estimate of two distinct structural characteristics of the refractive index profile within the coherence gate.
The first structural characteristic is the subresolution offset. We denote it by δzopl(z), where zopl(z) indicates the optical depth being probed. Subresolution offset estimates the subresolution deviation of the optical depth associated with the weighted-center of the refractive index profile within the coherence gate, from zopl(z). (Note that the coherence gate is centered at zopl(z).) Mathematically, the subresolution offset is given by
| (7) |
where
| (8) |
Here, Γ(zopl(z′)− zopl(z)) is the correlation function centered at the probing depth zopl(z) that ensures the integration is performed only at those depths that lie within the coherence gate centered at zopl(z). The weighting by the normalized reflection profile ropl(zopl(z′)) emphasizes those depths where the reflection are strong relative to other depths, resulting in being the weighted-center of the refractive index profile. Although no assumption about a strong interface is made, and in fact none is required, we do note that for a strong interface located at zopl(z0), ropl(zopl(z′)) → riδ(zopl(z′)−zopl(z0))—a Dirac-delta at zopl(z0) with reflection coefficient ri—and Eq. (7) reduces to
| (9) |
Thus, for a strong interface, δzopl(z) describes the subresolution offset of zopl(z0), the optical depth where the strong interface is located, from zopl(z), the optical depth being probed. Although a strong interface is easy to identify, δzopl(z) provides additional accuracy in estimating the correct optical depth location of the interface, when there is only a subresolution deviation of the optical depth being probed from the actual optical depth location of the interface. This is the basis for SDPM [23]. Figure 2(a) is a visual illustration of subresolution offset using a simple refractive index profile model. (Note that a strong interface is not assumed.) Later, in Section 3.A, we present a parametric model for this simple refractive index profile, where the subresolution offset is modeled through the subresolution shift parameter. We will effectively employ this model to validate our results.
Fig. 2.
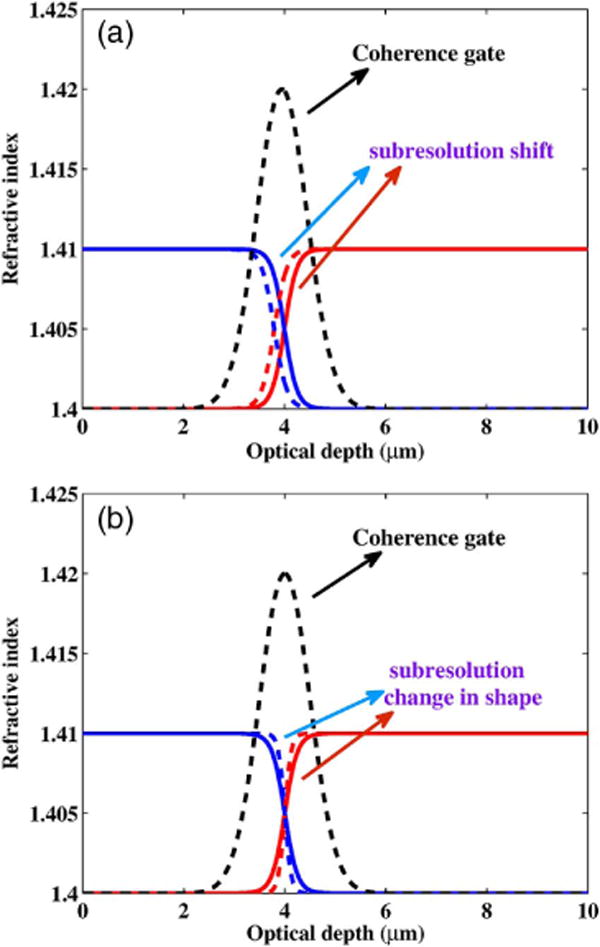
Behavior of the refractive index profile within the coherence gate. (a) Subresolution shift within the coherence gate (indicated by the difference between the solid and dashed lines) for increasing (red) and decreasing (blue) refractive index profiles. It is the parameter used to model subresolution offset. (b) Subresolution change in shape within the coherence gate (indicated by dashed and solid lines) for increasing (red) and decreasing (blue) refractive index profiles. It is the parameter used to model mean spatial frequency.
The second structural characteristic is the mean spatial frequency of the coherence-gated refractive index. We denote it by si(zopl(z)), where zopl(z) is again the optical depth where the refractive index profile is being probed. Mean spatial frequency estimates the average rate at which change in refractive index occurs within the coherence gate centered at zopl(z). (As we will show, the averaging is a direct consequence of the coherence gate.) For example, for an increasing or decreasing refractive index profile within the coherence gate, it characterizes how fast or slow that subresolution change occurs. More generally, it is a characterization of the refractive index heterogeneity within the coherence gate. (Details are in Sections 3 and 6.H.) A simple illustration of mean spatial frequency is depicted in Fig. 2(b), where small changes in the shape of the refractive index model are used to indicate the increasing or decreasing rates-of-change in optical density. The parametric modeling of mean spatial frequency is done through the subresolution shape parameter.
Having described what structural characteristics Fourier phase estimates, we next show how and why this is the case.
A. Structural Information
Consider the spectral interference P(K) in Eq. (4) in its generalized complex form,
| (10) |
with ℜ representing the real part of its argument. Here, for a given K, we interpret the integrand of Eq. (10) as a phasor rotating with angular frequency 2πzopl(z′). The amplitude of this phasor is the real-valued reflection profile ropl(zopl(z′)). Probing ropl(zopl(z′)) at optical depth zopl(z) corresponding to the physical depth z does not return ropl(zopl(z)) but its weighted average over the coherence gate around zopl(z). Using the phasor representation, we explicitly incorporate this loss in resolution by extending the phasor amplitude to its general complex form
| (11) |
where I(K, δzopl(z)) controls the division of ropl(zopl(z′)) between the quadrature cosine and sine components. It is the cosine component that we have access to through Eq. (10). The imaginary sine component represents the resolution loss due to the coherence gate. Therefore, a nonzero value of I(K, zopl(z)) results in a leakage of ropl(zopl(z′)) from the real in-phase component to the imaginary quadrature component. This loss will naturally be greater for refractive index profiles with greater structural content within the coherence gate. Therefore, we refer to I(K, zopl(z)) as structural information reflecting the subresolution structural content of the coherence-gated refractive index profile. We choose I(K, zopl(z)) to be a function of both spatial frequency K and the optical depth zopl(z) at which the refractive index is being probed. The dependence on the latter is natural because the measurement is being made at that optical depth. The dependence on the former is because the measurement is being made in the spectral domain where the sample is being probed by waves with wave numbers .
To characterize the nature of the dependence of I(K, zopl(z)) on K and zopl(z), we note that when we probe the refractive index at zopl(z), the Fourier amplitude is the coherence-gated average of ropl(zopl(z′)). We denote it as |p(zopl(z))|. If we were to place an actual coherence gate, corresponding to the correlation function of the light source at the probing depth zopl(z), then the corresponding coherence-gated average of ropl(zopl(z′)) would be
| (12) |
where we have exploited the symmetry of the correlation function to write the convolution as a correlation. This coherence-gated average has an associated weighted-center where the optical depth of the structural content of the refractive index profile within the coherence gate is centered. This weighted-center is precisely given by [defined in Eq. (8)]. If this weighted-center and the probing depth zopl(z) coincide, then |p(zopl(z))|=ravg. If, however, the two are offset from each other, then the deviation manifests as δzopl(z) given by Eq. (7) and can be accounted for in the following way. The reflection profile within the coherence gate centered at zopl(z) is given by the equivalent reflection profile Equation (10) then tells us that the spectral interference signal corresponding to the back-reflected waves from this equivalent profile is
| (13) |
which can be rewritten as
| (14) |
where is the subresolution offset and for reflection profile is exactly given by Eq. (7). On comparing the complex phasor amplitudes in Eqs. (11) and (14), we define the structural information as
| (15) |
This bilinear—in K and δzopl(z)—characterization of information-loss in conjunction with Eq. (11) bounds I(K, δzopl(z)) to the range (−1, 1). For values outside this range, the structural behavior will manifest in the Fourier amplitude—the amplitude of p(zopl(z)) defined in Eq. (18).
Incorporating Eq. (15) in Eq. (11), we get
| (16) |
which simplifies the spectral interference P(K) in Eq. (10) to (see Appendix B)
| (17) |
Thus, the phasor representation of resolution loss allows us to express spectral interference in terms of structural information. We next show that an estimate of this structural information I(K, zopl(z)) is accessible to us through Fourier phase.
B. Fourier Phase
Fourier phase at the optical depth zopl(z) is the phase of the Fourier transform of the spectral interference P(K),
| (18) |
Appendix C details the expansion of p(zopl(z)) in Eq. (18) to p(zopl(z))
| (19) |
with ℑ representing the imaginary part of its argument and * denoting the convolution operation. ℜ, as before, represents the real part of its argument. As explained in Appendix C, Eq. (19) is the baseband representation of the Fourier transform of the spectral interference whose carrier frequency corresponds to the central frequency of the source
| (20) |
In Eq. (19), , ℓ = 0, 1, 2, … is the baseband representation of the (ℓ) th derivative of reflection profile, and Γ(zopl(z)) is the baseband representation of the correlation function corresponding to the source spectrum centered at Kc. Note that ℓ is a general representation for both 2j and 2j + 1.
The baseband signal holds the entirety of the information content—both amplitude and phase—of the back-scattered signal. A closer look at Eq. (19) reveals that , ℓ = 0, 1, 2, …, are the coefficients of the Taylor expansion of the baseband reflection profile , about zopl(z), and therefore characterize the reflection profile in optical-space. The convolution with the correlation function ensures that only their coherence-gated structural characterization about zopl(z) is reflected in p(zopl(z)).
Equation (19) shows that Fourier phase is given by
| (21) |
where the odd and even order derivatives, respectively, appear in the numerator and denominator of the fraction. Taken with their respective imaginary and real parts, the separation of odd and even coherence-gated Taylor coefficients, respectively, to the numerator and denominator characterizes the structure in a manner that is consistent with tangent phase notation.
Equation (21) states that the Fourier phase measured at zopl(z) jointly estimates two structural features of the coherence-gated refractive index profile. The first is the aforementioned subresolution offset, δzopl(z). The second feature is characterized by the fraction
Despite its rich information content, this fraction is difficult to interpret apart from noting that it is some form of structural characterization of the reflection profile. However, there are two specific scenarios, where the fraction and therefore Eq. (21) reduce to simpler forms. Fortunately, these are the two scenarios of most interest in the context of FD-OCT. The first is when the refractive index profile is dominated by a strong interface and the Fourier phase measurement is made at this interface. SDPM and its derivatives fall in this category. The second arises when there are no strong interfaces within the sample and the sample is well-matched with the medium that it is immersed in. In this scenario, the refractive index profile has a small gradient so that the Born approximation is satisfied. Here, the Fourier phase measurements do not track a particular interface but are made at fixed depth locations. dr-SLQPM falls under this latter category.
It was in anticipation of the second category that we developed the general theory under the assumption that the Born approximation was satisfied. For the first category, certain specific considerations need to be satisfied to ensure the validity of Eq. (21). We detail them in Section 4, where we re-establish the validity of Eq. (21) and its simplification in the presence of a strong interface. We, however, first present the Fourier phase for a slowly varying refractive index profile.
3. FOURIER PHASE ALONG A SLOWLY VARYING REFRACTIVE INDEX PROFILE
Samples with slowly varying refractive index profiles have small gradients. Consequently, their corresponding reflection profiles, given by Eq. (6), have even smaller derivatives. As a result, higher-order derivatives of the reflection profile can be neglected, allowing the simplification of Fourier phase in Eq. (21) as
| (22) |
where only the reflection profile (zeroth-order derivative) and its gradient (first-order derivative) are considered. For notational ease, we define
| (23) |
and rewrite Eq. (22) succinctly as
| (24) |
Equation (24) shows that the Fourier phase for a slowly varying refractive index profile is a joint estimate of δzopl(z) and si(zopl(z)). To characterize the structural information estimated by the latter, we express si(zopl(z)) in terms of the refractive index profile itself. Using Eqs. (1) and (6), we expand Eq. (23) to
| (25) |
where f(·) represents the convolution of its argument with the correlation function and therefore enforces the coherence gating. Equation (25) reveals that for a slowly varying refractive index, the Fourier phase at some optical depth of interest is a manifestation of the interplay between the coherence-gated refractive index profile ns(zopl(z)) and its first two derivatives and at the optical depth zopl(z). We refer to the two derivatives, respectively, as the gradient and curvature of ns(zopl(z)). The ratio between the coherence-gated curvature and the coherence-gated gradient is the first term of Eq. (25), with both derivatives having been first normalized by . (This normalization is due to the measurement being performed in optical-space.) In the slowly varying refractive index regime, both the curvature and the gradient are well-defined and so is the ratio. Furthermore, the first term of Eq. (25) has a simple interpretation: it is an estimate of the mean spatial frequency of the coherence-gated refractive index profile. To see this, first observe that for a slowly varying refractive index the contribution of effectively cancels out, therefore simplifying the first term to . The effect of canceling the contribution of from the numerator and the denominator of the first term is illustrated in Fig. 3(a), which shows a scatter plot of the first term and its simplified form for a range of slowly varying refractive index profiles at a fixed probing zopl(z). The refractive index model used to generate the scatter plot is defined in Eq. (26) (see the following section), and the refractive index variation is controlled through the subresolution shape parameter that varies from −3 to −2.3 in the log-scale (also explained in the next section). This is the range of slow changes in the shape of the refractive index. As can be seen, the scatter plot aligns along the 45° line showing close correspondence between the first term and its simplification. This simplified form is a ratio of the coherence-gated curvature and gradient of the refractive index profile within the coherence gate. The former is a measure of the mean gradient of the refractive index within the coherence gate, while the latter measures the net change in the refractive index within the coherence gate. The ratio of the two, therefore, is an estimate of the mean spatial frequency of the coherence-gated refractive index profile. This can be easily understood by considering the analogy with a car equipped with an accelerometer and a speedometer. For a fixed time interval Δt, the average velocity of the car is , while the average traveled distance is . Here, a(t) and v(t) respectively, denote the instantaneous acceleration and velocity of the car measured, respectively, by the accelerometer and the speedometer. The ratio gives the average time the car takes to travel distance . The ratio , on the other hand, gives the average number of times the car can travel the distance in one unit of time, that is, it gives the mean temporal frequency of car motion. On relating acceleration with curvature of the refractive index, speed with the gradient of the refractive index, and the time interval with the coherence gate, it is easy to see that the first term of Eq. (25) in the slow-varying regime estimates the mean spatial frequency of refractive index change within the coherence gate around zopl(z). This mean spatial frequency describes the average rate at which the spatial change in the refractive index occurs within the coherence gate. This change can be an increasing or a decreasing refractive index within the coherence gate and is described by the subresolution shape of the refractive index profile illustrated in Fig. 2(b). This change can also be an increase (or a decrease) in subresolution heterogeneity, which will manifest as an increase (or a decrease) in spatial frequency. (See Section 6.H.) Finally, to complete the discussion of the first term of Eq. (25) we note that the normalization by need not be neglected as it naturally results from making the measurements in the optical-space. Even with normalization, the first term of Eq. (25) is an estimate of the mean spatial frequency in optical-space. The simplification was primarily done to explain this first term without being encumbered by the normalization factor.
Fig. 3.
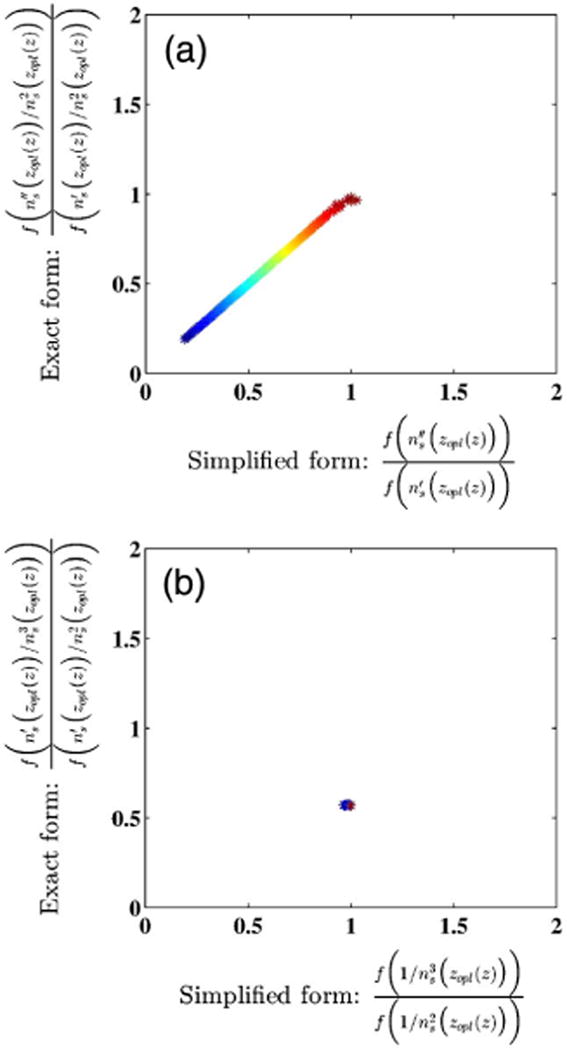
Correlating the behavior of the exact and simplified forms of each term in Eq. (25) at optical depth zopl(z) = 4 μm, using the refractive index model defined in [Eq. (26)]. The parameters of the refractive index model are n0 = 1.4, Δn = 0.01, and s ranging from −3 to −2.3 in the log-scale, indicating a slowly varying refractive index profile. (a) Normalized scatter plot of the first term of Eq. (25) along the y-axis and its simplification along the x-axis. The normalization factor for both axes is 1.019 × 10⁷ m−1. (b) Normalized scatter plot of the second term of Eq. (25) along the y-axis and its simplification along the x-axis. The normalization factor for both axes is 0.0025 m−1.
The second term of Eq. (25), also well-defined for a slowly varying refractive index, is unresponsive to the slow variation. Figure 3(b) shows the scatter plot between it and its simplified form , where the effect of the gradient of the slowly varying refractive index profile is neglected in the numerator and the denominator. First, it can be seen that the scatter plot has no spread illustrating the unresponsiveness of the second term to the variation in refractive index. Second, the location of the scatter points shows that the effect of the gradient of the refractive index profile is to reduce the contribution of the second term to si(zopl(z)) in Eq. (25).
In absolute terms, the factors used to normalize the scatter plots for the first and second terms of Eq. (25), respectively, are 1.019 × 10⁷ m−1 and 0.0025 m−1. Since the former is much greater than the latter, the second factor can be neglected, resulting in si(zopl(z)) itself being an estimate of mean spatial frequency. It is also worth noting that the value of the subresolution shape parameter for which si(zopl(z)) 1.019 × 10⁷ m−1 in the log-scale is −2.3. In the linear-scale the log-scale value corresponds to 1 × 10⁷ m−1, illustrating that si(zopl(z)) is indeed an estimate of the mean spatial frequency. Finally, we note that si(zopl(z)) is not defined in the impractical scenario of the refractive index gradient being zero, that is, when the reflection profile is zero and there is no back-scattered light.
Therefore, we can now state that the Fourier phase jointly estimates the structural information given by δzopl(z) the subresolution offset, and si(zopl(z)), the mean spatial frequency.
A. Subresolution Shape and si(zopl(z))
Consider the refractive index model given by the modified sigmoidal function
| (26) |
where an isolated change in shape is modeled at a physical depth z0. Figure 4 provides the illustration. A small change in z0 will shift the physical depth where the isolated change occurs. We refer to this change in z0 as the subresolution shift in the location of the isolated change in the refractive index profile. In Section 6, we decompose z0 as z0 = zℓ + Δz0. We perform our Fourier measurement at optical depth zopl(zℓ) corresponding to physical depth zℓ. Δz0 models the subresolution offset. Since zℓ is kept fixed, the subresolution shift parameterizes the subresolution offset. The structural characteristic δzopl(z0) is an estimate of Δz0 in optical-space.
Fig. 4.
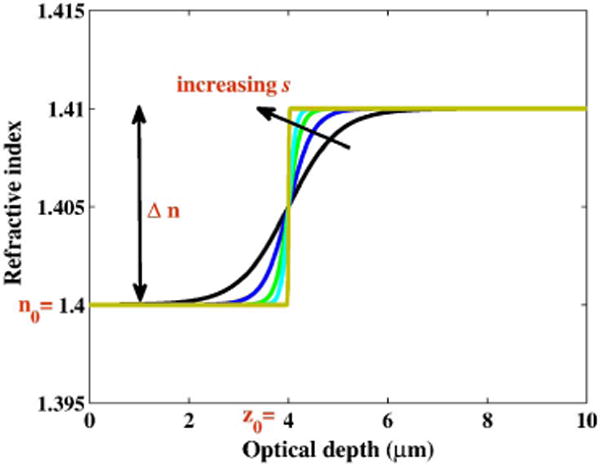
Simple refractive index profile model with an increasing value of the shape parameter.
The parameter n0 is the baseline refractive index, and Δn is the net change in refractive index around physical depth z0. Noting that the refractive index of vacuum is one, we set n0 ≥ 1. The shape parameter s controls how the net change Δn manifests itself. For a given Δn, small values of s indicate a slowly varying refractive index, while the limit s → ∞ indicates a strong interface, where the net change Δn occurs in a single discontinuous step. This range of shapes of the refractive index profile is shown in Fig. 4. We refer to this shape parameter as subresolution shape as its effect is primarily localized within the coherence gate. We note that for the refractive index model in Eq. (26), the subresolution shape s controls the rate at which the isolated change occurs. For increasing s, the rate-of-change increases. This notion can be made precise by considering the Fourier transform of a sigmoidal function. The Fourier pair is given by . It can be seen in the amplitude of the Fourier transform that the frequency spread of cosech away from zero is controlled by the subresolution shape s. As s increases, the rate at which the isolated change occurs increases, and the Fourier pair shows that the higher spatial frequencies are present in the refractive index model in proportion to s. Therefore, we use s as a measure of spatial frequency of the refractive index profile within the coherence gate. The unit of s is meter−1.
Based on this model and using Eq. (25), we can analytically compute the value of si(zopl(z)). Additionally, if for the sake of simplicity, we assume δzopl(z) to be some constant c, we can qualitatively isolate the effect of si(zopl(z) on Fourier phase ϕ(zopl(z)) through the simplified relation ϕ(zopl(z)) = tan−1 (csi(zopl(z))). Figures 5(a), 5(b), and 5(c) plot this effect of si(zopl(z)) on Fourier phase, respectively, due to changes in s, n0 and Δn. We express the shape parameter in log-scale by transforming s to log10 (sd∕2), where d = 1 nm. The shape parameter of this transformed representation changes from −3 to 0 as the refractive index changes from a slowly varying profile (0.002∕d) to one with a strong interface (2∕d). We note that to approximately ensure that the parameter-based changes in the refractive index profile can be reasonably described as subresolution changes, we consider a small range of values for the three parameters.
Fig. 5.
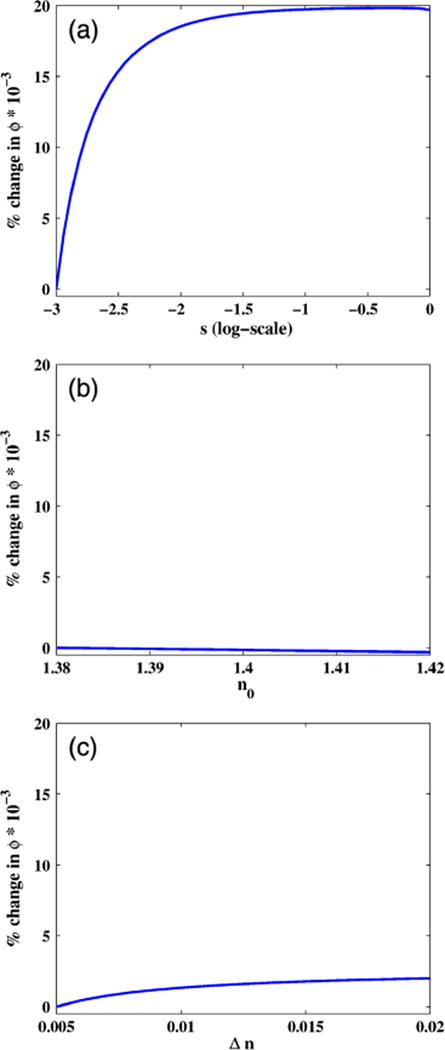
Effect of si(zopl(z)) on Fourier phase for changing values of the s, n0, and Δn parameters. The shape parameter s is expressed in the log-scale. (a) Increasing s for n0 = 1.4, Δn = 0.01, and z0 = 2.85 μm. (b) Increasing n0 for s = −2.3, Δn = 0.01, and z0 = 2.85 μm. (c) Increasing Δn for n0 = 1.4, s = −2, and z0 = 2.85 μm.
Figure 5 shows that the Fourier phase responds most strongly to change in subresolution shape and most weakly to change in n0. The Fourier phase eventually becomes unresponsive to increasing subresolution shape because these are higher-order changes not captured by the curvature and gradient of the refractive index. Fourier phase has a moderate response to Δn primarily through the indirect effect of Δn on the subresolution shape for any given value of the s parameter. Δn itself does not directly affect the Fourier phase because it is the common term in both the curvature and gradient of the refractive index profile and therefore its effect is canceled out [in the first term Eq. (25)], while its effect on the second term is weak.
B. Depth-Resolved Spatial-Domain Low-Coherence Quantitative Phase Microscopy
In dr-SLQPM, the sample satisfying the Born approximation is embedded in a well-matched medium, making it ideally suited to the Fourier phase approximation in Eq. (22) for volumetric structural characterization. Utilizing an approximately collimated and spatially incoherent white light source, dr-SLQPM decomposes the 3D physical-space into lateral x, y-space, with each en face location x, y associated with an axial z channel (with the associated z-space), which is mutually incoherent with channels corresponding to other lateral locations. The standard FD-OCT principle allows dr-SLQPM to map each z-space refractive index profile to optical-space zopl, allowing dr-SLQPM to operate in the hybrid space (x, y, zopl). For all en face locations, the zopl space is sampled at fixed optical depths (note, not interfaces) with the sampling interval a small fraction of the width of the coherence gate. This oversampling mimics the action of a sliding window along the axial refractive index profile. Oversampling has two benefits. First, the small sampling step ensures that any change in Fourier phase results in a two-dimensional (2D) Fourier phase-based map that washes out the effect of δzopl(z)—the reason and the extension to 3D is discussed in Section 6.C—allowing the map to characterize the mean spatial frequency of the axial refractive index.
4. FOURIER PHASE AT A STRONG INTERFACE
In 2005, two groups independently proposed spectral-domain phase microscopy (SDPM) where they measured the Fourier phase ϕ(zopl(z)) to, respectively, study subresolution motion in living cells and perform quantitative phase-contrast imaging in the reflection-mode. In both of these works, Fourier phase measurements were performed at a strong interface. One of the groups was also the first to provide a physical interpretation of their results (see Eq. (2) in [23]) by establishing a relation between the Fourier phase measurement at a strong interface and the subresolution offset δzopl(z) between the optical depth the measurement was made and the optical depth where the interface was actually located. We now show that their result is a special case of the Fourier phase defined in Eq. (21).
A. Establishing the Validity of the Born Approximation
Our derivation of Fourier phase required the validity of the Born approximation which assumes a sample with a slowly varying refractive index profile [1]. Such a profile decouples the Cartesian components of the complex light wave as it travels through the sample by ensuring that the last term of the wave equation
| (27) |
is negligible, thereby allowing a one-to-one far-field correspondence between K and kbs − ki. However, when the refractive index profile is defined by a strong interface, the gradient of the refractive index can no longer be neglected. Nevertheless, for normal source illumination where the sample can be decomposed into an en face representation of 1D refractive index profiles—a condition typically satisfied by FD-OCT setups— the decoupling is valid despite the strong interface, under the strict condition that the number of strong interfaces is restricted to one.
Consider the general case of a plane-polarized light wave incident on the interface at an angle θi. (See Fig. 6.) Assuming the parallel and perpendicular polarization of the light wave at the interface be the complex-valued amplitudes Ep and Es, respectively—the polarizations are described with respect to the plane of incidence—the Cartesian components of the incident wave are given by and When the angle of incidence is normal, that is, is zero. As the gradient of the refractive index profile is along the z-direction with its lateral components zero, the last term of Eq. (27) is zero. Furthermore, a single strong interface does not violate the assumptions of negligible multiple-scattering events and negligible depth distortion effects due to the refractive index gradient required for the Born approximation to hold. As a result, both Eq. (1) [47,48,52] and Eq. (21) remain valid, however, Eq. (22) is not.
Fig. 6.
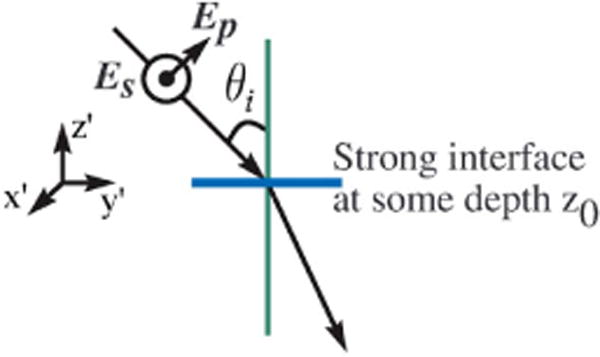
Plane-polarized light incident on a strong interface at an angle θi. The plane of incidence is in the y′–z′ plane. Parallel and perpendicular polarization of only the incident illumination is shown.
B. Invalidity of Eq. (22) at a Strong Interface
Corresponding to the refractive index profile model of in Eq. (26), the reflection profile in the optical-space is
| (28) |
In the limit s → ∞, the refractive index is approximated by a Heaviside function, while the reflection profile in Eq. (28) approaches (see Fig. 7) a Dirac-delta
| (29) |
where is the reflection coefficient at the optical depth zopl(z). It is interesting to note that this reflection strength corresponds to the reflection coefficient obtained using the Fresnel equations for normal illumination [1], after accounting for the optical-space transformation factor
Fig. 7.
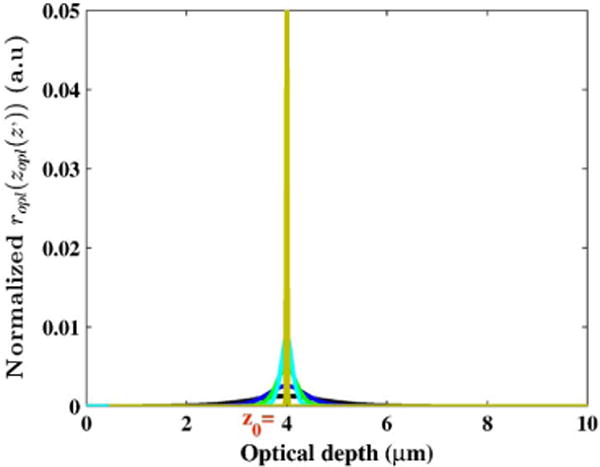
Optical-space reflection profile expressed in Eq. (28), corresponding to the refractive index model in Eq. (26) and plotted in Fig. 4, for increasing values of the shape parameter.
Incorporating Eq. (29) in Eq. (21), we rewrite the Fourier phase at zopl(z0) as
| (30) |
where
Here, ℓ denotes the order of Dirac-delta derivative. We note that since ri is common to both the numerator and the denominator, it cancels out.
Equation (30) shows that unlike the slowly varying refractive index profile, higher-order derivatives of the refractive index profile are not negligible, thereby invalidating Eq. (22). However, as we now show, under a mild condition, we get a simple closed form for the Fourier phase at a strong interface that matches the result in [23]. We note that this Fourier phase is derived under more general conditions than those in [23].
C. SDPM: General Development
We begin by restating the Fourier phase in Eq. (30) as (see Appendix D for details)
| (31) |
where
and
The abbreviation H.O.T. stands for “higher-order terms” with respect to γ(0).
Simplification of Eq. (31) requires that the condition be satisfied. We know from Eq. (11) and the discussion thereafter that . Therefore, for the condition to be valid, we only need to show , that is, the ratio of the second-order derivative of the correlation function evaluated at its center of symmetry, and the square of the center frequency of the source is much less than one. For a typical Gaussian correlation function with standard deviation σ, the magnitude of Γ(2)(0) is . Therefore, the condition is satisfied when . For a standard deviation σ, the corresponding full width at half-maximum of the coherence gate is . Furthermore, the central wavelength of the source spectrum . Figure 8 plots as a function of ℓc and λc. As can be clearly seen, for a majority of ℓc and λc combinations typical for OCT setups, . For these combinations , and Eq. (32) simplifies to
| (32) |
| (33) |
as the higher powers of γℓ(0) can be neglected. For , the ratio in Eq. (33) is upper bounded by 1.554, and the Fourier phase is given by
| (34) |
For even smaller values of Δ, the ratio approaches one, and the Fourier phase is given by
| (35) |
For , Fourier phase is simply approximated by
| (36) |
This result is identical to that obtained in [23].
Fig. 8.
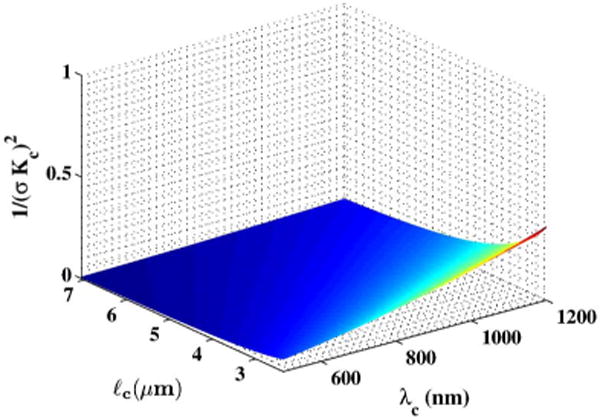
Behavior of as a function of full width at half-maximum coherence length, ℓc, and central wavelength of the source spectrum, λc.
5. FOURIER PHASE FOR AN IDEAL CONDITION: INFINITE SPECTRAL BANDWIDTH
For infinite spectral bandwidth, the correlation function approaches a Dirac-delta, , with ℓc → 0. As a consequence, the integral on the right-hand side of Eq. (8) approaches zopl(z), resulting in δzopl(z) → 0. It then follows from Eq. (21) that the Fourier phase approaches zero if the fraction remains well-defined. To verify that this indeed is the case, we first note that Kc is no longer the center frequency. In fact, the concept of center frequency becomes meaningless for an ideal source with infinite spectral bandwidth. It follows that the baseband and the passband representations of the derivatives of the reflection profile are the same because downshifting the ideal source by any amount has no effect. As a result, and each imaginary term in the numerator is
| (37) |
| (38) |
| (39) |
| (40) |
| (41) |
We note that is always a real-numbered value. Equations (37) through (41) show that all the summation terms in the numerator of Eq. (21) are zero and therefore so is the numerator.
The denominator, on the other hand, reduces to
| (42) |
| (43) |
| (44) |
and consequently, the fraction reduces to . Therefore, it is indeed well-defined and is in fact zero and so is the Fourier phase. Equations (41) and (44) further show that the Fourier transform of the spectral interference given in Eq. (19) is
| (45) |
Thus, for an ideal source with infinite spectral bandwidth, the Fourier transform of the spectral interference between the reference wave and the back-reflected sample field is a real signal, equal to the actual reflection profile of the sample.
6. RESULTS AND DISCUSSION
Having presented the theoretical development of how the Fourier phase jointly estimates subresolution offset and mean spatial frequency, we present simulations based on the parametric model of the refractive index profile given in Eq. (26) to support our theoretical predictions, illustrate the suitability of Fourier phase for dr-SLQPM, and highlight its distinct characterization of coherence-gated structural information with respect to Fourier amplitude. We also present multiple applications of Fourier phase and describe flow velocity in D-OCT in terms of Fourier phase.
A. Parametric Modeling of the Refractive Index Profile
We use Eq. (26) to model the refractive index profile. This profile is parameterized by z0, n0, Δn, and s. Parameter z0 is the depth location around which the change in the refractive index profile occurs with respect to the baseline refractive index characterized by n0. Parameters Δn and s control the nature of this change. The former specifies the increase (Δn > 0) or decrease (Δn < 0) in refractive index, while the latter specifies how this increase or decrease is realized. For small values of s, the rise is gradual and spread over a range of depths around z0. This spread implies that back-reflected waves are coming from a range of depths, corresponding to greater structural complexity and higher structural information. It is in this range of smaller values of s that the Fourier phase is most responsive, as is shown in the results presented below.
For s → ∞, the rise is sharp and localized at z0, corresponding to a strong interface. Here, based on our discussion in Section 4, we expect the Fourier phase to primarily estimate δzopl(z). This is indeed the case. As a side point, we note that Δn contributes to the strength of the interface. A sharp change might not imply a strong interface if Δn is small. This is especially true in experimental settings, where the refractive index profile with a sharp change can only be approximated by a Heaviside function. In such settings, for the sharp change to qualify as a strong interface, Δn should be large enough that it relatively dominates the slow-varying changes in the refractive index at other depths. However, in the simulations presented here, the interface with a sharp change and strong interface coincide.
Each of the above four parameters define the following four behaviors:
Behavior 1: subresolution shift controlled by z0. [See Fig. 2(a).] As noted in Section 3.A, for a fixed zℓ, change in z0 parameterizes subresolution offset Δz0.
Behavior 2: subresolution shape controlled by s. [See Fig. 2(b).]
Behavior 3: baseline shift controlled by n0. [See Fig. 9(a).]
Behavior 4: interface increment controlled by Δn. [See Fig. 9(b).]
Fig. 9.
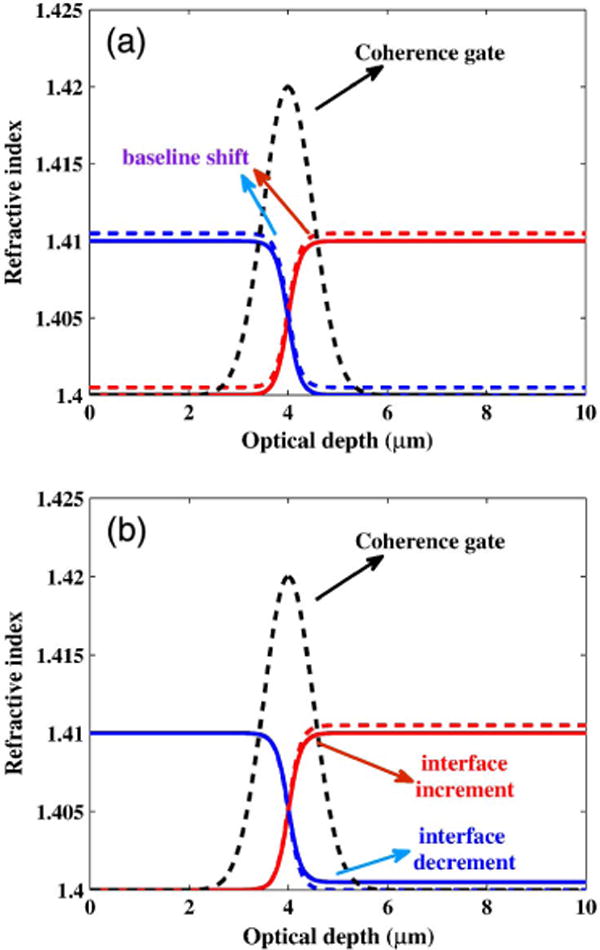
Behavior of the refractive index profile within the coherence gate in addition to those shown in Fig. 2. (a) Baseline shift (indicated by solid and dashed lines) for increasing (red) and decreasing (blue) refractive index profiles. (b) Interface increment (indicated by solid and dashed lines) for increasing (red) and decreasing (blue) refractive index profiles.
The first two have already been discussed in the context of δzopl(z) and si(zopl(z)). Simulation results presented below validate those connections. The last two behaviors are included for a complete description of Fourier phase response to all model parameters.
In Sections 6.C, 6.D, and 6.E we, respectively, present Fourier phase simulations for Behaviors 1 and 2, 3 and 2, and 4 and 2. The reason for including Behavior 2 in all the three cases is that we have presented theoretical details for the refractive index profile that is either slowly varying or has a strong interface, and the demarcation between these two regimes is controlled by s. We begin by detailing our simulation methodology.
B. Simulation Methodology
To simulate the Fourier phase measurement, we consider a white light spectral source S(k) with spectral bandwidth B (500–800 nm), center frequency Kc= 3.25 MHz, and ℓc = 1.5 μm corresponding to a Gaussian-shaped S(k), and mean refractive index of 1.4. The refractive index profile ns(z′), defined by Eq. (26), is implemented as a multilayer system with the unit layer thickness taken to be d = 1 nm. The implementation requires constructing a transfer matrix [53] to mimic wave propagation through the refractive index profile. This is done for each K = 2k = 2∕λ. The back-reflected waves from all depths are interfered with a reference that is implemented in the common mode, by defining a substrate and refractive index profile interface. These interferences from all depths are integrated to get the spectral interference curve, P(K), as a function of spatial frequency K. (We note that unlike the experimental implementation, where phase noise can be greatly minimized by common-mode geometry, it is not important in the context of this simulation. It suffices to simply set the reference reflection-coefficient to one.) The self-interference of the reference and back-reflected sample waves is ignored. The Fourier transform of the spectral interference curve is the complex Fourier signal p(zopl(z)) as a function of optical depth. The Fourier transform is implemented as a discrete-time Fourier transform. The phase of the Fourier transformed spectral interference is
| (46) |
This phase is wrapped and modulated by the center frequency Kc. Therefore, it is first unwrapped along the optical depth, followed by subtracting −2πK czopl(z) from it to remove the phase ramp associated with the Kc-centered passband of the source spectrum. The resulting phase is the unwrapped Fourier phase. This, however, is not the final result as the unwrapped Fourier phase, by definition, accumulates Fourier phase along the depth due to the unwrapping. Therefore, at any optical depth, it is affected by all depths preceding it. We resolve this conflict by computing the gradient and integrating it within the coherence gate around the optical depth zopl(z) to get the correct Fourier phase. Note that this coherence-gated integration of the phase gradient is not providing any additional information. It is only retrieving the coherence-gated unwrapped Fourier phase information—associated with p(zopl(z))—otherwise difficult to access due to phase wrapping. Furthermore, since ϕ′(zopl(z′)) is the instantaneous frequency, it cannot exceed the bandwidth of the source spectrum. Therefore, we use it to filter out those depths where the instantaneous spatial frequency exceeds the source bandwidth.
The phase obtained after the filtering is expressed in units of length by multiplying it by , where λc is the wavelength corresponding to Kc. We denote it by δopl. As an illustration, Fig. 10 shows Fourier phase as a function of optical depth computed using the method outlined above for refractive index profile modeled by Eq. (26) with increasing values of s. This method to extract Fourier phase is used in all results presented below.
Fig. 10.
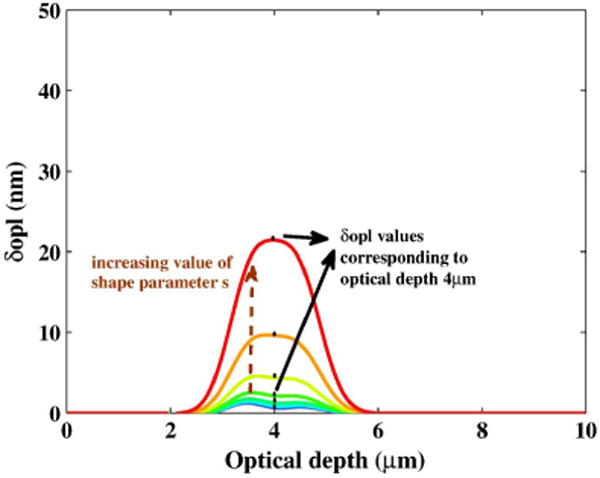
Fourier phase profiles for fixed refractive index model parameters z0 = 2.85 μm, Δn = 0.01, and n0 = 1.4 and increasing shape parameter s. The optical depth corresponding to physical depth z0 = 2.85 μm is 4 μm.
C. Fourier Phase: Estimating Subresolution Offset and Subresolution Shape
We consider a 7 μm refractive index profile and set n0 = 1.4 and Δn = 0.01. The corresponding OPL is roughly 10 μm. Parameter n0 fixes the baseline refractive index, and Δn fixes the net increment in the refractive index with respect to the baseline. The two parameters z0 and s are varied:
A Fourier phase measurement is made at zℓ, and Δz0 is varied from −20 through 20 nm. We set zℓ = 2.85 μm, resulting in a subresolution shift in z0 = Δzℓ + Δz0 ranging from 2.83 through 2.87 μm.
The shape parameter s is varied from 0.002∕d to 2∕d, which changes the shape at the interface from slowly varying to strong. To avoid cluttering the figures, s is plotted in a log-scale (from −3 to 0). The transformation to log-scale was discussed in Section 3.A.
For each of the pairwise values of z0 and s, the Fourier phase is measured at zopl(zℓ) = 4 μm. Figure 11(a) shows the 2D plot of the resulting Fourier phase as a function of Δz0 and s. In the slowly varying refractive index regime, Fourier phase increases with the increasing value of s just as theoretically predicted by Eq. (25), shown in Fig. 5(a). Fourier phase, therefore, captures increasing optical density. Comparing Eq. (24) with Eqs. (34) and (35) shows that si(zopl(zℓ)) is approximately bounded by 2πKc. Therefore, as the value of s approaches the strong interface regime, its value approaches or exceeds 2πKc, and Fourier phase dependence on s ceases. As a result, for strong interfaces Fourier phase primarily depends on δzopl(zℓ) in accordance with theoretical results in Eqs. (34)–(36). Figure 11(b) shows this dependence through the marginal representation extracted from the 2D plot. As can be seen, Fourier phase captures the subresolution offset δzopl(zℓ). For Δz0 < 0, zopl(z0) < zopl(zℓ), and in conjunction with Eq. (7), implies and δzopl(zℓ) > 0. Similarly, for Δz0 > 0, δzopl(zℓ) < 0. It should, however, be noted that in the simulation δzopl(zℓ), underestimates the subresolution offset Δz0, partly because of the correlation function weighting in Eq. (8) skews the weighted-center toward zopl(zℓ) and partly by the action of tan−1. We note that Fourier phase estimation of δzopl(zℓ) for a strong interface makes it suitable for measuring subresolution dynamic changes in optical depth of the interface via SDPM.
Fig. 11.
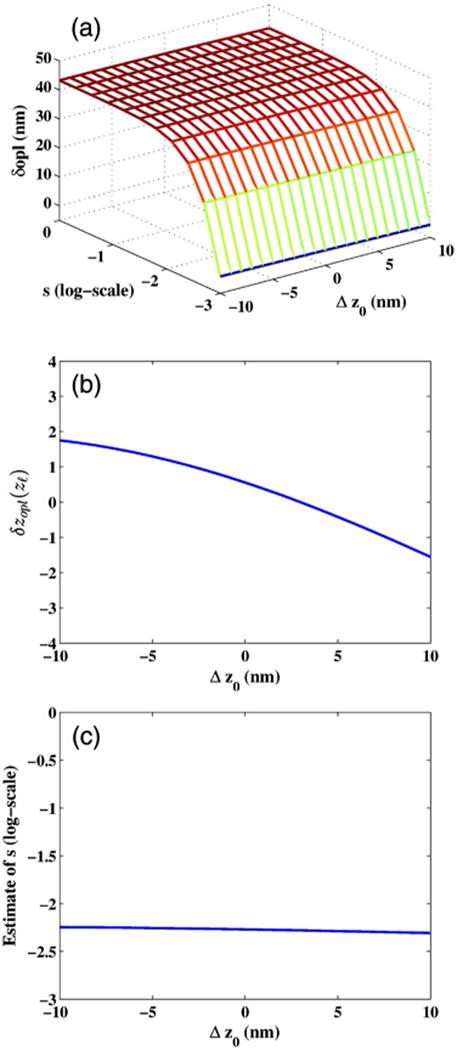
Behavior of Fourier phase by varying the subresolution offset and shape for a fixed baseline shift and interface increment. Fourier phase is plotted in units of length and the shape parameter s is expressed in the log-scale. (a) Fourier phase as a 2D function of subresolution offset and shape. (b) Isolating the effect of subresolution offset on Fourier phase. (c) Estimating the subresolution shape from Fourier phase and subresolution offset for true shape parameter value of −2.7 in the log-scale.
In our theoretical development of a slowly varying refractive index profile, we showed in Eq. (24) that tan (ϕ(zopl(zℓ))) = δzopl(zℓ)si(zopl(zℓ)). From our simulation we know the value of Fourier phase ϕ(zopl(zℓ)), and also δzopl(zℓ), allowing us to estimate the mean spatial frequency, which for the model we have used is parameterized by the subresolution shape. Figure 11(c) shows the estimate of subresolution shape corresponding to the actual s = −2.7 in the log-scale as function of Δz0. First, the estimate of s is approximately −2.27 and is constant for all values of subresolution offsets, thereby illustrating that si(zopl(zℓ)) captures the intrinsic structural characteristic of the refractive index profile. Second, the value of s is slightly over-estimated primarily because the value of δzopl(zℓ) is under-estimated.
In the slowly varying refractive index regime, the symmetry of Fourier phase dependence on δzopl(zℓ) can be used to remove its effect by performing Fourier phase measurements at multiple optical depths with subresolution sampling intervals. Given the symmetry, a depthwise average of the Fourier measurements will wash out the dependence of Fourier phase on δzopl(zℓ) and only capture the effect of s [or more generally si(zopl(zℓ))] as desired. Moreover, it is not even necessary that the Fourier phase average be taken for the entire sample depth. A window, the size of the coherence gate, can be moved over the Fourier phase profile. Averaging within the window will remove the effect of δzopl(zℓ), while also providing a depth-resolved estimate of s. (See Section 6.H below.) When performed at all lateral locations, we get a 3D characterization of s.
Fourier phase and Fourier amplitude: can Fourier amplitude estimate either δzopl(zℓ) or si(zopl(zℓ)) unambiguously? The answer is no. In Figs. 12(a) and 12(b), we show the Fourier amplitude profiles, respectively, for different values of Δz0 and s. For the former, the subresolution offsets of the order of 10 nm do not substantially change the amplitude profile. For the latter, although the amplitude does change with changing s, it is difficult to ascertain the cause. This causal ambiguity—whether the amplitude change is due to a slowly varying refractive index or simply due to a smaller interface increment Δn for a sharp interface—is not present in Fourier phase. For a slowly varying refractive index, a fast increase in Fourier phase, as shown in Fig. 11, can happen only due to an increasing si(zopl(zℓ)). (This point is further emphasized by the results in the next two sections.) On the other hand, for refractive index profiles with a strong interface, the change in Fourier phase is only due to subresolution offset δzopl(zℓ).
Fig. 12.
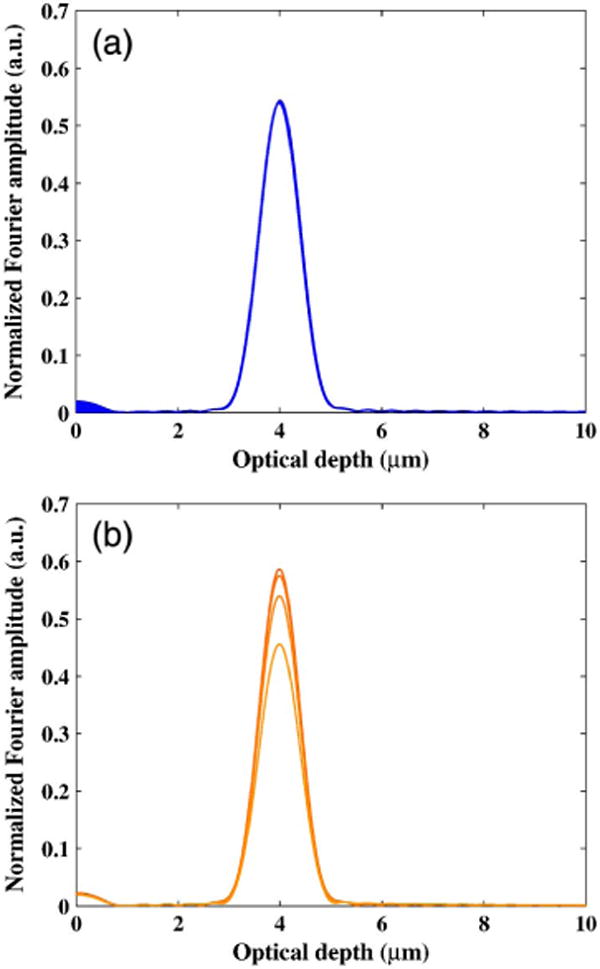
Fourier amplitude profiles as a function of optical depth for (a) Δz0 ranges from −11 to 9 nm for s = −2.2 and (b) changing subresolution shape from −2.4 through −1.8 for Δz0 = −11 nm.
D. Fourier Phase: Estimating Baseline Shift and Subresolution Shape
Here, we set z0 = zℓ and define the baseline refractive index to be n0 = zℓ + δn0, with zℓ = 1.4 and δn0 (Behavior 3) varying between −0.02 and 0.02. As in Section 6.C above, shape parameter s is varied from 0.002∕d through 2∕d, corresponding to −3 through 0 in the log-scale. For each pairwise value of δn0 and s, the Fourier phase is computed. Figure 13 shows the 2D plot of Fourier phase as a function of δn0 and s. The plot shows that Fourier phase captures the subresolution shape of the refractive index profile but very weakly depends on the baseline shift, which is in line with the theoretical prediction of Eq. (25) shown in Fig. 5(b). The primary discrepancy between theory and simulation is that when the baseline shift is large enough for the same measurement location of zopl(zℓ), the weighted-center moves from one side of zopl(zℓ) to the other, thereby inducing a change in sign. Specifically, when the baseline increases, that is δn0 > 0, the optical depth zopl(z0) where the interface is located also increases for the same physical depth z0, and at some combinations of s and δn0 it exceeds zopl(zℓ) and δzopl(zℓ) becomes negative. This can be seen in Fig. 13, where the change from positive to negative is not centered at n0 = 0 but deviates from it depending on what s is. This is not an issue in the practical scenario. If one ensures that the mean refractive index of the medium in which the cell or tissue sample is embedded is less than the mean refractive index of the sample, δn0 will effectively be less than zero, resulting in our operating in the positive regime. Given this regime, the Fourier phase dependence on |δn0| is weak.
Fig. 13.
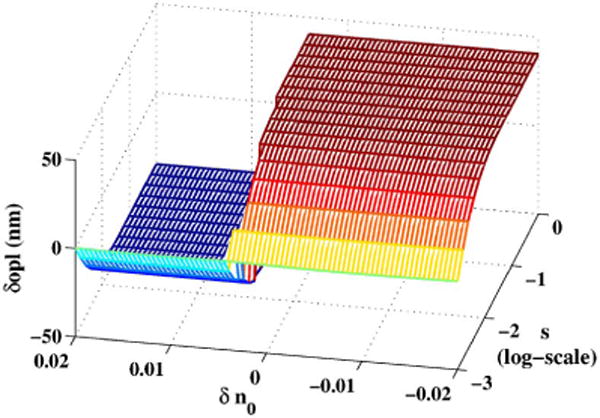
Behavior of Fourier phase by varying the baseline shift and subresolution shape for fixed subresolution offset and interface increment. Fourier phase is plotted in units of length and the shape parameter s is expressed in the log-scale.
E. Fourier Phase: Estimating Interface Increment and Subresolution Shape
We set n0 = zℓ, z0 = zℓ, and vary interface increment Δn (Behavior 4) and subresolution shape s, respectively, between −0.02 and 0.02, and −3 and 0 (log-scale). Figure 14 shows that as in the previous two cases, Fourier phase reliably estimates structural information corresponding to subresolution shape parameter s in the slowly varying refractive index regime. However, unlike the theoretical prediction in Fig. 5(c), where the dependence of Fourier phase on interface increment is moderately weak, the simulation shows that the dependence of Fourier phase on interface increment is even weaker. This discrepancy primarily arises because the interface increment indirectly affects the shape of the increment. This indirect effect is easily captured in the plot of the analytical expression. In the case of simulation, however, this effect is subsumed by the changing shape parameter.
Fig. 14.
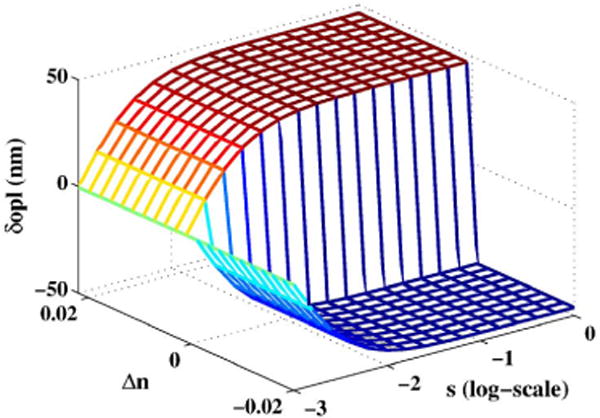
Behavior of Fourier phase by varying the interface increment and shape for fixed baseline shift and subresolution offset. Fourier phase is plotted in units of length and the shape parameter s is expressed in the log-scale.
We note that Fourier phase distinctly captures one characteristic of Δn, and that is the direction of change. For negative values of Δn, Fourier phase becomes more negative with increasing values of s until it enters the strong interface regime, where it stops responding to changes in s. The opposite happens for positive Δn.
F. Application: Fourier-Phase-Based Estimation of the Axial Mean Spatial Frequency Profile
The parametric model of the refractive index profile helped illustrate the nature of structural information carried by Fourier phase. In practice, however, such an ideal profile has modest relevance. Therefore, we turn our attention to a more realistic refractive index profile (with n0 = 1.4) depicted in Fig. 15(a). Fourier phase measurements are performed on this refractive index profile using the simulation methodology outlined in Section 6.B above. These measurements are performed at fixed oversampled optical depths in accordance with the strategy discussed in Section 3.B. The resulting optical phase profile ϕ(zopl(z)) is convolved with a Gaussian window W—mimicking the coherence gate imposed by the spectral source described in Section 6.B above—to suppress the effect of subresolution offset δzopl(z) due to its local symmetry and obtain ϕW(zopl(z)). (See Section 6.C above.) The estimate of the optical-space axial mean spatial frequency profile is then given by , where the coherence ℓc as the normalization factor.
Fig. 15.
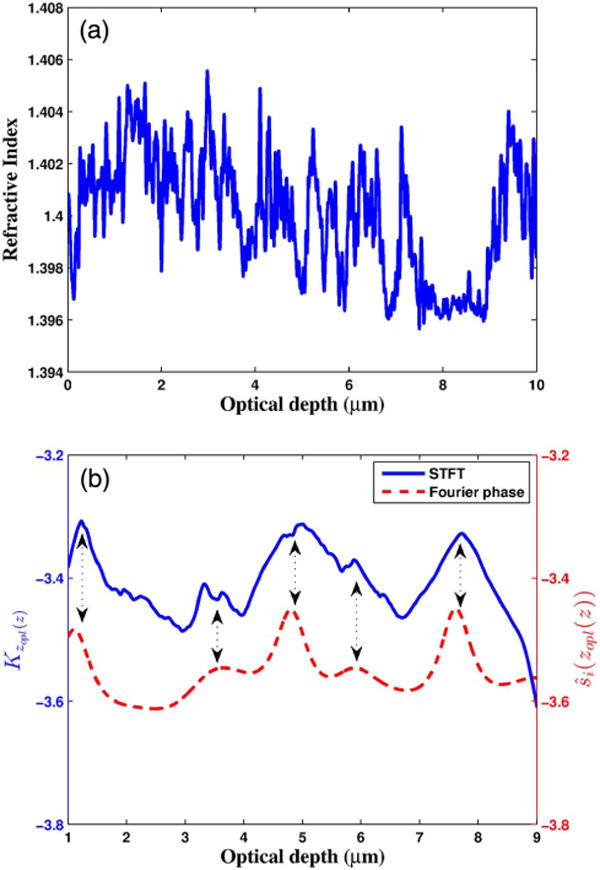
(a) Refractive index profile mapped to the optical-space, and (b) Fourier phase and STFT-based estimates of the axial mean spatial frequency profile corresponding to the refractive index profile. Both are expressed in the log-scale. The optical depth range is limited to (1μm, 9μm) to avoid simulation-based boundary artifacts.
To show that does indeed carry axial mean spatial frequency information, we also estimate the axial mean spatial frequency directly from the refractive index profile by performing a short-time Fourier transform (STFT) along ns(z′) after mapping it to the optical-space zopl(z′). The STFT window is chosen to be the same window W used to compute . The STFT window scans the refractive index profile at all those optical depth locations zopl(z) for which the phase profile was computed. At each optical depth zopl(z) the amplitude of the Fourier transform of the windowed refractive index profile centered at zopl(z) gives its axial spatial frequency distribution over the spatial frequency range defined by the spectral source baseband bandwidth. This distribution is used to calculate the STFT-based mean spatial frequency at that optical depth using the relation . Figure 15(b) plots the Fourier phase and STFT-based estimates of the axial mean spatial frequency of the refractive index profile in Fig. 15(a) as a function of optical depth. These mean spatial frequency profiles are plotted in the log-scale. The figure clearly shows that both approaches result in similar behavior, although Fourier phase in this example underestimates the mean spatial frequency.
G. Application: Fourier Phase-Based Depth-Resolved Characterization of Change in Optical Density
For the same refractive index profile as above, we now include a small local decrement (minimum Δn = −0.001) in the refractive index around optical depth zopl(z0) = 5.3 μm. Figure 16(a) illustrates the refractive index profiles with and without this decrement. The corresponding Fourier phase profiles ϕ(zopl(z)) are plotted in Fig. 16(b). They show that Fourier phase is able to provide a depth-resolved characterization of this decrement. As discussed in Section 6.E above, however, this characterization is the indirect effect of the local refractive index decrement on . We note that we have not computed ϕW(zopl(z)) because, first, the decrement occurs in a window smaller than the coherence gate, and second, it gives us an opportunity to illustrate the phase profile itself.
Fig. 16.
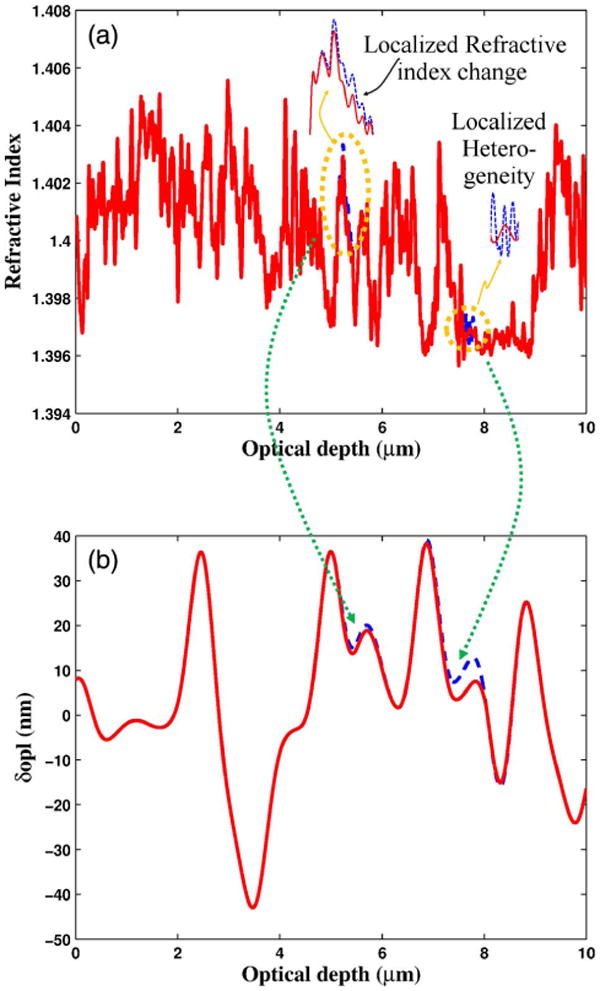
(a) Refractive index profile in optical-space with localized refractive index change and heterogeneity, respectively at optical depths zopl(z0) = 5.3 μm and zopl(z0) = 7.7 μm, and (b) corresponding depth-resolved changes in Fourier phase. Fourier phase is plotted in units of length.
H. Application: Fourier Phase-Based Depth-Resolved Characterization of Heterogeneity
Heterogeneity is a well-established statistical characteristic in many biological processes, such as cancer development. Here we indicate the presence of heterogeneity by considering two refractive index profiles with a localized difference in the rate of variation of the refractive index around the optical depth zopl(z0) = 7.7 μm. This localized heterogeneity is shown in Fig. 16(a), and the corresponding Fourier phase profiles are shown in Fig. 16(b). It can be seen that the phase value increases with an increase in heterogeneity.
In practice, it is difficult to separate local change (increment or decrement) in the refractive index from refractive index heterogeneity, and in a real scenario Fourier phase will manifest the combined effect of the two. This is only natural because they both affect the mean spatial frequency si(zopl(z)).
I. Doppler OCT in the Context of Fourier Phase
A different scenario arises when we consider, for example, blood flow through static tissue. Here, the flow of blood primarily affects the weighted-center within the coherence gate resulting in the subresolution offset δzopl(z) between it and the probing depth zopl(z). For a fixed probing depth zopl(z0), the phase difference ΔΦ between the Fourier phase at two adjacent A-scans, therefore, captures the net axial subresolution offset. If the time t between the two A-scans is known, the axial flow velocity is given by . Strictly speaking, this is the axial optical flow velocity. To estimate the axial flow velocity itself, v should be divided by the average refractive index of the sample.
7. CONCLUSION
Despite being enthusiastically received by the research community, the scope and physical meaning of Fourier phase within the framework of FD-OCT has not been fully studied. This paper is an attempt to fill that gap. We have shown that Fourier phase is a direct consequence of finite spectral bandwidth of the source that results in a loss of structural information into the quadrature component of the complex spectral interference. Phasor representation allowed us to reveal that Fourier phase is, in fact, able to access an estimate of this structural information. We showed that this joint estimate characterizes subresolution offset and mean spatial frequency of coherence-gated refractive index profile, and derived an analytical expression precisely showing how and why this is the case. We also showed that both dr-SLQPM and SDPM are special cases of this general theoretical framework of Fourier phase and look at complementary aspects of Fourier phase. The former focuses on measuring mean spatial frequency, while the latter measures subresolution offset. Both have the advantage associated with any derivative of FD-OCT that they quantify the coherence-gated depth-resolved structure of the sample without being confounded by its thickness as in transmission-mode QPM.
Based on the general framework of Fourier phase, we further showed that Fourier phase can be applied to estimate axial mean spatial frequency profile and characterize localized change in the refractive index and heterogeneity. These characterizations play an important role in early cancer detection and risk assessment [43]. Finally, we utilized the principle of Fourier phase to derive axial flow velocity in D-OCT.
Acknowledgments
Funding. National Cancer Institute (NCI) (R01CA185363); National Institute of Biomedical Imaging and Bioengineering (NIBIB) (R01EB016657).
APPENDIX A: SPECTRAL INTERFERENCE
Starting with Eq. (3), and noting that , we have
| (A1) |
implying a dilation of the source spectrum under the transformation from wave number to spatial frequency. We denote the source spectral density in the spatial frequency basis by . As this representation is purely notational, we redefine S(K) = S1K without any loss in generality or accuracy because dilation, though made implicit, is not ignored. Therefore, we rewrite Eq. (A1) as
| (A2) |
The OPL is a monotonically increasing function of physical depth for any given refractive index profile. This definition, expressed in Eq. (5), is used in Eq. (A2) to get
| (A3) |
| (A4) |
where the substitution follows from the Leibniz theorem. Equation (A4) states that when the integration is performed in the optical-space zopl(z′), the reflection profile is modified from r(z′), to . The normalization by the refractive index accounts for mapping of the reflection profile from the physical-space to optical-space. The mapping zopl(z′) from physical-space to optical space defines a homeomorphism between the two spaces that preserves the topological structure of the two spaces. As a result, the value of the modified reflection profile at z′ is the same as that at zopl(z′). Therefore, we denote the modified reflection profile at the optical depth zopl(z′) (corresponding to physical depth z′) by
| (A5) |
It is helpful to think of ropl(zopl(z′)) as a distribution acting on cos(2πKzopl(z′) through integration, because it allows the modeling of interfaces within the reflection profile that otherwise are difficult to handle mathematically. (See Section 4.B for an example.) This interpretation is feasible because cos(2πKzopl(z′)) is a smooth function with compact support over [0, zopl(L).
APPENDIX B: SIMPLIFYING SPECTRAL INTERFERENCE
Starting with generalized representation of the spectral interference
| (B1) |
and substituting Eq. (11) we get
| (B2) |
| (B3) |
APPENDIX C: FOURIER TRANSFORM OF THE SPECTRAL INTERFERENCE
Starting with Eq. (18),
| (C1) |
and substituting Eq. (17), we get
| (C2) |
Due to finite spectral-bandwidth, finite sample-depth, and real samples, Fubini’s theorem applies, allowing for the interchange of integrals. This, in conjunction with Euler representation of the cosine term, results in
| (C3) |
Rearranging Eq. (C3) allows us to express p(zopl(z)) as a sum of
| (C4) |
and
| (C5) |
1. Baseband Represenation of p1(zopl(z))
To simplify Eq. (C4), we rewrite it as
| (C6) |
| (C7) |
where Eq. (C6) employs the power series representation of the analytic exponential function , and Eq. (C7) decomposes the power series into its even and odd powers. Denoting them, respectively, by he(Kδzopl(z)) and ho(Kδzopl(z)), we write Eq. (C7) as
| (C8) |
The inner integrals are the Fourier transforms of S(K)he(Kδzopl(z)) and S(K)ho(Kδzopl(z)), evaluated at (zopl(z)−zopl(z′)). Considered together with the outer integrals, they reduce Eq. (C8) to a convolution between the reflection profile, the correlation function of the light source, and Fourier transforms of he(K δzopl(z)) and ho(K δzopl(z)). The transforms of latter, respectively, are
| (C9) |
| (C10) |
where the notation δ(ℓ) (zopl(z)) denotes the (ℓ)th derivative of the Dirac-delta, δ. The convolution of the outer integral then simplifies to
| (C11) |
where is the (2j)th derivative of the reflection profile, * indicates the convolution operation, and is the correlation function corresponding to the source spectrum centered at Kc. itself is its baseband representation. We assume that the source spectral range is [K1, K2] and its center frequency Kc is as defined in Section 2.B.
There is a second interpretation of Eq. (C11). To see it, we focus on the convolution operation in Eq. (C11),
| (C12) |
| (C13) |
| (C14) |
| (C15) |
where is the baseband representation of the (ℓ)th derivative of the reflection profile. As mentioned above, Γ(zopl(z)) is the baseband representation of Γ(zopl(z)) which is the correlation function corresponding to the source. Substituting Eq. (C15) in Eq. (C11), we get the final form of p1(zopl(z)) as
| (C16) |
which decomposes p1(zopl(z)) into its baseband representation (the term in the parentheses) and the carrier signal (the exponential before the parentheses) with carrier frequency Kc. The Fourier phase depends only on the baseband representation. Therefore, in the main text we exclusively use the baseband representation of p1(zopl(z)).
2. Baseband Representation of p2(zopl(z))
Following the same approach as above, p2(zopl(z)) simplifies to p2(zopl(z))
| (C17) |
where we have exploited the symmetry of the correlation function. The notations and denote the complex conjugation of and , respectively.
Summing Eqs. (C16) and (C17) gives us the Fourier transform p(zopl) of spectral interference P(K) as
| (C18) |
with ℜ and ℑ representing the real and imaginary parts of their respective arguments. We emphasize that in the main text the baseband representation of p(zopl(z)) is used. Also, the leading is dropped as p(zopl(z)) can be normalized by it.
APPENDIX D: SIMPLIFYING FOURIER PHASE REPRESENTATION AT A STRONG INTERFACE
We start by evaluating the first three convolutions in both the numerator and denominator of the Fourier phase expression in Eq. (30).
First convolution in the denominator of Eq. (30):
| (D1) |
| (D2) |
| (D3) |
First convolution in the numerator of Eq. (30):
| (D4) |
| (D5) |
| (D6) |
Second convolution in the denominator of Eq. (30):
| (D7) |
| (D8) |
| (D9) |
Second convolution in the numerator of Eq. (30):
| (D10) |
| (D11) |
| (D12) |
Third convolution in the denominator of Eq. (30):
| (D13) |
| (D14) |
| (D15) |
Third convolution in the numerator of Eq. (30):
| (D16) |
| (D17) |
| (D18) |
Substituting Eqs. (D3), (D6), (D9), (D12), (D15), and (D18) in Eq. (30), the Fourier phase becomes
| (D19) |
where Δℓ = (2πKcδzopl(z0))ℓ, ℓ ∈ ℤ+; and γℓ(0) = Γ(2ℓ)(0)(δzopl(z0))2ℓ, ℓ ∈ ℤ+. Again, the abbreviation H.O.T. stands for “higher-order terms” with respect to γ(0).
Footnotes
OCIS codes: (170.4500) Optical coherence tomography; (180.3170) Interference microscopy; (070.0070) Fourier optics and signal processing.
References
- 1.Born M, Wolf E. Principles of Optics. 7. Cambridge University; 1999. [Google Scholar]
- 2.Zernike F. Phase contrast, a new method for the microscopic observation of transparent objects. Physica. 1942;9:686–698. [Google Scholar]
- 3.Zernike F. Phase contrast, a new method for the microscopic observation of transparent objects part II. Physica. 1942;9:974–986. [Google Scholar]
- 4.Pluta M. Nomarski’s DIC microscopy: a review. Proc SPIE. 1994;1846:10–25. [Google Scholar]
- 5.Preza C, Snyder DL, Conchello J-A. Theoretical development and experimental evaluation of imaging models for differential-interference-contrast microscopy. J Opt Soc Am A. 1999;16:2185–2199. doi: 10.1364/josaa.16.002185. [DOI] [PubMed] [Google Scholar]
- 6.Creath K. Phase-shifting speckle interferometry. Appl Opt. 1985;24:3053–3058. doi: 10.1364/ao.24.003053. [DOI] [PubMed] [Google Scholar]
- 7.Cuche E, Bevilacqua F, Depeursinge C. Digital holography for quantitative phase-contrast imaging. Opt Lett. 1999;24:291–293. doi: 10.1364/ol.24.000291. [DOI] [PubMed] [Google Scholar]
- 8.Marquet P, Rappaz B, Magistretti PJ, Cuche E, Emery Y, Colomb T, Depeursinge C. Digital holographic microscopy: a noninvasive contrast imaging technique allowing quantitative visualization of living cells with subwavelength axial accuracy. Opt Lett. 2005;30:468–470. doi: 10.1364/ol.30.000468. [DOI] [PubMed] [Google Scholar]
- 9.Mann C, Yu L, Lo C-M, Kim M. High-resolution quantitative phase-contrast microscopy by digital holography. Opt Express. 2005;13:8693–8698. doi: 10.1364/opex.13.008693. [DOI] [PubMed] [Google Scholar]
- 10.Wang Z, Millet L, Mir M, Ding H, Unarunotai S, Rogers J, Gillette MU, Popescu G. Spatial light interference microscopy (SLIM) Opt Express. 2011;19:1016–1026. doi: 10.1364/OE.19.001016. [DOI] [PMC free article] [PubMed] [Google Scholar]
- 11.Paganin D, Nugent KA. Noninterferometric phase imaging with partially coherent light. Phys Rev Lett. 1998;80:2586–2589. [Google Scholar]
- 12.Waller L, Tian L, Barbastathis G. Transport of intensity phase-amplitude imaging with higher order intensity derivatives. Opt Express. 2010;18:12552–12561. doi: 10.1364/OE.18.012552. [DOI] [PubMed] [Google Scholar]
- 13.Dunn GA, Zicha D, Fraylich PE. Rapid, microtubule-dependent fluctuations of the cell margin. J Cell Sci. 1997;110:3091–3098. doi: 10.1242/jcs.110.24.3091. [DOI] [PubMed] [Google Scholar]
- 14.Zicha D, Genot E, Dunn GA, Kramer IM. TGFbeta1 induces a cell-cycle-dependent increase in motility of epithelial cells. J Cell Sci. 1999;112:447–454. doi: 10.1242/jcs.112.4.447. [DOI] [PubMed] [Google Scholar]
- 15.Popescu G. Quantitative Phase Imaging of Cells and Tissues. McGraw-Hill; 2011. [Google Scholar]
- 16.Creath K, Goldstein G. Dynamic quantitative phase imaging for biological objects using a pixelated phase mask. Biomed Opt Express. 2012;3:2866–2880. doi: 10.1364/BOE.3.002866. [DOI] [PMC free article] [PubMed] [Google Scholar]
- 17.Doblas A, Sánchez-Ortiga E, Martínez-Corral M, Saavedra G, Garcia-Sucerquia J. Accurate single-shot quantitative phase imaging of biological specimens with telecentric digital holographic microscopy. J Biomed Opt. 2014;19:046022. doi: 10.1117/1.JBO.19.4.046022. [DOI] [PubMed] [Google Scholar]
- 18.Klossa J, Wattelier B, Happillon T, Toubas LDLDominique, Untereiner V, Bon P, Manfait M. Quantitative phase imaging and Raman micro-spectroscopy applied to malaria. Diagn Pathol. 2013;8:S42. [Google Scholar]
- 19.Girshovitz P, Shaked NT. Doubling the field of view in off-axis low-coherence interferometric imaging. Light. 2014;3:e151. [Google Scholar]
- 20.Fercher A, Hitzenberger C, Kamp G, El-Zaiat S. Measurement of intraocular distances by backscattering spectral interferometry. Opt Commun. 1995;117:43–48. [Google Scholar]
- 21.Leitgeb R, Hitzenberger C, Fercher A. Performance of Fourier domain vs. time domain optical coherence tomography. Opt Express. 2003;11:889–894. doi: 10.1364/oe.11.000889. [DOI] [PubMed] [Google Scholar]
- 22.Leitgeb RA, Schmetterer L, Hitzenberger CK, Fercher AF, Berisha F, Wojtkowski M, Bajraszewski T. Real-time measurement of in vitro flow by Fourier-domain color Doppler optical coherence tomography. Opt Lett. 2004;29:171–173. doi: 10.1364/ol.29.000171. [DOI] [PubMed] [Google Scholar]
- 23.Choma MA, Ellerbee AK, Yang C, Creazzo TL, Izatt JA. Spectral-domain phase microscopy. Opt Lett. 2005;30:1162–1164. doi: 10.1364/ol.30.001162. [DOI] [PubMed] [Google Scholar]
- 24.Joo C, Akkin T, Cense B, Park BH, de Boer JF. Spectral-domain optical coherence phase microscopy for quantitative phase-contrast imaging. Opt Lett. 2005;30:2131–2133. doi: 10.1364/ol.30.002131. [DOI] [PubMed] [Google Scholar]
- 25.Leitgeb R, Schmetterer L, Drexler W, Fercher A, Zawadzki R, Bajraszewski T. Real-time assessment of retinal blood flow with ultrafast acquisition by color Doppler Fourier domain optical coherence tomography. Opt Express. 2003;11:3116–3121. doi: 10.1364/oe.11.003116. [DOI] [PubMed] [Google Scholar]
- 26.Wang L, Wang Y, Guo S, Zhang J, Bachman M, Li G, Chen Z. Frequency domain phase-resolved optical Doppler and Doppler variance tomography. Opt Commun. 2004;242:345–350. [Google Scholar]
- 27.Sarunic MV, Weinberg S, Izatt JA. Full-field swept-source phase microscopy. Opt Lett. 2006;31:1462–1464. doi: 10.1364/ol.31.001462. [DOI] [PubMed] [Google Scholar]
- 28.Choma MA, Ellerbee AK, Yazdanfar S, Izatt JA. Doppler flow imaging of cytoplasmic streaming using spectral domain phase microscopy. J Biomed Opt. 2006;11:024014. doi: 10.1117/1.2193167. [DOI] [PubMed] [Google Scholar]
- 29.Akkin T, Joo C, de Boer JF. Depth-resolved measurement of transient structural changes during action potential propagation. Biophys J. 2007;93:1347–1353. doi: 10.1529/biophysj.106.091298. [DOI] [PMC free article] [PubMed] [Google Scholar]
- 30.Adler DC, Huber R, Fujimoto JG. Phase-sensitive optical coherence tomography at up to 370,000 lines per second using buffered Fourier domain mode-locked lasers. Opt Lett. 2007;32:626–628. doi: 10.1364/ol.32.000626. [DOI] [PubMed] [Google Scholar]
- 31.Joo C, Kim KH, de Boer JF. Spectral-domain optical coherence phase and multiphoton microscopy. Opt Lett. 2007;32:623–625. doi: 10.1364/ol.32.000623. [DOI] [PubMed] [Google Scholar]
- 32.McDowell EJ, Ellerbee AK, Choma MA, Applegate BE, Izatt JA. Spectral domain phase microscopy for local measurements of cytoskeletal rheology in single cells. J Biomed Opt. 2007;12:044008. doi: 10.1117/1.2753755. [DOI] [PubMed] [Google Scholar]
- 33.Adler DC, Huang S-W, Huber R, Fujimoto JG. Photothermal detection of gold nanoparticles using phase-sensitive optical coherence tomography. Opt Express. 2008;16:4376–4393. doi: 10.1364/oe.16.004376. [DOI] [PubMed] [Google Scholar]
- 34.Akkin T, Landowne D, Sivaprakasam A. Optical coherence tomography phase measurement of transient changes in squid giant axons during activity. J Membr Biol. 2009;231:35–46. doi: 10.1007/s00232-009-9202-4. [DOI] [PubMed] [Google Scholar]
- 35.Wang RK, Nuttall AL. Phase-sensitive optical coherence tomography imaging of the tissue motion within the organ of Corti at a subnanometer scale: a preliminary study. J Biomed Opt. 2010;15:056005. doi: 10.1117/1.3486543. [DOI] [PMC free article] [PubMed] [Google Scholar]
- 36.Zotter S, Pircher M, Torzicky T, Bonesi M, Götzinger E, Leitgeb RA, Hitzenberger CK. Visualization of microvasculature by dual-beam phase-resolved Doppler optical coherence tomography. Opt Express. 2011;19:1217–1227. doi: 10.1364/OE.19.001217. [DOI] [PMC free article] [PubMed] [Google Scholar]
- 37.Pai JH, Liu T, Hsu HY, Wedding AB, Thierry B, Bagnaninchi PO. Molecular photo-thermal optical coherence phase microscopy using gold nanorods. J Biomed Opt. 2014;4:27067–27073. [Google Scholar]
- 38.Gao SS, Wang R, Raphael PD, Moayedi Y, Groves AK, Zuo J, Applegate BE, Oghalai JS. Vibration of the organ of Corti within the cochlear apex in mice. J Neurophysiol. 2014;112:1192–1204. doi: 10.1152/jn.00306.2014. [DOI] [PMC free article] [PubMed] [Google Scholar]
- 39.Tsai MT, Chang FY, Yao YC, Mei J, Lee YJ. Optical inspection of solar cells using phase-sensitive optical coherence tomography. Sol Energy Mater Sol Cells. 2015;136:193–199. [Google Scholar]
- 40.Kim DY, Fingler J, Werner JS, Schwartz DM, Fraser SE, Zawadzki RJ. In vivo volumetric imaging of human retinal circulation with phase-variance optical coherence tomography. Biomed Opt Express. 2011;2:1504–1513. doi: 10.1364/BOE.2.001504. [DOI] [PMC free article] [PubMed] [Google Scholar]
- 41.Yin B, Kuranov RV, McElroy AB, McElroy AB, Kazmi S, Dunn AK, Duong TQ, Milner TE. Dual-wavelength photothermal optical coherence tomography for imaging microvasculature blood oxygen saturation. J Biomed Opt. 2013;18:056005. doi: 10.1117/1.JBO.18.5.056005. [DOI] [PMC free article] [PubMed] [Google Scholar]
- 42.Uttam S, Bista RK, Staton K, Alexandrov S, Choi S, Bakkenist CJ, Hartman DJ, Brand RE, Liu Y. Investigation of depth-resolved nanoscale structural changes in regulated cell proliferation and chromatin decondensation. Biomed Opt Express. 2013;4:596–613. doi: 10.1364/BOE.4.000596. [DOI] [PMC free article] [PubMed] [Google Scholar]
- 43.Uttam S, Pham HV, LaFace J, Leibowitz B, Yu J, Brand RE, Hartman DJ, Liu Y. Early prediction of cancer progression by depth-resolved nanoscale maps of nuclear architecture from unstained tissue specimens. Cancer Res. doi: 10.1158/0008-5472.CAN-15-1274. to be published. [DOI] [PMC free article] [PubMed] [Google Scholar]
- 44.Leitgeb RA, Werkmeister RM, Blatter C, Schmetterer L. Doppler optical coherence tomography. Prog Retinal Eye Res. 2014;41:26–43. doi: 10.1016/j.preteyeres.2014.03.004. [DOI] [PMC free article] [PubMed] [Google Scholar]
- 45.Fercher A, Hitzenberger C, Sticker M, Moreno-Barriuso E, Leitgeb R, Drexler W, Sattmann H. A thermal light source technique for optical coherence tomography. Opt Commun. 2000;185:57–64. [Google Scholar]
- 46.Brezinski ME. Optical Coherence Tomography: Principles and Applications. Academic; 2006. [Google Scholar]
- 47.Sheppard C, Connolly T, Gu M. The scattering potential for imaging in the reflection geometry. Opt Commun. 1995;117:16–19. [Google Scholar]
- 48.Sheppard CJR, Connolly TJ, Lee J, Cogswell CJ. Confocal imaging of a stratified medium. Appl Opt. 1994;33:631–640. doi: 10.1364/AO.33.000631. [DOI] [PubMed] [Google Scholar]
- 49.Uttam S, Alexandrov SA, Bista RK, Liu Y. Tomographic imaging via spectral encoding of spatial frequency. Opt Express. 2013;21:7488–7504. doi: 10.1364/OE.21.007488. [DOI] [PMC free article] [PubMed] [Google Scholar]
- 50.Wolf E. Three-dimensional structure determination of semitransparent objects from holographic data. Opt Commun. 1969;1:153–156. [Google Scholar]
- 51.Yaqoob Z, Choi W, Oh S, Lue N, Park Y, Fang-Yen C, Dasari RR, Badizadegan K, Feld MS. Improved phase sensitivity in spectral domain phase microscopy using line-field illumination and self phase-referencing. Opt Express. 2009;17:10681–10687. doi: 10.1364/oe.17.010681. [DOI] [PMC free article] [PubMed] [Google Scholar]
- 52.Sheppard CJR, Cogswell CJ. Three-dimensional image formation in confocal microscopy. J Microsc. 1990;159:179–194. [Google Scholar]
- 53.Saleh BAE, Teich MC. Fundamentals of Photonics. Wiley; 2007. [Google Scholar]


