

Abstract
Context
Clinicians and athletes can benefit from field-expedient measurement tools, such as urine color, to assess hydration state; however, the diagnostic efficacy of this tool has not been established.
Objective
To determine the diagnostic accuracy of urine color assessment to distinguish a hypohydrated state (≥2% body mass loss [BML]) from a euhydrated state (<2% BML) after exercise in a hot environment.
Design
Controlled laboratory study.
Setting
Environmental chamber in a laboratory.
Patients or Other Participants
Twenty-two healthy men (age = 22 ± 3 years, height = 180.4 ± 8.7 cm, mass = 77.9 ± 12.8 kg, body fat = 10.6% ± 4.6%).
Intervention(s)
Participants cycled at 68% ± 6% of their maximal heart rates in a hot environment (36°C ± 1°C) for 5 hours or until 5% BML was achieved. At the point of each 1% BML, we assessed urine color.
Main Outcome Measure(s)
Diagnostic efficacy of urine color was assessed using receiver operating characteristic curve analysis, sensitivity, specificity, and likelihood ratios.
Results
Urine color was useful as a diagnostic tool to identify hypohydration after exercise in the heat (area under the curve = 0.951, standard error = 0.022; P < .001). A urine color of 5 or greater identified BML ≥2% with 88.9% sensitivity and 84.8% specificity (positive likelihood ratio = 5.87, negative likelihood ratio = 0.13).
Conclusions
Under the conditions of acute dehydration due to exercise in a hot environment, urine color assessment can be a valid, practical, inexpensive tool for assessing hydration status. Researchers should examine the utility of urine color to identify a hypohydrated state under different BML conditions.
Key Words: diagnostic accuracy, hydration, field measurement, sensitivity, specificity
Key Points
Urine color can be a useful diagnostic tool to assess a hypohydrated state after athletes exercise in the heat.
Urine color ≥5 indicated a body mass loss ≥2% with 88.9% sensitivity and 84.8% specificity.
Athletic trainers can use this test to guide diagnosis and treatment when baseline body mass is unavailable or when an athlete presents with symptoms of dehydration after activity.
Monitoring an athlete's hydration status can be important for maximizing performance1−6 and can provide valuable information for the differential diagnosis of illness (eg, exertional heat illnesses).7 Most data support performance deficits at body mass losses (BMLs) >2% in endurance exercise.6 In addition, this same magnitude of BML can affect physiologic function and increase the risk of exertional heat illness.7 Therefore, the ability of clinicians to accurately identify BML due to water loss can guide hydration strategies for optimal performance and facilitate differential diagnosis and treatment plans.
Whereas no criterion standard for hydration assessment exists,8,9 researchers10−13 have recently investigated potential tools to identify a hypohydrated state, operationally defined as >2% or 3% BML (eg, hypertonic hypovolemia with BML serving as the criterion standard for comparison), after physical activity. Muñoz et al13 demonstrated that the means of dehydration (ie, active versus passive water loss) should be considered when choosing an appropriate biomarker. For dehydration due to physical activity (active water loss), saliva and serum osmolality measures appear most responsive13; however, athletic trainers often do not have the equipment or capabilities to directly measure osmolality in clinical settings. Given the need of athletic trainers for a field-expedient measurement tool to monitor hydration status, urine specific gravity and color provide 2 viable options in most clinical settings.8
Researchers have evaluated the diagnostic utility of urine specific gravity. Cheuvront et al11 identified a urine specific gravity of ≥1.025, and Muñoz et al13 reported a criterion value of 1.020 as best identifying a BML of ≥2%. Although measurement of urine specific gravity provides diagnostic value, it still requires the use of equipment, which may not be available or practical in the field setting. Urine color can provide athletic trainers with a measure of hydration status in the absence of equipment; however, little evidence exists for its diagnostic utility. Therefore, the purpose of our study was to evaluate the diagnostic accuracy of urine color to identify a BML ≥2% after physical activity in the heat.
METHODS
Participants
Twenty-two healthy, recreationally active men (age = 22 ± 3 years, height = 180.4 ± 8.7 cm, mass = 77.9 ± 12.8 kg, body fat = 10.6% ± 4.6%) participated in this study. Volunteers who had a history of exercise heat intolerance, took medications that altered fluid or electrolyte balance, used tobacco products, or had a metabolic disorder were excluded from participation. All participants provided written informed consent, and the study was approved by the University of Connecticut–Storrs Institutional Review Board.
Protocol
As part of a larger laboratory study,13 participants completed a dehydration trial to elicit acute hypertonic hypovolemia via cycling exercise in the heat. In this investigation, we examined the diagnostic utility of urine color to identify BML ≥2% in acute hypertonic hypovolemia resulting from exercise in the heat.
Participants reported to the laboratory for a familiarization visit during which the research staff assessed height using a wall-mounted measuring tape, mass (Health-O-Meter model 349KLX; Pelstar LLC, Bridgeview, IL), and body fat percentage via 3-site skinfold measurement (Lange Skinfold Calliper; Beta Technology Inc, Houston, TX). We also introduced participants to the dehydration protocol they would complete. For the next 3 days, participants recorded the food and fluid they consumed to establish their habitual intake.
On the day before testing, participants were instructed to replicate their diets for macronutrient composition and to consume a fluid volume equal to their habitual intakes (the average of the 3-day diet record). On the morning of the dehydration trial, participants consumed 125 mL of water every 30 minutes for 2 hours beginning 3 hours before testing to ensure euhydration and to avoid the effects of a large bolus of water.14 Participants were provided with a standard breakfast (1 banana, 1 bagel, 1 tablespoon of cream cheese or peanut butter, and 150 mL of water).
Participants provided urine samples, emptied their bladders, and entered the environmental chamber. We recorded environmental conditions every 60 minutes and maintained the temperature of 36°C ± 1°C and relative humidity at 48% ± 3%. We monitored rectal temperature (YSI 401 rectal probe; Yellow Spring, OH) and heart rate via telemetry (Polar Electro Inc, Kempele, Finland) during heat exposure. Participants completed a 5-hour exercise protocol with an exercise-to-rest ratio of 25 : 5 minutes at a self-selected moderate intensity. During each 5-minute rest, the research staff measured body mass after participants were towel dried and removed their shoes. Sweat rate was calculated continuously to allow prediction of each 1% BML. We instructed participants to provide urine samples at the point of each 1% BML, even if this occurred during the 25-minute exercise period. The volume of each void was measured to correct BML. We evaluated urine color in a well-lit room by holding the samples against a white background and rating them as whole numbers after comparison against a previously published scale (scale colors ranging from 1 [lightest] to 8 [darkest]).15,16
Statistical Analysis
Descriptive statistics are presented as means ± standard deviations. We assessed the diagnostic utility of urine color with receiver operating characteristic (ROC) curve analysis to determine the criterion value that distinguished a hypohydrated state from a euhydrated state. For a more conservative analysis of the area under the curve (AUC), correction for repeated measures was not made.17 For the purpose of this assessment, we operationally defined a hypohydrated state as BML ≥2% and a euhydrated state as BML <2% because of the physiologic and performance decrements associated with this previously established cutoff.6 The criterion value of urine color was chosen from the value with the best combination of sensitivity and specificity, with both values greater than 80%. Based on this criterion value, we calculated positive and negative likelihood ratios and the diagnostic odds ratio. We also calculated 95% confidence intervals for sensitivity and specificity,18 positive and negative likelihood ratios,19 and the diagnostic odds ratio.20 The α level was set a priori at .05. Data were analyzed using SPSS statistical software (version 21; IBM Corporation, Armonk, NY).
RESULTS
After completing the 5-hour exercise protocol, participants had degrees of BML that ranged from 2% to 5% (6 participants had 5% BML; 9, 4% BML; 6, 3% BML; and 1, 2% BML). They had 108 opportunities to produce urine samples for analysis because we stopped them from exercising at the point of each 1% BML. However, given that this dehydration protocol occurred over only 5 hours, not all participants could produce a urine sample each time they were instructed to do so, resulting in 69 urine samples produced for analysis during the dehydration trial. Thirty-three urine samples were produced in the absence of the condition (when BML was <2%), and 36 samples were produced in the presence of the condition (when BML was ≥2%).
Receiver operating characteristic curve analysis revealed that a urine color of 4.5 or greater identified a hypohydrated state due to acute hypertonic hypovolemia via exercise in the heat with 88.9% (32 of 36) sensitivity and 84.8% (28 of 33) specificity (AUC = 0.951, standard error = 0.022; P < .001; Figure), yielding an overall diagnostic accuracy of 87% (60 of 69; Table 1) and diagnostic odds ratio of 44.8. This criterion value resulted in a positive likelihood ratio of 5.87 and a negative likelihood ratio of 0.13. The diagnostic statistics associated with the multiple urine color cutoff points are presented in Table 2.
Figure.
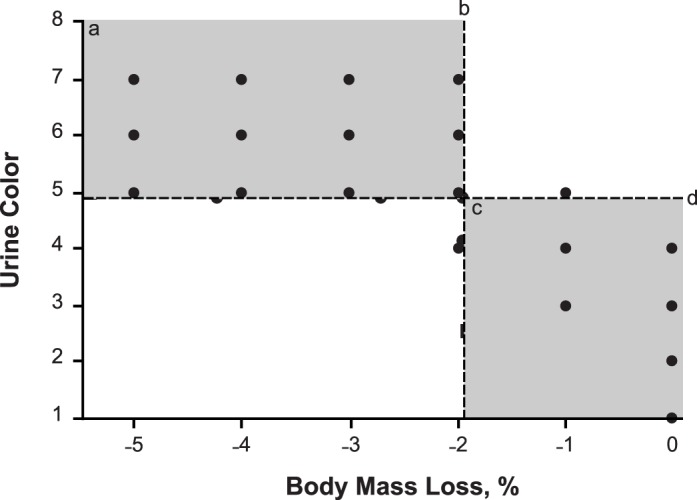
Relationship between urine color test outcome and percentage of body mass loss (BML). a The shaded area denotes true positive results. b The vertical line denotes the division between a hypohydrated state (≥2% BML) and a euhydrated state (<2% BML). c The shaded area denotes true negative results. d The horizontal line denotes the receiver operating characteristic curve analysis-specified criterion value for detecting ≥2% BML.
Table 1. .
Urine Color Diagnostic Accuracy Contingency Table
| Urine Color Test Outcome (Score Range) |
Condition, No. |
|
| ≥2% Body Mass Loss |
<2% Body Mass Loss |
|
| Positive (5−8) |
32 True positive |
5 False positive |
| Negative (1−4) | 4 False negative | 28 True negative |
Table 2. .
Summary of Urine Color Diagnostic Statistics for Detecting Body Mass Loss ≥2%
| Urine Color Criterion Value |
Sensitivity, % (95% CI) |
Specificity, % (95% CI) |
Positive Likelihood Ratio (95% CI) |
Negative Likelihood Ratio (95% CI) |
Diagnostic Odds Ratio (95% CI) |
| 4 | 100.0 (90.4, 100.0) | 60.6 (43.7, 75.3) | 2.54 (1.66, 3.88) | Incalculable | Incalculable |
| 5 | 88.9 (74.7, 95.6) | 84.8 (69.1, 93.4) | 5.87 (2.60, 13.26) | 0.13 (0.05, 0.33) | 44.8 (10.9, 183.4) |
| 6 | 63.9 (47.6, 77.5) | 100.0 (89.6, 100.0) | Incalculable | 0.36 (0.23, 0.56) | Incalculable |
Abbreviation: CI, confidence interval.
DISCUSSION
Body mass loss >2% has often been associated with performance deficits in endurance training6 and with clinical signs and symptoms of dehydration, such as headache, dizziness, nausea, lightheadedness, or fatigue.21,22 Therefore, the ability of an athletic trainer to identify BML of this magnitude is essential to both clinical diagnosis and athlete performance. Furthermore, the ability to identify the extent of BML allows an athletic trainer to intervene to reduce further water deficits. Therefore, the purpose of our investigation was to evaluate the diagnostic accuracy of using urine color, an inexpensive and expedient measure of hydration status, to identify BML ≥2% in the context of acute, active water loss.
We demonstrated that urine color can be a useful diagnostic tool to assess a hypohydrated state after exercise in the heat. A urine color ≥5 indicated BML ≥2% with 88.9% sensitivity and 84.8% specificity. An athlete presenting with a urine color of 5 on the urine color chart was nearly 6 times more likely to be hypohydrated (ie, BML ≥2%) than euhydrated. This tool is especially useful for field assessment when no equipment (eg, refractometer or osmometer) or baseline measurement (eg, body mass) is available.
Researchers have described euhydrated individuals as demonstrating urine colors that are <415 and ≤5.11,23,24 During our investigation, a mean urine color of 3 ± 1 denoted euhydrated samples, whereas a mean urine color of 6 ± 1 denoted hypohydrated samples; these observations align with previous speculations about diagnostic criteria. Cheuvront et al11 also used ROC curve analysis to determine a criterion value for recognizing BML ≥2% and reported that a urine color ≥6 offered the best combination of sensitivity (81%) and specificity (97%) with an AUC of 0.96. Our data identified a cutoff point of ≥5 to determine the same BML with slightly greater sensitivity, slightly less specificity, and a similar AUC. When the cutoff point of ≥5 is applied to their data,11 sensitivity of 92% and specificity of 83% can be calculated and are similar to the 88.9% and 84.8%, respectively, that we observed. A cutoff point of ≥6 in our investigation offered 100% specificity (no false-positive results were identified) but only 63.9% sensitivity (Table 2). Combining our findings with those of Cheuvront et al11 indicates a clinician can be confident that a urine color of ≥6 after physical activity indicates at least 2% BML. Given the positive likelihood ratio, we can conclude that a person with a urine color ≥5 is nearly 6 times more likely to have sustained a BML ≥2% than a person with a urine color ≤4.
With 87% diagnostic accuracy, urine color is an acceptable means of identifying BML ≥2% after physical activity to aid clinical decision making. Athletic trainers often use body mass change or urine specific gravity to assess fluid loss, but urine color has advantages over these 2 measurements. Determining body mass change requires knowledge of a baseline or preexercise body mass from which to calculate body water loss. If the baseline body mass measurement is unknown, fluid loss by mass cannot be determined. In these cases, urine specific gravity or urine color can be used. Urine specific gravity offers excellent diagnostic accuracy for identifying BML ≥2% with cutoff points of 1.02013 and 1.025.11 However, urine specific gravity is more expensive, requires consumable supplies, takes longer to perform, and has a smaller AUC during ROC curve analysis than urine color. Therefore, urine color provides excellent diagnostic accuracy and value to the athletic trainer for assessing hydration status after physical activity when a baseline measurement is unavailable.
However, this study had limitations. We assessed urine color in a controlled laboratory setting rather than the field and assessed it only in the context of acute, active body water loss due to exercise in the heat. Therefore, researchers might explore these limitations and other applications for the use of urine color, such as the ability to rule out conditions with similar clinical presentations (ie, hyponatremia) or its utility after other means of dehydration (ie, passive fluid loss, diarrhea, or vomiting).
CONCLUSIONS
In their clinical practice, athletic trainers may include the use of urine color for recognizing BML ≥2% after physical activity. Urine color ≥5 demonstrated a BML ≥2% with great accuracy. Athletic trainers may use this test to guide diagnosis and treatment when a baseline body mass is unavailable or when an athlete presents with symptoms of dehydration after activity.
REFERENCES
- 1.Casa DJ, Stearns RL, Lopez RM, et al. Influence of hydration on physiological function and performance during trail running in the heat. J Athl Train. 2010;45(2):147–156. doi: 10.4085/1062-6050-45.2.147. [DOI] [PMC free article] [PubMed] [Google Scholar]
- 2.Judelson DA, Maresh CM, Farrell MJ, et al. Effect of hydration state on strength, power, and resistance exercise performance. Med Sci Sports Exerc. 2007;39(10):1817–1824. doi: 10.1249/mss.0b013e3180de5f22. [DOI] [PubMed] [Google Scholar]
- 3.Judelson DA, Maresh CM, Anderson JM, et al. Hydration and muscular performance: does fluid balance affect strength, power and high-intensity endurance? Sports Med. 2007;37(10):907–921. doi: 10.2165/00007256-200737100-00006. [DOI] [PubMed] [Google Scholar]
- 4.Maughan RJ. Impact of mild dehydration on wellness and on exercise performance. Eur J Clin Nutr. 2003;57(suppl 2):S19–S23. doi: 10.1038/sj.ejcn.1601897. [DOI] [PubMed] [Google Scholar]
- 5.Cheuvront SN, Carter R, Castellani JW, Sawka MN. Hypohydration impairs endurance exercise performance in temperate but not cold air. J Appl Physiol (1985) 2005;99(5):1972–1976. doi: 10.1152/japplphysiol.00329.2005. [DOI] [PubMed] [Google Scholar]
- 6.Cheuvront SN, Carter R, Sawka MN. Fluid balance and endurance exercise performance. Curr Sports Med Rep. 2003;2(4):202–208. doi: 10.1249/00149619-200308000-00006. [DOI] [PubMed] [Google Scholar]
- 7.Binkley HM, Beckett J, Casa DJ, Kleiner DM, Plummer PE. National Athletic Trainers' Association position statement: exertional heat illnesses. J Athl Train. 2002;37(3):329–343. [PMC free article] [PubMed] [Google Scholar]
- 8.Armstrong LE. Assessing hydration status: the elusive gold standard. J Am Coll Nutr. 2007;26(suppl 5):S575–S584. doi: 10.1080/07315724.2007.10719661. [DOI] [PubMed] [Google Scholar]
- 9.Kavouras SA. Assessing hydration status. Curr Opin Clin Nutr Metab Care. 2002;5(5):519–524. doi: 10.1097/00075197-200209000-00010. [DOI] [PubMed] [Google Scholar]
- 10.Bartok C, Schoeller DA, Sullivan JC, Clark RR, Landry GL. Hydration testing in collegiate wrestlers undergoing hypertonic dehydration. Med Sci Sports Exerc. 2004;36(3):510–517. doi: 10.1249/01.mss.0000117164.25986.f6. [DOI] [PubMed] [Google Scholar]
- 11.Cheuvront SN, Ely BR, Kenefick RW, Sawka MN. Biological variation and diagnostic accuracy of dehydration assessment markers. Am J Clin Nutr. 2010;92(3):565–573. doi: 10.3945/ajcn.2010.29490. [DOI] [PubMed] [Google Scholar]
- 12.Taylor NA, van den Heuvel AM, Kerry P, et al. Observations on saliva osmolality during progressive dehydration and partial rehydration. Eur J Appl Physiol. 2012;112(9):3227–3237. doi: 10.1007/s00421-011-2299-z. [DOI] [PubMed] [Google Scholar]
- 13.Muñoz CX, Johnson EC, DeMartini JK, et al. Assessment of hydration biomarkers including salivary osmolality during passive and active dehydration. Eur J Clin Nutr. 2013;67(12):1257–1263. doi: 10.1038/ejcn.2013.195. [DOI] [PubMed] [Google Scholar]
- 14.Sollanek KJ, Kenefick RW, Cheuvront SN, Axtell RS. Potential impact of a 500-mL water bolus and body mass on plasma osmolality dilution. Eur J Appl Physiol. 2011;111(9):1999–2004. doi: 10.1007/s00421-011-1833-3. [DOI] [PubMed] [Google Scholar]
- 15.Armstrong LE, Maresh CM, Castellani JW, et al. Urinary indices of hydration status. Int J Sport Nutr. 1994;4(3):265–279. doi: 10.1123/ijsn.4.3.265. [DOI] [PubMed] [Google Scholar]
- 16.Armstrong LE, Soto JA, Hacker FT, Casa DJ, Kavouras SA, Maresh CM. Urinary indices during dehydration, exercise, and rehydration. Int J Sport Nutr. 1998;8(4):345–355. doi: 10.1123/ijsn.8.4.345. [DOI] [PubMed] [Google Scholar]
- 17.Liu H, Wu T. Estimating the area under a receiver operating characteristic curve for repeated measures design. J Stat Software. 2003;8(12):1–18. [Google Scholar]
- 18.Newcombe RG. Two-sided confidence intervals for the single proportion: comparison of seven methods. Stat Med. 1998;17(8):857–872. doi: 10.1002/(sici)1097-0258(19980430)17:8<857::aid-sim777>3.0.co;2-e. [DOI] [PubMed] [Google Scholar]
- 19.Simel DL, Samsa GP, Matchar DB. Likelihood ratios with confidence: sample size estimation for diagnostic test studies. J Clin Epidemiol. 1991;44(8):763–770. doi: 10.1016/0895-4356(91)90128-v. [DOI] [PubMed] [Google Scholar]
- 20.Armitage P, Berry G. Statistical Methods in Medical Research. 3rd ed. Boston, MA: Blackwell Scientific Publications;; 1994. p. 673. [Google Scholar]
- 21.Sawka MN, Burke LM, Eichner ER, Maughan RJ, Montain SJ, Stachenfeld NS. American College of Sports Medicine position stand: exercise and fluid replacement. Med Sci Sports Exerc. 2007;39(2):377–390. doi: 10.1249/mss.0b013e31802ca597. [DOI] [PubMed] [Google Scholar]
- 22.Casa DJ, Armstrong LE, Hillman SK, et al. National Athletic Trainers' Association position statement: fluid replacement for athletes. J Athl Train. 2000;35(2):212–224. [PMC free article] [PubMed] [Google Scholar]
- 23.Armstrong LE, Pumerantz AC, Fiala KA, et al. Human hydration indices: acute and longitudinal reference values. Int J Sport Nutr Exerc Metab. 2010;20(2):145–153. doi: 10.1123/ijsnem.20.2.145. [DOI] [PubMed] [Google Scholar]
- 24.Armstrong LE, Johnson EC, Muñoz CX, et al. Hydration biomarkers and dietary fluid consumption of women. J Acad Nutr Diet. 2012;112(7):1056–1061. doi: 10.1016/j.jand.2012.03.036. [DOI] [PubMed] [Google Scholar]