Abstract
We present an automatic segmentation method for the delineation and quantitative thickness measurement of multiple layers in endoscopic airway optical coherence tomography (OCT) images. The boundaries of the mucosa and the sub-mucosa layers are accurately extracted using a graph-theory-based dynamic programming algorithm. The algorithm was tested with sheep airway OCT images. Quantitative thicknesses of the mucosal layers are obtained automatically for smoke inhalation injury experiments.
OCIS codes: (100.0100) Image processing, (110.4500) Optical coherence tomography, (170.2150) Endoscopic imaging
1. Introduction
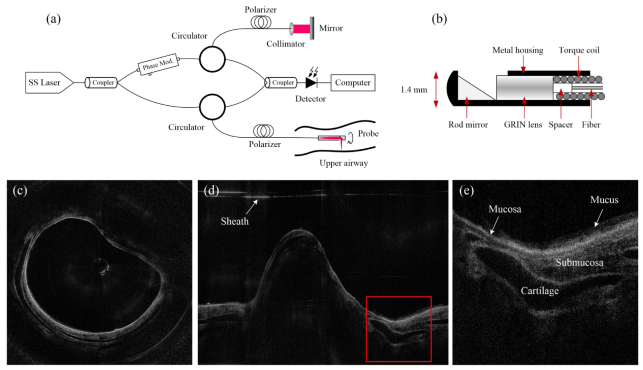
Imaging the sub-surface structure of the airway wall has great significance for detecting abnormalities during airway injuries. Smoke exposure and inhalation risks, including thermal, toxic, and chemical injuries, result in airway hyperemia, edema, sloughing and necrosis [1, 2]. Pathophysiological information of the injured airway wall, such as the thickness of the mucosal, the gathering of mucus, and the deformation of the airway lumen, could provide better diagnosis of respiratory decrease [3–5]. As a nonionizing, non-invasive medical imaging modality, optical coherence tomography (OCT) has been used to perform high resolution, cross-sectional imaging of biological tissues. Previous studies [6–11] have demonstrated the flexibility of OCT to image the airways of different animals in vivo. Among them, the Fourier domain long-range swept source OCT (LR-SSOCT) exhibits higher sensitivity, faster imaging speed and an extended imaging range compared to conventional OCT systems. Figure 1(a) shows the schematic diagram of the LR-SSOCT. The wavelength-sweeping laser is split by a coupler into the sample and reference arms. Light comes back from both arms to another coupler, and the interference signal is then picked up by a photo-sensitive detector. A phase modulator (electro-optic or acousto-optic), which provides a frequency shift in the interferometer signal, enables an extended imaging range by preventing the superposition of the positive and negative terms [12]. The sampling of the LR-SSOCT is performed by a miniature endoscopic OCT probe that can simultaneously rotate and be pulled back. As shown in the schematic drawing in Fig. 1(b), the probe is constructed by carefully aligning and splicing a 45-deg rod mirror, a GRIN lens, a spacer and a single-mode fiber within a metal housing. The length of the spacer (a portion of no core fiber) determines the working distance of the probe. The metal housing is firmly soldered to a stainless torque coil which translates the torque from the proximal end of the probe to the distal end of the probe. Two-dimensional (2-D) cross-sectional images are reconstructed from the interference signals for each rotational period. Figure 1(c) and 1(d) show the circumferential and Cartesian OCT images of one cross-section in the sheep airway, respectively. These sample images were acquired by our recently reported improved LR-SSOCT system [10, 11] that can achieve an extended imaging range of 25 mm and a resolution of 10 μm in tissue. The system utilized a 1310-nm swept laser source with 50 kHz A-line rates. The imaging probe has an outer diameter of 1.47mm and rotates at 1500 rpm to achieve 25 frames/s (2000 A-lines per frame). Figure 1(e) displays the enlarged detail of the red box in Fig. 1(d). The structure of the airway wall, including the cartilage, the mucosa, the submucosa, and the mucus, are depicted clearly.
Fig. 1.
(a) The LR-SSOCT setup; (b) the structure of the imaging probe for airway imaging; (c) a sample image in circumferential coordinate system; (d) Cartesian coordinate image of (c); (e) the enlarged detail of the red box in (d).
The identification of different structures in the OCT images are of great importance for quantitative evaluation of airway injury. However, although we have already obtained high resolution airway wall OCT images, the classification of the airway wall structures are based on manual labeling of the boundaries [13], which is time-consuming and subject to observer errors. A clustering algorithm is used to segment the airway structure from the background [14], but the airway layers are not detected. A morphological and thresholding method is used to identify these layers [15]; however, their method is not robust enough to handle speckle noise and missing features in quality degraded images. No other method has been reported on the auto-segmentation of airway wall structures on OCT images other than these two.
In order to robustly segment different airway wall structures and provide quantitative information of these structures automatically, we present a graph theory based segmentation algorithm using Cartesian airway OCT images as input. This algorithm works in two steps, the pre-processing step, which localizes the potential airway wall regions, and the edge delineation step, which detects the exact locations of three edges specifying the airway lumen, the mucosa/submucosa boundary, and the submucosa/cartilage boundary respectively. The quantification of the average layer thicknesses can be obtained afterward. This algorithm was tested in the sheep and pig airway images acquired by our LR-SSOCT system [11]. The results show that our algorithm can achieve accurate, robust, and fully automatic delineation of multiple structures in airway OCT images.
2. Method
The whole algorithm workflow is shown in Fig. 2. To start with, the purpose of the pre-processing step is to distinguish the entire airway structure from the background. It is mainly comprised of denoising and binarization of the original input images, and then identifying the prominent OCT airway regions. After the pre-processing step, an edge detection process where the actual airway lumen, the edge between the mucosa and submucosa, and the boundary of the airway structure are localized using a dynamic programming based approach. Finally, the thickness measurement process is carried out on the segmented airway regions where the laser beam has an orthogonal incident angle.
Fig. 2.
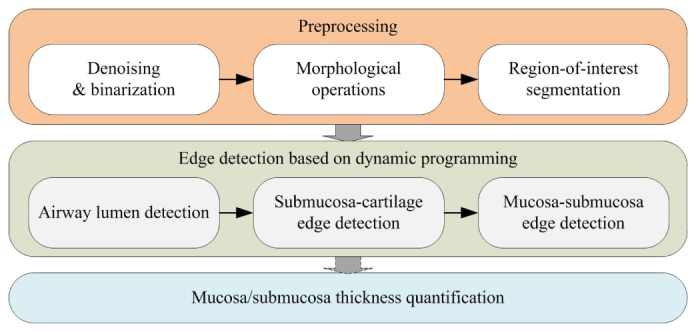
The workflow of the proposed automatic detection algorithm.
2.1 Pre-processing
To achieve automatic airway wall segmentation, the first step should be to identify the entire airway structure in the given OCT image. This means that the airway region should be distinguished from the background for further processing. However, the OCT images are generally distorted by multiple defects. These defects include: speckle noise inherited from laser imaging [16, 17]; mirror image/objects induced by Fourier transformation [18]; and ghost objects produced by internal interference of the optics. Also, since the imaging probe is protected from the tissue by a plastic sheath, this sheath needs to be distinguished from the airway structure. As can be seen in the sample input image in Fig. 3(c), although the airway structure seems prominent by human judgment, it is still challenging for the computer to precisely identify the tissue since the aforementioned noise is also obvious.
Fig. 3.
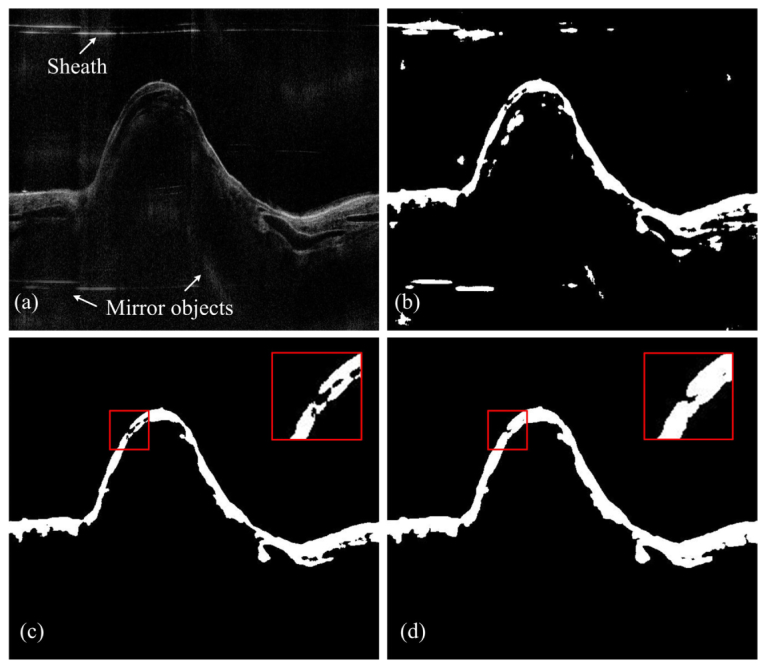
The pre-processing step: (a) original input image where the sheath, speckle noise, and mirror objects are seen; (b) the binaried black and white image; (c) the first morphological operation: picking out major components; (d) the second morphological operation: bridging and enlarging the potential airway wall regions.
To address these problems, we applied a series of low-level operations on the OCT input images to produce classified airway regions. These operations include:
-
1)
Speckle noise suppression: median filtering is applied.
-
2)
Horizontal noise reduction: the mean intensity of each horizontal line is subtracted from each pixel in the same line to suppress the horizontal artiest such as saturated lines and the sheath.
-
3)
Binarization: the image is transformed to a black and white (BW) image by a user defined threshold value [Fig. 3(b)].
-
4)
Area filtering: picking out the BW regions that could be potentially considered as the airway structure. Two criteria are applied: minimum area and maximum number of regions. The sheath, along with other connected components (the “stains”) with small areas is filtered out from this procedure [Fig. 3(c)].
-
5)
Dilation and bridging: the candidate regions are further dilated and bridged. Some of the previously separated structures will be connected again. An example is given in Fig. 3(d).
Moreover, when imaging a long airway segment, the bifurcations of the airway will sometimes be seen on the OCT frames. In the Cartesian coordinates, the airway structure will break into two disconnected regions. To deal with this, in the area filtering step of our algorithm, only the binarized regions with an area that is larger than our minimum area threshold will be preserved. The edge detection procedure will be carried out in these regions separately afterward.
The final segmented BW regions are considered to contain reliable airway structures. More specifically, the upper boundary of these regions could be considered as the coarse measurements of the airway lumen (the initial lumen). This operation is robust since it eliminates the defects in the images, such as the “stains,” and can handle harsh noise caused by hardware deficiencies.
2.2 Edge detection based on dynamic programming
The successful localization of the airway regions provides solid foundation for the edge detection procedure where the precise boundary locations are indicated. The dynamic programming (DP) algorithm is the cored method introduced in this step. Developed from the graph theory, the major concept of this algorithm was first invented by Richard Bellman in the 1940s [19]. Since then, this algorithm has found widespread applications including the shortest path calculation in computer gaming, the optimal consumption and saving in economic planning, and edge detections in computer vision. Prior to our work, the DP algorithm has been successfully applied to the segmentation of OCT images such as the delineation of the multiple retinal layers [20–23] and corneal layer boundaries [24]. The major feature of this algorithm when applied to edge detection is that it can preserved the continuity of the boundary, which means that it is less affected by outliers. Also, compared to other graph-based edge detection methods [25], the DP algorithm is an efficient graph solving method that has a quadratic time complexity.
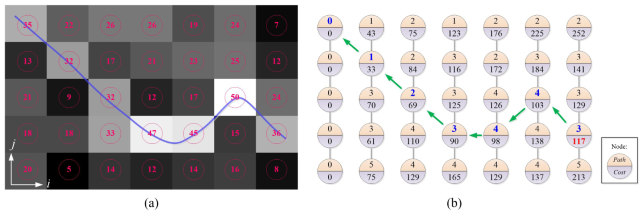
Generally, the concept of the DP algorithm is to break down the original problem into multiple small problems and then solve the original problem “recursively.” Here, the principle of the edge detection by DP algorithm is reviewed briefly. As illustrated in an example in Fig. 4, the input image is a gradient image of the original image with the edge features protruding from the background; each pixel in the image is considered a node in a graph and thus the edge detection process is transformed to a path finding process. Generally, two steps are taken to find the optimal path: graph construction and recursive solution finding. The graph construction step is to assign cost values to each node in the graph; in our implementation, the cost for node (i, j) is given by:
| (1) |
where λ is a scale factor; i, j are the transverse direction and vertical (depth) direction, respectively; and
Fig. 4.
DP principle: (a) a given image where the number is the pixel intensity, and the blue line is the edge. (b) The path and cost calculated according to Eq. (1). The minimum cost is given by the 4th node in the last column; the shortest path is traced back starting from this node (green arrows).
| (2) |
Calculating the cost for each node is actually measuring its similarities against three of the neighboring nodes at the right side. Thus, the graph construction process is starts from the left side of the graph and ends at the right side. While getting the cost for each node, anther parameter is also recorded for each node:
| (3) |
which logs the possible solutions for getting the shortest path. After constructing the graph, the solution finding stage is carried out by first finding the minimum cost at the last column, which in fact represents the total minimum cost for the shortest path in the constructed graph and then locates the shortest path by retrieving the neighboring node locations recorded by the path (i, j) parameters one by one. As illustrated in Fig. 4 (b), the total minimum cost is given by the fourth node in the last column, and then the solution is resolved by interpreting the path values starting from this node and ends in the first node at the first column.
In our application, the gradient image is first generated to highlight the edges in the original image. Unlike retinal OCT images, the airway structure in Cartesian OCT images is curvy. Thus, in order to get better represented edges, the gradient image G is given by the L2 norm of the horizontal gradient gx and vertical gradient gy:
| (4) |
Next, the detection of multiple layer structures in the airway OCT images follows three steps:
-
1)
Graph construction: identify the region-of-interest (ROI) for each edge. To extract an unknown edge, a known reference edge will be used. Given this reference edge, two offsets are used to define the ROI for the current edge. These offsets are the positive and negative y-offsets with respect to the reference edge. They define how many pixels above and below the edge should be taken as the ROI/graph. In this way, a region of constant height could be defined, and the graph is constructed from the gradient image of the same region after flattening.
-
2)
Edge localization: using the dynamic programming algorithm, the precise position for each edge is extracted by solving the shortest path problem in the constructed graph.
-
3)
Edge refinement: the edge is further smoothed by averaging neighboring edge pixels.
The precise lumen is extracted as the first step. The initial lumen extracted in the pre-processing step was used as the reference edge, and a graph [Fig. 5(a)] is constructed using the two offsets defined for the lumen edge. After solving the precise lumen (the green edge in Fig. 5), another graph [Fig. 5(e)] was constructed using the precise lumen as the reference and two different offsets to find the outer boundary of the airway (the yellow edge in Fig. 5). After these two edges, a closed region wrapped by the lumen and the outer boundary was defined as the final graph [Fig. 5(c)] to extract the boundary between the mucosa and submucosa layers, namely the middle edge, and thus the two other edges will be avoided. Figure 5 shows the intermediate results for one sample image. Figures 5(a), 5(c) and 5(e) show the flattened ROI (graph) for the lumen, the middle edge and the outer boundary, respectively. Moreover, around the bifurcation segment in the airway, the graphs for each disconnected regions are constructed separately according to the disconnected initial lumen, and the DP algorithm is carried out to subsequently find the edges for each region.
Fig. 5.
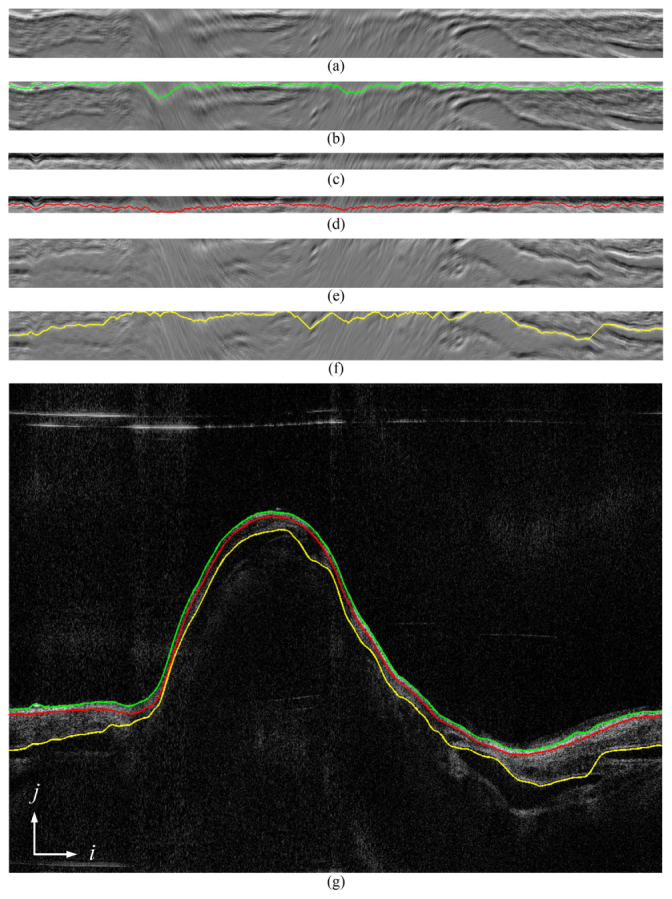
The process of finding multiple edges: (a), (c), and (e) are a flattened graph constructed from gradient images of the airway lumen, the mucosa and the submucosa layer; (b), (d), and (f) are the corresponding shortest paths obtained by the DP algorithm of (a), (c) and (e), respectively; (g) is the original OCT image overlaid with the edges detected.
Figures 5(b), 5(d) and 5(f) show the extracted minimum path solved by the dynamic programming algorithm. Figure 5(g) shows the original airway image overlaid with the detected edges. It can be seen that the mucosa and submucosa layers are detected accurately. The smoothness of these edges is successfully preserved against multiple distractions, such as speckle noise and cartilages.
Finally, to accurately quantify the airway layer thickness, only the regions that are penetrated by the laser beam with an orthogonal direction should be taken into consideration. Therefore, after the delineation of the whole airway structure, these regions were selected based on a given flatness threshold on the Cartesian images. The average thickness of different layers could be obtained easily afterward.
3. Results
3.1 OCT system setup and animal preparation
To verify the flexibility of our algorithm, the images acquired by the LR-SSOCT system reported by our group previously [10, 11] were used as the test set. The LR-SSOCT system utilized a customized imaging probe that rotates at 1500 rpm with a pullback speed of 12.5mm/s. In order to achieve long range imaging, the probe was designed to have an extended working distance of 20 mm and the axial resolution was 10 μm in tissue. Imaging of airways with a maximum diameter of 50 mm and 20 cm length can be achieved with this system.
Specifically, airway OCT image data sets of two different animals acquired by this LR-SSOCT system were used: a sheep airway data set and a pig airway data set. These images were taken on convenience samples from an ongoing study which involves a clinically relevant model of lung failure due to inhalation of wood bark smoke and cutaneous burn. For both the sheep and the pig samples, uninjured baseline airway OCT images were acquired after induction of anesthesia to the animals. Additionally, for monitoring the conditions and progression of smoke inhalation injury, OCT images were acquired after smoke inhalation injury was induced [26].
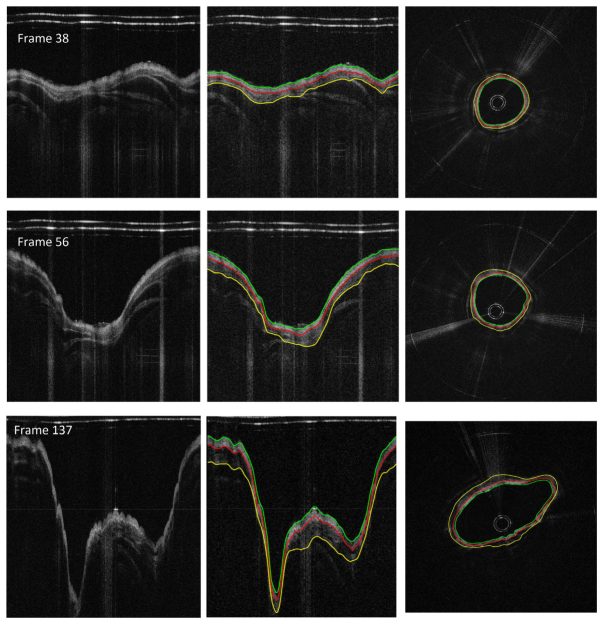
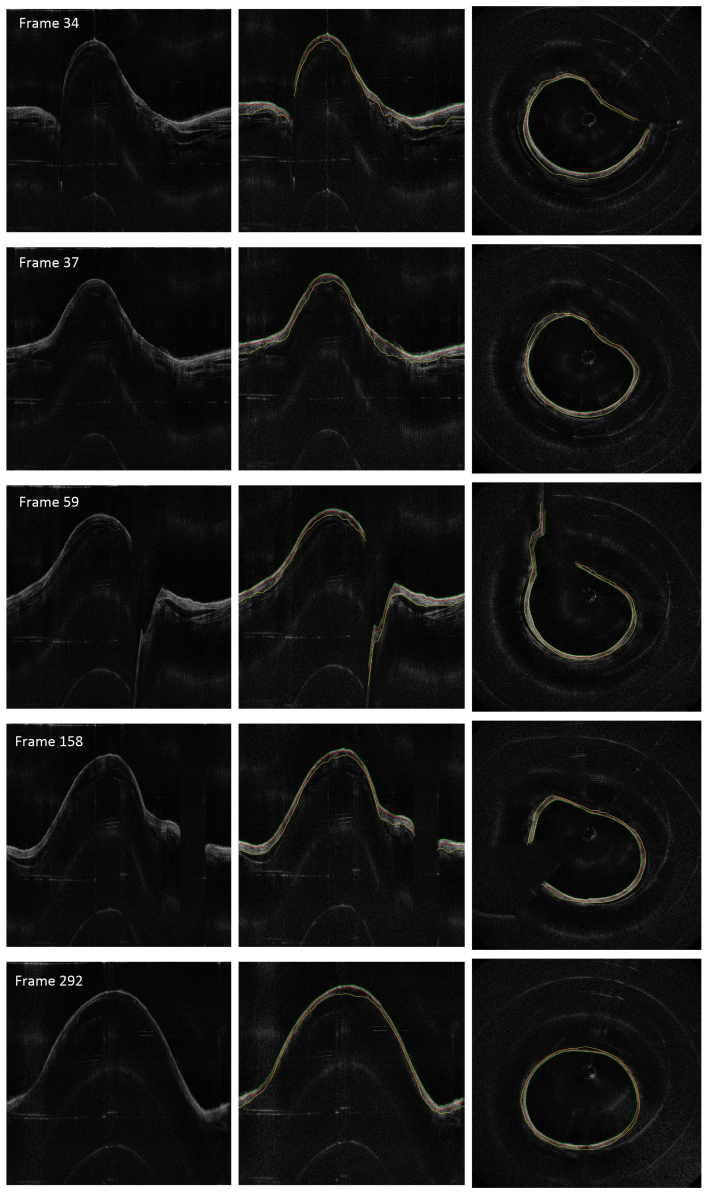
Figures 6 and 7 illustrate the edge detection results in different frames in baseline data sets of the sheep and pig samples, respectively. As can be seen, even when some of the airway wall was not in the OCT imaging zone with the highest sensitivity, the airway wall was detected accurately. Also, the algorithm could effectively deal with the bifurcation of the airway; the layers in the disconnected areas were extracted successfully.
Fig. 6.
Illustration of the edge detection results in different OCT airway images taken from the pig data set. From left to right: the original images, the Cartesian coordinate images with edge detected, the circumferential images.
Fig. 7.
Illustration of the edge detection results in different OCT airway images taken from the sheep data set. From left to right: the original images, the Cartesian coordinate images with edge detected, the circumferential images.
3.2 Auto-manual segmentation comparison
Manual segmentation was performed to evaluate the performance of the proposed auto-segmentation method on the baseline OCT airway images. Specifically, the manual segmentation was done by clicking 30-50 points on an edge and then spline-fitting these points to determine the actual edge. The spline-fitting curve could be modified by adding or removing specific control points until the annotator was satisfied with the result. In total, 100 frames of healthy sheep airway OCT images picked randomly from data sets containing 400 images, and 50 frames of healthy pig airway OCT images picked from data sets with 200 images were manually annotated. Among the results, all three edges of interest were detected.
To quantify the measurement accuracy of the proposed segmentation algorithm against manual segmentation, two validation metrics are used: the root mean square error (RMSE) and the mean absolute deviation (MAD), which are given by:
| (5) |
where A is the auto-segmentation result, M is the manual-segmentation result, and n is the total number of pixels. We compared the auto-manual segmentation accuracy in the airway regions with clear layer structures, and the results are listed in Table 1. Compared to the penetration depth of the LR-SSOCT system, which is about 2 mm, the deviation of the auto and manual segmentation results is less than 1% of the total tissue depth. The error rates of the sheep and the pig airway are similar to each other, demonstrating the proposed algorithm’s robustness across different animals with different airway diameter. The localization of the airway lumen and the mucosa/submucosa edge are more accurate than that of the submucosa/cartilage edge; this is believed to be caused by the signal degradation in deeper tissue.
Table 1. Comparison of manual and automatic segmentation results.
| Sample | Edge type | RMSE | MAD | |||
|---|---|---|---|---|---|---|
| Pixels | Microns | Pixels | Microns | |||
| Pig airway |
The airway wall lumen | 0.6858 | 8.2296 | 0.6232 | 7.4784 | |
| Mucosa/submucosa edge | 1.6523 | 19.8276 | 1.1568 | 13.8816 | ||
| Submucosa/cartilage edge | 1.8874 | 22.6488 | 1.3524 | 16.2288 | ||
| Sheep airway | The airway wall lumen | 0.8789 | 10.5462 | 0.7781 | 10.8117 | |
| Mucosa/submucosa edge | 1.9323 | 23.1876 | 1.1823 | 14.1876 | ||
| Submucosa/cartilage edge | 2.1231 | 25.4770 | 1.5482 | 18.5777 | ||
3.3 Airway thickness changes during smoke inhalation measured by the proposed algorithm
The diagnosis of inhalation injury is a primary unresolved problem in modern burn care. Using the purposed segmentation algorithm, comparable quantitative measurements of the airway layers postinjury could be obtained automatically. For the pig data set, the OCT images acquired at baseline and 1-hr post smoke injury were analyzed using our algorithm. For each time point, 10 images were used for layer thickness measurement. These images were all acquired at the same landmark, which was the right mainstem bronchus near the proximal secondary bronchus branch. As stated previously, only the orthogonally laser penetrating areas of the airway were selected for thickness measurement.
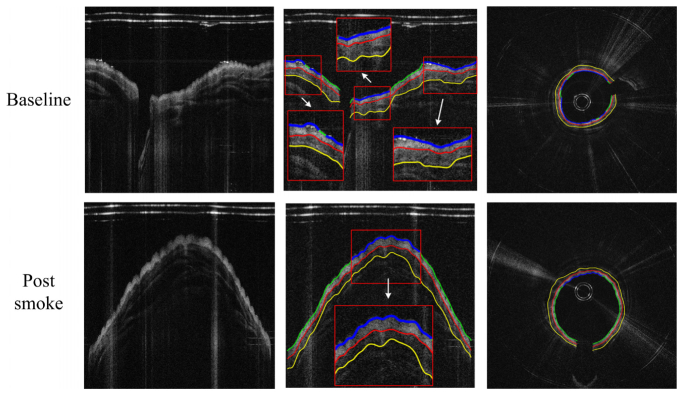
The detection results for the pig airway images in the same location at baseline and post smoke are shown in Fig. 8. The magnified regions display the automatically selected regions for thickness quantification. The circumferential images (transformed from the Cartesian images below) in the right column of Fig. 8 provide better views of the airway substructures and the segmentation results.
Fig. 8.
Thickness measurement comparison between baseline and post-smoke images of the pig data set. From left to right: original images, edge extracted images (thickness measured regions enlarged), and circumferential images.
To verify the thickness measured by the automatic algorithm, manual results were obtained on all the images with the same protocol described in Section 3.2. Here we use three quality metrics for comparison: Average Thickness (AVGT), Root-Mean-Square Thickness Difference (RMSTD), and Dice’s similarity Coefficient (DSC):
| (6) |
where A and M are the auto and manual segmentation edges at pixel i, with the superscript t and b indicating the top and bottom edges, respectively; X and Y are the auto and manual segmented layer regions; and n is the total pixel number.
Table 2 listed the comparison results for the pig data set. Even though the thickness of both the mucosa and submucosa layer increased post smoke, the RMSTD between auto-manual segmentation remained at a relatively low value. The segmentation accuracy for the submucosa layer suffered from a small decrease at the post smoke time point, the DSC for the auto-selected region dropped 9.6% compared to the baseline value.
Table 2. Average thickness measurement results for the pig data set*.
| auto AVGT | manual AVGT | mean RMSTD | mean DSC | |||||
|---|---|---|---|---|---|---|---|---|
| pixels | mm | pixels | mm | pixels | mm | |||
| Baseline | Layer 1 | 31.63 | 0.380 | 30.55 | 0.367 | 2.89 | 0.035 | 0.950 |
| Layer 2 | 49.44 | 0.593 | 48.26 | 0.579 | 4.30 | 0.052 | 0.953 | |
| Post smoke | Layer 1 | 40.22 | 0.483 | 41.04 | 0.492 | 3.68 | 0.044 | 0.922 |
| Layer 2 | 62.85 | 0.754 | 65.20 | 0.782 | 8.28 | 0.099 | 0.871 | |
*Layer 1: mucosa layer; Layer 2: submucosa layer
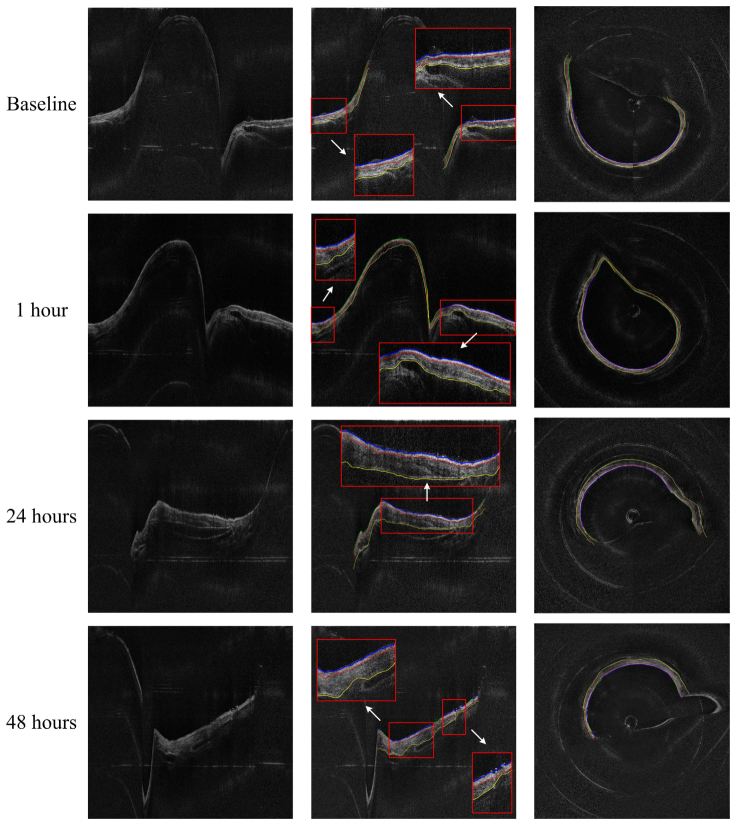
The sheep data set contains OCT images acquired at baseline, 1-hr, 24-hrs, and 48-hrs postinjury. These images at different time points were analyzed using our algorithm with the same set of parameters. Figure 9 shows the sample airway images and the edge detection results in the same location at different time points. The magnified regions of the Cartesian images and the circumferential images in Fig. 9 show better details of the airway substructures, the segmentation results and the automatic selected regions for thickness quantification. It can be seen that all the three edges were determined accurately using the proposed algorithm, even under obvious thickness changes across different time points.
Fig. 9.
Thickness measurement comparison between baseline and post-smoke images of the sheep data set. From left to right: original images, edge extracted images (thickness measured regions enlarged), and circumferential images.
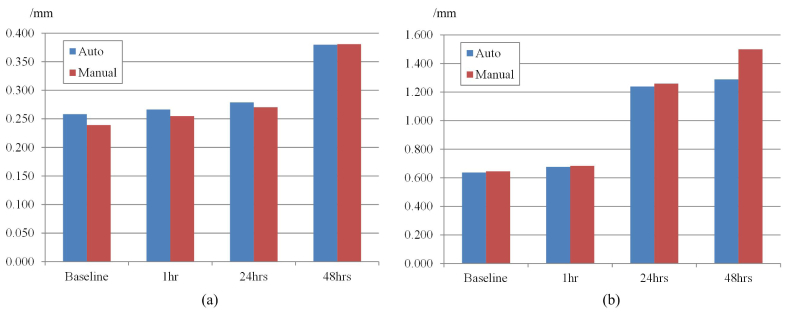
Figure 10 illustrates the thickness changes of the mucosa and submucosa layers measured by both automatic algorithm and manual operation across these four time points. The thickness of these layers both increase as the time postinjury increases within this 48-hrs period, and the thickness of the submucosa layer grew more dramatically than the mucosa layer. Also notice that although the thicknesses of both layers changed at different time points, the values measured by the auto and the manual method were very close. The maximum deviations between the auto and manual results were less than 0.022mm and 0.21mm for the mucosa and submucosa layers, respectively.
Fig. 10.
Thickness of the (a) mucosa and (b) submucosa changes according to the time post-smoke.
More comparison results are listed in Table 3. The DSC for all the tested images were at high values indicating that the regions segmented by the automatic algorithm were identical to those segmented manually. The RMSTD between auto and manual segmentation for layer 1 (the mucosa layer) remains below 0.06 mm across all four time points while for layer 2, the RMSTD value increases from 0.036 mm in baseline to 0.328 mm in 48 hours. This is due to the limitation of the penetration depth of the OCT system: in the postinjury case, the thickness of the airway grows almost two-fold in 48 hours compared to the baseline. The OCT signal was attenuated in deeper tissue which led to blurry edges between the submucosa and the cartilages.
Table 3. Average thickness measurement results for the sheep data set*.
| auto AVGT | manual AVGT | mean RMSTD | mean DSC | |||||
|---|---|---|---|---|---|---|---|---|
| pixels | mm | pixels | mm | pixels | mm | |||
| Baseline | Layer 1 | 21.52 | 0.258 | 19.93 | 0.239 | 3.03 | 0.036 | 0.926 |
| Layer 2 | 53.09 | 0.637 | 53.76 | 0.645 | 3.25 | 0.039 | 0.965 | |
| 1 hour | Layer 1 | 22.20 | 0.266 | 21.22 | 0.255 | 3.67 | 0.044 | 0.911 |
| Layer 2 | 56.36 | 0.676 | 56.94 | 0.683 | 7.14 | 0.086 | 0.940 | |
| 24 hours | Layer 1 | 23.22 | 0.279 | 22.53 | 0.270 | 3.89 | 0.047 | 0.884 |
| Layer 2 | 103.21 | 1.239 | 104.96 | 1.259 | 14.05 | 0.169 | 0.941 | |
| 48 hours | Layer 1 | 31.63 | 0.380 | 31.72 | 0.381 | 4.58 | 0.055 | 0.911 |
| Layer 2 | 107.39 | 1.289 | 124.91 | 1.499 | 27.33 | 0.328 | 0.908 | |
*Layer 1: mucosa layer; Layer 2: submucosa layer
4. Discussion
We presented, for the first time, a graph-theory-based automatic segmentation method for airway OCT image segmentation and demonstrated that this method could be implemented to successfully solve layer segmentation problems in airway OCT images. The robustness of our approach is ensured in two ways: the pre-processing is simple yet stable enough for regular OCT noise, and the dynamic programming method ensures precise extraction while preserving the smoothness of the edges. Also, our method is fast: the computational cost for the DP algorithm is within quadratic time. The average processing time for a single OCT image at the size of 2000*2000 pixels is 4.176 seconds with MATLAB based codes running on an Intel Core i7 workstation. This means that to process a full data set containing 400 images will take less than half an hour. The algorithm was based on pure post-processing of the OCT images, thus it is not relevant to the OCT hardware setup. Thus our method can be integrated to real world clinical applications directly, and the diagnostic efficiency can be greatly improved. More importantly, the automatic processing also gives quantitative measurement of pathophysiological parameters of the airway which could benefit the accurate diagnosis of airway abnormalities by given comparable standards. Compared to manual segmentation, these parameters remove any observer variations and, therefore, are more reliable.
The proposed algorithm has a number of limitations. In some cases, the outer boundary of the airway could not be successfully delineated due to the limited penetration depth and the non-uniform axial sensitivity distribution of OCT systems. In addition, since the airway structure is not completely circular and the probe is not always in the center, when the OCT beam is near tangent to the tissue surface, the OCT signal is degraded. Improving the OCT hardware performance could minimize these problems. Finally, to improve the processing speed of the proposed algorithm, the major barrier is the computational cost for solving the shortest path problem in the constructed graph. This process can be accelerated by implementing the algorithm on parallel processors such as the Graphical Processing Units (GPUs).
5. Conclusion
A fully automatic airway wall structure segmentation method for endoscopic optical coherence tomography images is presented in this paper. Based on the graph theory and the dynamic programming algorithm, the proposed approach could be used to delineate the boundaries among the mucosa, the submucosa and the cartilages in upper airway wall OCT images. We demonstrated the robustness of our algorithm against multiple defects and noise in the raw input image in manual-auto cross validation experiments. Both sheep and pig airway OCT images acquired during smoke inhalation were evaluated by our algorithm, and accurate quantitative thickness changes in two different layers were obtained.
Acknowledgments
We thank Danny Chou and Joseph Jing for kindly providing the airway OCT data. This work was supported by the National Institutes of Health (NIH) under grants R01HL-125084, R01HL-127271, R01HL-105215, R01EY-021529, P41-EB015890; the National Natural Science Foundation of China (NSFC) (No. 61307015); and the Program for Professor of Special Appointment (Eastern Scholar) at Shanghai Institutions of Higher Learning (No. TP2014061). Li Qi was supported by the China Scholarship Council (CSC). Dr. Zhongping Chen has a financial interest in OCT Medical, Inc., which, however, did not provide support for this work.
References and links
- 1.Traber D. L., Linares H. A., Herndon D. N., Prien T., “The pathophysiology of inhalation injury--a review,” Burns 14(5), 357–364 (1988). 10.1016/0305-4179(88)90003-4 [DOI] [PubMed] [Google Scholar]
- 2.Cox R. A., Burke A. S., Soejima K., Murakami K., Katahira J., Traber L. D., Herndon D. N., Schmalstieg F. C., Traber D. L., Hawkins H. K., “Airway obstruction in sheep with burn and smoke inhalation injuries,” Am. J. Respir. Cell Mol. Biol. 29(3), 295–302 (2003). 10.1165/rcmb.4860 [DOI] [PubMed] [Google Scholar]
- 3.Cancio L. C., “Current concepts in the pathophysiology and treatment of inhalation injury,” J. Trauma 7(1), 19–35 (2005). 10.1191/1460408605ta327oa16096534 [DOI] [Google Scholar]
- 4.Hubbard G. B., Langlinais P. C., Shimazu T., Okerberg C. V., Mason A. D., Jr, Pruitt B. A., Jr., “The morphology of smoke inhalation injury in sheep,” J. Trauma 31(11), 1477–1486 (1991). 10.1097/00005373-199111000-00003 [DOI] [PubMed] [Google Scholar]
- 5.Pruitt B. A., Jr, Cioffi W. G., “Diagnosis and treatment of smoke inhalation,” J. Intensive Care Med. 10(3), 117–127 (1995). 10.1177/088506669501000303 [DOI] [PubMed] [Google Scholar]
- 6.Ridgway J. M., Ahuja G., Guo S., Su J., Mahmood U., Chen Z., Wong B., “Imaging of the pediatric airway using optical coherence tomography,” Laryngoscope 117(12), 2206–2212 (2007). 10.1097/MLG.0b013e318145b306 [DOI] [PubMed] [Google Scholar]
- 7.Brenner M., Kreuter K., Ju J., Mahon S., Tseng L., Mukai D., Burney T., Guo S., Su J., Tran A., Batchinsky A., Cancio L. C., Narula N., Chen Z., “In vivo optical coherence tomography detection of differences in regional large airway smoke inhalation induced injury in a rabbit model,” J. Biomed. Opt. 13(3), 034001 (2008). 10.1117/1.2939400 [DOI] [PMC free article] [PubMed] [Google Scholar]
- 8.Yin J., Liu G., Zhang J., Yu L., Mahon S., Mukai D., Brenner M., Chen Z., “In vivo early detection of smoke-induced airway injury using three-dimensional swept-source optical coherence tomography,” J. Biomed. Opt. 14(6), 060503 (2009). 10.1117/1.3268775 [DOI] [PMC free article] [PubMed] [Google Scholar]
- 9.Lee S.-W., Heidary A. E., Yoon D., Mukai D., Ramalingam T., Mahon S., Yin J., Jing J., Liu G., Chen Z., Brenner M., “Quantification of airway thickness changes in smoke-inhalation injury using in-vivo 3-D endoscopic frequency-domain optical coherence tomography,” Biomed. Opt. Express 2(2), 243–254 (2011). 10.1364/BOE.2.000243 [DOI] [PMC free article] [PubMed] [Google Scholar]
- 10.Jing J., Zhang J., Loy A. C., Wong B. J. F., Chen Z., “High-speed upper-airway imaging using full-range optical coherence tomography,” J. Biomed. Opt. 17(11), 110507 (2012). 10.1117/1.JBO.17.11.110507 [DOI] [PMC free article] [PubMed] [Google Scholar]
- 11.Chou L., Batchinsky A., Belenkiy S., Jing J., Ramalingam T., Brenner M., Chen Z., “In vivo detection of inhalation injury in large airway using three-dimensional long-range swept-source optical coherence tomography,” J. Biomed. Opt. 19(3), 36018 (2014). 10.1117/1.JBO.19.3.036018 [DOI] [PMC free article] [PubMed] [Google Scholar]
- 12.Zhang J., Nelson J. S., Chen Z., “Removal of a mirror image and enhancement of the signal-to-noise ratio in Fourier-domain optical coherence tomography using an electro-optic phase modulator,” Opt. Lett. 30(2), 147–149 (2005). 10.1364/OL.30.000147 [DOI] [PubMed] [Google Scholar]
- 13.Lee A. M. D., Kirby M., Ohtani K., Candido T., Shalansky R., MacAulay C., English J., Finley R., Lam S., Coxson H. O., Lane P., “Validation of airway wall measurements by optical coherence tomography in porcine airways,” PLoS One 9(6), e100145 (2014). 10.1371/journal.pone.0100145 [DOI] [PMC free article] [PubMed] [Google Scholar]
- 14.Heydarian M., Choy S., Wheatley A., McCormack D., Coxson H. O., Lam S., Parraga G., “Automated segmentation of lung airway wall area measurements from bronchoscopic Optical Coherence Tomography imaging,” Proc. SPIE 7965(519), 1–9 (2011). [Google Scholar]
- 15.Kirby M., Lee A. M. D., Candido T., Macaulay C., Lane P., Lam S., Coxson H. O., “Automated segmentation of porcine airway wall layers using optical coherence tomography : comparison with manual segmentation and histology,” Proc. SPIE 8927, 1–9 (2014). [Google Scholar]
- 16.Jian Z., Yu L., Rao B., Tromberg B. J., Chen Z., “Three-dimensional speckle suppression in Optical Coherence Tomography based on the curvelet transform,” Opt. Express 18(2), 1024–1032 (2010). 10.1364/OE.18.001024 [DOI] [PMC free article] [PubMed] [Google Scholar]
- 17.Du Y., Liu G., Feng G., Chen Z., “Speckle reduction in optical coherence tomography images based on wave atoms,” J. Biomed. Opt. 19(5), 056009 (2014). 10.1117/1.JBO.19.5.056009 [DOI] [PMC free article] [PubMed] [Google Scholar]
- 18.Zhang J., Nelson J. S., Chen Z., “Removal of a mirror image and enhancement of the signal-to-noise ratio in Fourier-domain optical coherence tomography using an electro-optic phase modulator,” Opt. Lett. 30(2), 147–149 (2005). 10.1364/OL.30.000147 [DOI] [PubMed] [Google Scholar]
- 19.Bellman R., “On the theory of dynamic programming,” Proc. Natl. Acad. Sci. U.S.A. 38(8), 716–719 (1952). 10.1073/pnas.38.8.716 [DOI] [PMC free article] [PubMed] [Google Scholar]
- 20.Chiu S. J., Li X. T., Nicholas P., Toth C. A., Izatt J. A., Farsiu S., “Automatic segmentation of seven retinal layers in SDOCT images congruent with expert manual segmentation,” Opt. Express 18(18), 19413–19428 (2010). 10.1364/OE.18.019413 [DOI] [PMC free article] [PubMed] [Google Scholar]
- 21.Huang S., Piao Z., Zhu J., Lu F., Chen Z., “In vivo microvascular network imaging of the human retina combined with an automatic three-dimensional segmentation method,” J. Biomed. Opt. 20(7), 076003 (2015). 10.1117/1.JBO.20.7.076003 [DOI] [PMC free article] [PubMed] [Google Scholar]
- 22.Chiu S. J., Toth C. A., Bowes Rickman C., Izatt J. A., Farsiu S., “Automatic segmentation of closed-contour features in ophthalmic images using graph theory and dynamic programming,” Biomed. Opt. Express 3(5), 1127–1140 (2012). 10.1364/BOE.3.001127 [DOI] [PMC free article] [PubMed] [Google Scholar]
- 23.Tian J., Marziliano P., Baskaran M., Tun T. A., Aung T., “Automatic segmentation of the choroid in enhanced depth imaging optical coherence tomography images,” Biomed. Opt. Express 4(3), 397–411 (2013). 10.1364/BOE.4.000397 [DOI] [PMC free article] [PubMed] [Google Scholar]
- 24.LaRocca F., Chiu S. J., McNabb R. P., Kuo A. N., Izatt J. A., Farsiu S., “Robust automatic segmentation of corneal layer boundaries in SDOCT images using graph theory and dynamic programming,” Biomed. Opt. Express 2(6), 1524–1538 (2011). 10.1364/BOE.2.001524 [DOI] [PMC free article] [PubMed] [Google Scholar]
- 25.Kaba D., Wang Y., Wang C., Liu X., Zhu H., Salazar-Gonzalez A. G., Li Y., “Retina layer segmentation using kernel graph cuts and continuous max-flow,” Opt. Express 23(6), 7366–7384 (2015). 10.1364/OE.23.007366 [DOI] [PubMed] [Google Scholar]
- 26.Batchinsky A. I., Burkett S. E., Zanders T. B., Chung K. K., Regn D. D., Jordan B. S., Necsoiu C., Nguyen R., Hanson M. A., Morris M. J., Cancio L. C., “Comparison of airway pressure release ventilation to conventional mechanical ventilation in the early management of smoke inhalation injury in swine,” Crit. Care Med. 39(10), 2314–2321 (2011). 10.1097/CCM.0b013e318225b5b3 [DOI] [PubMed] [Google Scholar]


