
Figure 1. Surface PS exposure on viable human cancer cells.
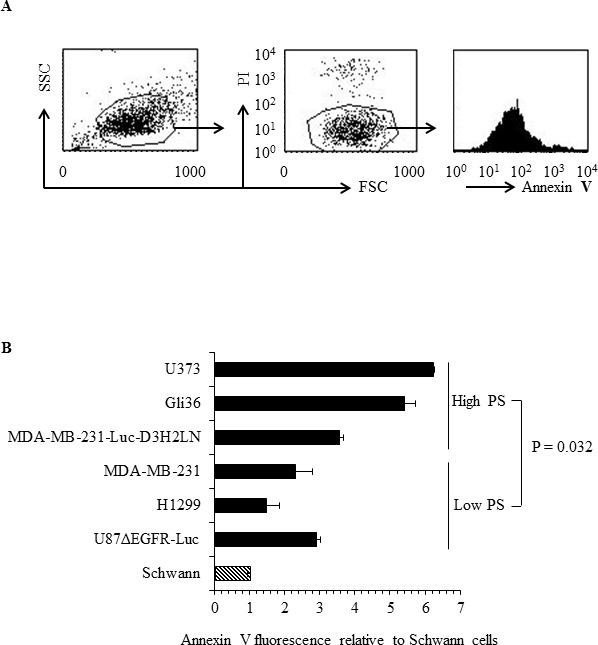
A. Representative FACS profile of the annexin V FITC binding analyses. Left panel shows forward vs side scatter, middle panel shows gating on live cells by excluding PI positive dead cells. Right panel shows annexin V FITC profile. B. Geometrical mean fluorescence signal of annexin V FITC signal from indicated cell types relative to Schwann cells.