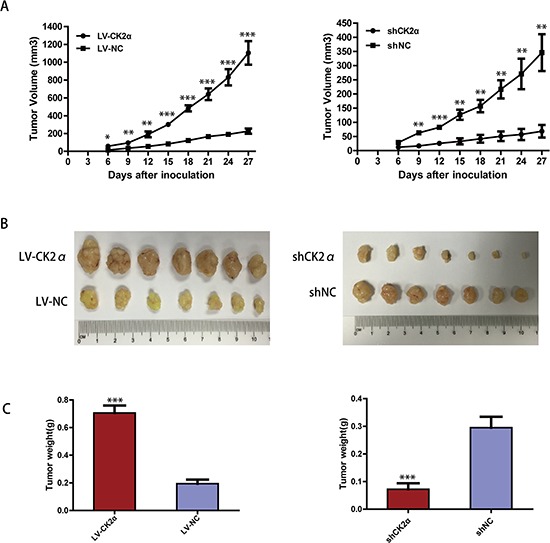
Figure 9. CK2α increase the tumorigenicity of HCC in vivo .

A. The tumor growth curves for each group. The tumor growth rate was elevated in the tumors that overexpressed CK2α (left) and reduced in the tumors that CK2α-silenced (right). B. Photographs of dissected tumors from the nude mice. The final tumor volumes were larger in the tumors that overexpressed CK2α (left) and smaller in the tumors that CK2α-silenced (right) than that in the control group. C. The tumor weights of each group. The final tumor weights were increased in the tumors that overexpressed CK2α (left) and decreased in the tumors that CK2α-silenced (right). P-values were calculated using the independent Student's t-test. *P < 0.05 versus control; **P < 0.01 versus control; ***P < 0.001 versus control.
