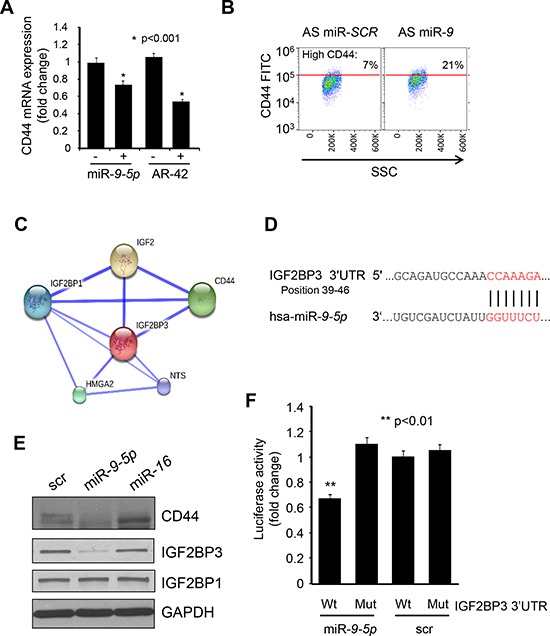
Figure 4. IGF2BP3 is the direct target of miR-9-5p.

A. MM.1S cells were transfected with miR-9-5p, or negative control miR precursor (Ctrl) and analyzed for the expression of CD44 mRNA by qRT-PCR. For comparison, U266 cells treated with 0.2 μM AR-42 (+), or vehicle control (−) were also included in the analysis. B. Bivariate dot plot of the CD44 expression in MM.1S cells transfected with AS miR-SCR, or AS miR-9 and determined by flow cytometry. The percentages indicate the amount of events expressing the highest level of CD44. C. Diagram generated based on STRING database showing functional interaction networks between IGF2BP1, IGF2BP3, and CD44 D. IGF2BP3 3′UTR contains seed sequence for miR-9-5p (indicated in red). E. L363 cells were transfected with miR-9-5p, miR-16, or scramble control and 48 hrs later 80 μg of protein extract was analyzed by western blot for the levels of IGF2BP3 and IGF2BP1. GAPDH served to normalize the data. F. The luciferase reporter genes containing IGF2BP3 3′UTR, either wild type (Wt), or mutant at the predicted miR-9-5p binding site (Mut), were cotransfected with miR-9-5p precursor, or negative control miR (scr) into MM.1S cells. Luciferase assay was performed 24 hrs later and the results are expressed as fold change of Wt construct cotransfected with scr miR.
